


RESEARCH PAPER
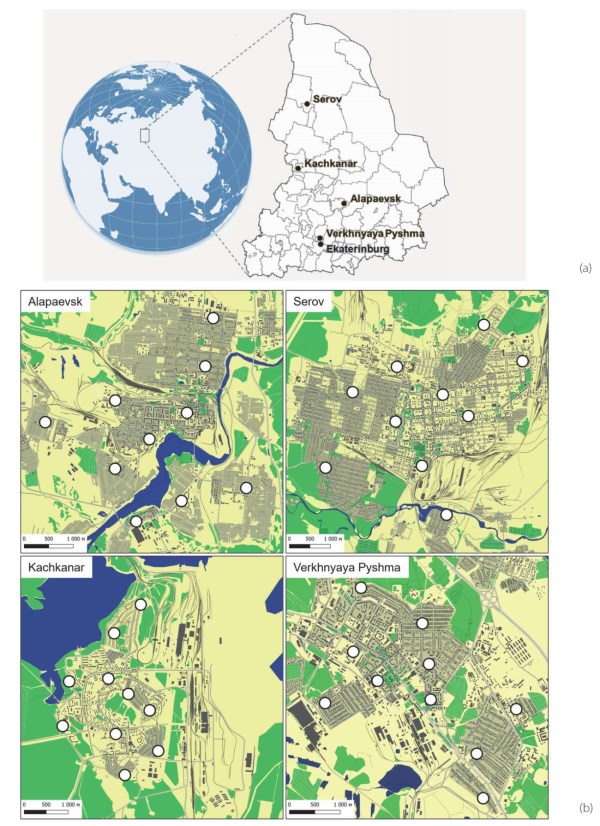
This study aims to develop and validate a method for assessing urban air pollution by analysing undisturbed snow cover in residential areas of small and medium-sized industrial cities in Sverdlovsk Region, Russia: Kachkanar, Serov, Verkhnyaya Pyshma, and Alapaevsk. Snow samples were collected in each city.
The proposed approach is based on the analysis of the most contaminated solid fraction of snow (particles >2 µm and filtrate). This method has shown effectiveness in identifying pollutants and their sources. It is also more cost-efficient and offers better material accessibility than the approach that analyses both dissolved (<0.45 µm) and suspended (>0.45 µm) snow phases. The balanced set of qualitative and quantitative indicators includes the physical and chemical properties of snow, the accumulation intensity of PTEs, the calculation of indices (Igeo, EF, PI, PIsum, PIavg, and PINemerow), dust load, and geochemical associations.
Snow’s physical and chemical properties were influenced by natural conditions. Low mineralisation and suspended solids were mostly composed of calcium and magnesium bicarbonates and sulfates. Snow pH was slightly alkaline in Serov and mildly alkaline in other cities.
Metallurgical and mining cities showed higher pollution according to the indices: elevated V and Fe in Kachkanar, Cr in Serov, Cu and As in Verkhnyaya Pyshma. Kachkanar was the most polluted city (PIsum – 154, PINemerow – 12), while Serov and Verkhnyaya Pyshma were also significantly polluted with similar PIsum and PIavg values (66 and 4.2, respectively) and PINemerow values (5.1 and 7.2, respectively). Geochemical associations reflected local industrial profiles. Dust load ranged from 27 to 163 mg/m2/day, peaking in Kachkanar.
The collected data indicate current atmospheric pollution in the studied cities. This method proved effective for assessing urban air pollution and is recommended for environmental monitoring in other industrial regions.
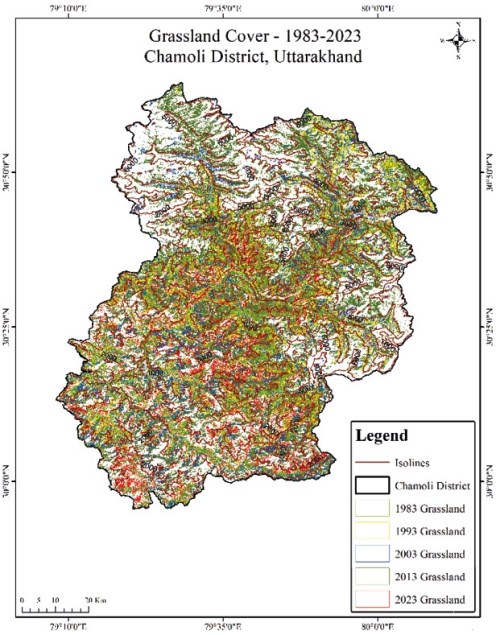
The study investigates the dynamics of land use and land cover changes and their impacts on tree cover and grasslands in the Chamoli district of Uttarakhand over four decades (1983-2023). Using multi-temporal satellite data analysis, the research examines vegetation patterns across different elevation zones ranging from 683m to 7801m. The findings reveal significant variations in tree cover, with an initial increase from 224,027 hectares in 1983 to fluctuations leading to 323,554 hectares by 2023. Tree cover showed remarkable expansion at higher elevations, particularly in the 4149-5152m zone, increasing from 147 hectares to 44,189 hectares. This indicates significant upward migration. Grassland areas demonstrated considerable variability, expanding from 93,647 hectares in 1983 to 118,330 hectares in 2023. The study identifies a clear spatial pattern with consistently higher vegetation density in the southern region, while the northern portion exhibits notably lower coverage. This north-south vegetation gradient persists throughout the temporal sequence, suggesting underlying environmental and human influences. The research also highlights concerning trends in other land cover types, including an increase in barren land and a massive decrease in snow cover, indicating significant changes. These transformations have important implications for local ecosystems, biodiversity, and communities dependent on these landscapes. The findings contribute to understanding the complex interactions between climate change, land management practices, and vegetation dynamics in high-altitude regions, providing valuable insights for conservation strategies and sustainable resource management.
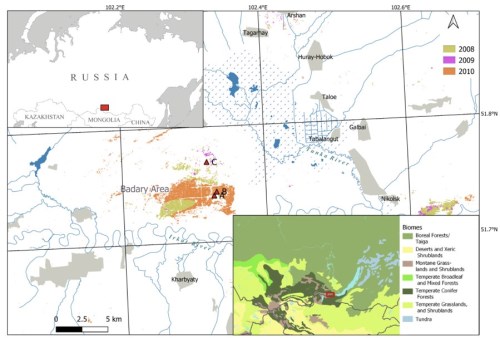
This study evaluated the reliability of the Normalised Burn Ratio (NBR) and its differenced variant (dNBR) for assessing burnt areas and post-fire forest recovery. The research was conducted in the pine forests of the Tunka Depression (Southwestern Cisbaikalia), focusing on areas affected by a 2010 wildfire. Field data consisted of annual geobotanical observations from 2014 to 2022, which documented plant community regeneration across varying degrees of fire severity. Remote sensing analysis utilised Landsat 7 imagery (30 m resolution) between 2009 and 2022. Approximately 500 cloudfree NBR values were extracted from the USGS Landsat 7 Level 2, Collection 2, Tier 1 dataset using the Google Earth Engine platform. We assessed the spatiotemporal dynamics of these indices alongside the geobotanical parameters. The results confirm the effectiveness of NBR and dNBR for mapping burnt areas and determining initial fire severity. For detecting recent burns, mid-growing season imagery was most informative. Regarding post-fire regeneration analysis, springtime dNBR data were most reliable, as the influence of herbaceous cover on the spectral signal is minimised compared to the peak growing season. However, field observations revealed that the recovery of NBR values to pre-2009 fire levels by 2021 does not indicate that plant communities have regenerated to a near-natural state. This trend of rapid NBR recovery underscores the limitation of using NBR/dNBR indices alone for assessing long-term regeneration prospects. In conclusion, the results of the synthesised analysis of geobotanical and geoinformation materials showed that while remote sensing data effectively corroborate landscape-forming processes in disturbed ecosystems, their utility in detailed regeneration studies requires calibration with field data. The findings contribute to refining the application of NBR/dNBR indices and highlight the necessity of integrated approaches for calibrating remote sensing data.
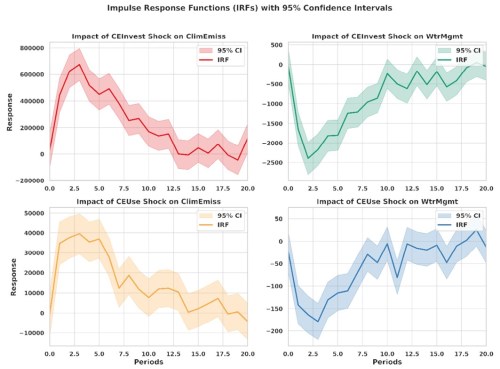
We examine how renewable energy strategies under Saudi Arabia’s Vision 2030 drive environmental sustainability in fossil fuel-dependent economies. The study analysed data from 42 firms (2012–2023) using the Generalised Method of Moments (GMM) and Impulse Response Functions (IRFs). Our findings indicate that a 1% increase in clean energy investment results in a 6.3–8.1% reduction in climate emissions and a 10.2–16.3% decrease in water challenges. A 1% increase in clean energy use lowers emissions by 5.4–7.6% and water stress by 3.2–11.4%. Policy integration amplifies outcomes. Oil-sector firms leverage scale for renewable projects while non-oil sectors face pressures from oil price volatility. IRFs confirm sustained environmental gains from renewable adoption. The study advocates integrated policies, including subsidy reallocation, lowwater renewables, and oil-sector engagement, to align economic diversification with sustainability. It also emphasises the need to address agricultural water inefficiencies and industrial energy intensity.
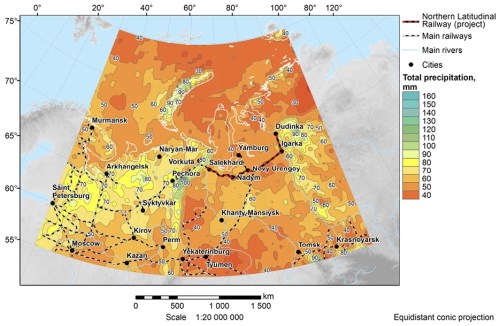
Observed climate change has significantly impacted land transportation infrastructure, including roads, railways, bridges, seaport facilities, runways, and other components. It also affects traffic management and the efficiency of the transport system, influencing maintenance costs, travel safety, and traffic flow speeds. This issue is particularly critical for the Arctic Zone of the Russian Federation (AZRF), which is undergoing rapid economic development. Despite its expanding technological infrastructure, the region remains highly vulnerable to the impacts of climate change. A comprehensive assessment of these environmental risks is essential to ensure sustainable regional growth. Observed and projected changes in temperature and humidity generally have adverse effects on the condition and operation of transportation infrastructure. The primary types of negative impacts linked to climate change have already emerged, and these trends are expected to intensify by the mid-21st century. This paper analyses projected climate change in the Western Russian Arctic for 2023–2064. Using the CNRM-CM6-1-HR model from Phase 6 of the Coupled Model Intercomparison Project (CMIP6), it evaluates three socioeconomic scenarios (SSP1-2.6, SSP2-4.5, SSP5-8.5). The results are compiled in an electronic atlas mapping the projected distribution of air and soil temperature, total precipitation, wind speed, and snow cover thickness. Analysis of projection revealed non-linear climate model variations, where parameter values can overlap across scenarios and change rates can be unexpectedly higher in optimistic pathways. These projections, assessed against a 1980–1989 baseline, were visualised in regional maps to detail hydrometeorological changes for 2023–2064. This analysis of regional climate change is vital for sustainably managing railway infrastructure. The results highlight a heterogeneous Arctic climate and identify potentially hazardous phenomena expected to increase in frequency and impact.
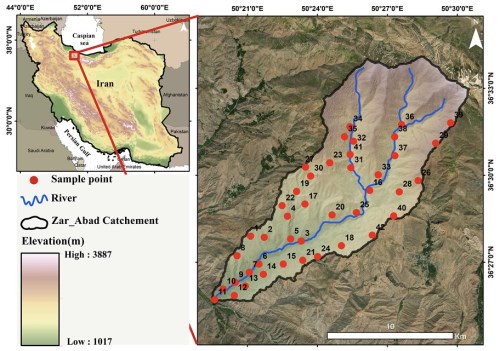
The objective of this study was to determine the impact of erosion on soil retention as an ecosystem service and its relationship with soil quality in a mountainous catchment in Iran. In this regard, 42 soil samples were collected from rangelands, rainfed, and irrigated farming areas. Thirteen physical and chemical soil attributes were measured. Principal component analysis was applied to identify a soil quality index (SQI). The respective ranges of soil erosion rates from rangelands, rainfed farming lands, and irrigated farming lands were estimated to be 0.2 – 46.4, 0.18 – 0.20, and 0.00 – 0.18 t ha−1 yr−1. The SQI estimates ranged between 3.2 – 4.0 for the rangelands compared with corresponding estimates of 4.0 – 5.7 for the rainfed farming lands and 5.7 – 8.4 for the irrigated farming lands. Soil retention was estimated to range between 0 – 0.01 t ha−1 yr−1 (average = 0.005 t ha−1 yr−1) for rangelands, 0.01 – 0.03 t ha−1 yr−1 (average = 0.02 t ha−1 yr−1) for rainfed farmlands, and 0.03 – 3.5 t ha−1 yr−1 (average = 1.8 t ha−1 yr−1) for irrigated farming lands. Negative relationships were observed among soil erosion, soil quality, and soil retention, emphasising the sensitivity of soil quality to the soil erosion rates estimated for different land use types. This study provides evidence for the negative effects of soil erosion under different land uses regarding the degradation of soil quality and soil retention as an ecosystem service.
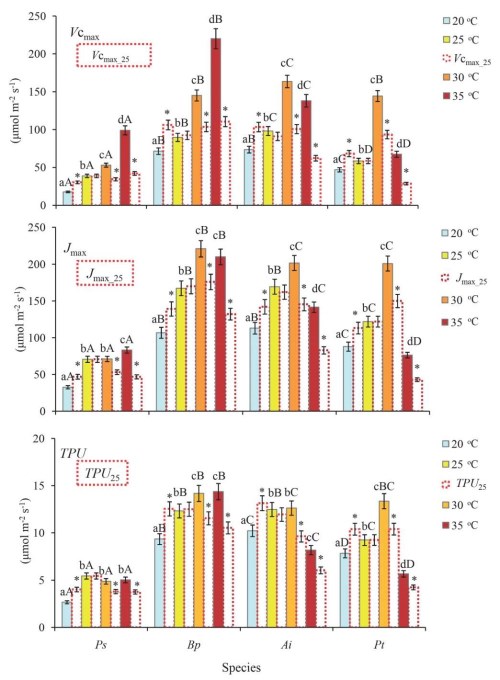
Boreal forests play a crucial role in maintaining the global ecological balance, acting as significant carbon sinks and mitigating the effects of climate change. This study examined how temperature affects photosynthesis in four boreal tree species – Pinus sylvestris, Betula pendula, Populus tremula, and Alnus incana – growing in a clear-cut of mid-taiga bilberry-type pine forest in southern Karelia, Russia. The Farquhar biochemical model was used to analyze key photosynthesis parameters, such as the maximum carboxylation rate by Rubisco (Vсmax), the maximum photosynthetic electron transport rate (Jmax), and the triose phosphate utilization (TPU) rate, under different leaf temperatures ranging from 20 to 35°C and light conditions. The results revealed significant interspecific differences in photosynthetic responses. At a leaf surface temperature of 25°C, the lowest Vcmax25, Jmax25, and TPU25 values were obtained for the 1-year-old needles of P. sylvestris (38.8, 70.7, and 5.5 μmol m-2 s-1), whereas the values were 1.5- to 2.4-fold higher for the leaves of B. pendula (93.5, 172.1, and 12.7 μmol m-2 s-1), A. incana (86.1, 155.1, and 11.4 μmol m-2 s-1), and P. tremula (58.6, 122, and 9.3 μmol m-2 s-1). Meanwhile, P. sylvestris and B. pendula had a broader optimal temperature range for Vcmax and Jmax (20–35°C), whereas A. incana and P. tremula had a narrower range (20–30°C), experiencing a decline at 35°C. In addition to having different levels of resistance to extreme temperatures, deciduous species also differed in their responsiveness to CO2 enrichment. This could lead to shifts in the composition of boreal forest species under changing climate conditions. P. sylvestris demonstrated greater stability at low light levels and a strong response to elevated CO2, indicating its high adaptability to future climate change. These results highlight the importance of considering species characteristics when predicting the carbon balance of boreal forests. They can be used to model the resilience of forest ecosystems under climate change and to plan further investigations, including studies of mature trees and the effects of additional stress factors, such as drought.
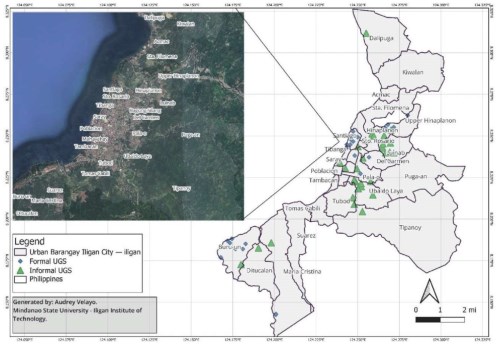
The continuous growth of urban areas, driven by population increase and commercial expansion, has led to urban problems like heat islands, pollution, and environmental damage. Greenspaces, defined as ‘green’ areas within cities that offer various advantages for human welfare and environmental quality, have become a vital strategy for addressing these significant urban issues. However, despite their clear advantages, the growth of greenspaces, particularly in the Philippines, is hindered by rapid urbanisation and an overemphasis on built infrastructure. Although extensive research exists on formal urban greenspaces, studies on informal greenspaces, especially within the Philippine context, have been limited. This study defines formal urban greenspaces as officially managed areas, such as parks, and informal urban greenspaces as unmanaged areas, like vacant lots or riverbanks. Surveys were conducted with 187 stakeholders from various sectors in Iligan City to identify their preferred nature-based solutions (NBS) and intervention types. GIS mapping was performed using quickOSM and Google Satellite through QGIS software version 3.4 to gather data on existing urban greenspaces per capita in Iligan City. The collected data were analysed using descriptive and frequency statistics. The findings indicated that mangrove restoration (62%) and urban tree planting (55%) were the most preferred interventions. GIS results showed that 72% of urban barangays failed to meet the WHO’s minimum greenspace standard of 9 m2 per capita, with an average of 5.7 m2 (SD = 2.3). The study recommends that future initiatives should concentrate on developing and expanding formal urban green spaces in the city’s urban barangays by incorporating informal greenspaces into urban planning and improving greenspace management.
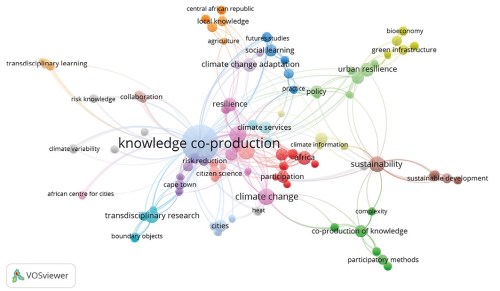
Climate change presents complex challenges for cities worldwide, requiring innovative and collaborative approaches to enhance resilience and adaptability. In response to this phenomenon, knowledge co-production plays a vital role in integrating diverse perspectives to address climate-related risks and promote adaptive urban environments. This research aims to investigate current consensus on how knowledge co-production is operationalised, particularly in climate resilience and urban settings. This study follows the Preferred Reporting Items for Systematic Reviews and MetaAnalyses (PRISMA) protocol to identify, screen, and analyse relevant publications systematically. A total of 36 publications were reviewed to examine the types of disturbances, the dimensions of stakeholder engagement, and current practices of knowledge co-production. The findings highlight the growing significance of knowledge co-production in addressing climate-related challenges through strong stakeholder engagement, local knowledge integration, and effective science– policy interfaces. Moreover, these processes require balanced and meaningful participation among all stakeholders, particularly local community involvement, to ensure that initiatives can be scaled up and become systemic rather than fragmented.
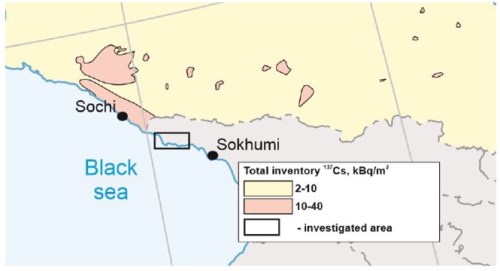
This study presents the first documented evidence of radioactive contamination in Western Abkhazia linked to the Chernobyl Nuclear Power Plant accident. The data obtained show that the level of ¹³⁷Cs radioactive contamination in the study area ranged from 50 to 160 kBq/m² in 1986. This corresponds to contemporary values of 25 to 79 kBq/m² when considering the radionuclide’s half-life. These measurements are highly consistent with data recorded in the adjacent Sochi region, where contamination levels varied between 40 and 185 kBq/m² in 1986. The local spatial variability of ¹³⁷Cs fallout was studied at four reference sites, located in different parts of the Mussera upland. All investigated sites demonstrated moderate variability, with value ranges of 17–25%. This heterogeneous distribution pattern is attributed to a combination of factors, including local topography, atmospheric deposition characteristics, and anthropogenic influence. Measurements of ambient dose equivalent rates ranged from 0.01 to 0.05 μSv/h. While no direct correlation was found between dose rates and the age or genesis of the underlying bedrock, a clear relationship was established between dose rates and terrain morphology. Elevated dose rates were consistently recorded in erosional landforms within topographically dissected areas. Analysis of peat cores from the Pitsunda Peninsula lagoon provided conclusive evidence of the Chernobyl disaster’s impact on Western Abkhazia, with a measured ¹³⁷Cs inventory of 20.7 kBq/m² (equivalent to 49.5 kBq/m² when corrected to 1986 values). Application of the non-equilibrium ²¹⁰Pb dating method yielded a peat accumulation rate of 0.1 cm/year.
The Chernobyl accident resulted in a significant release of ¹³⁷Cs, leading to widespread radioactive fallout. This document assesses the ¹³⁷Cs inventory and its impact on ambient dose rates in the affected regions.
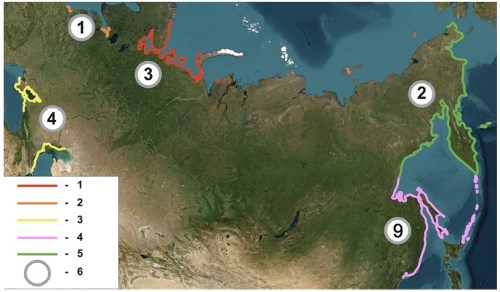
This work is dedicated to analysing the conditions conducive to the spatial succession of individual, extra-tropically persistent species. It also clarifies the distribution of seagrasses (Zosteraceae and Ruppiaceae) in different seas across three oceanic basins and the Caspian Sea, which is part of the inland drainage basin affecting the Russian Federation. A review of herbarium samples and literature on Russian seagrasses revealed five regions that differ in the number of Zosteraceae and Ruppiaceae species: the West Arctic and White Sea (3 species), the Russian section of the Baltic Sea (1 species), the Russian sections of the Black and Caspian Seas and the Sea of Azov (4 species), the south of the Russian Far East (9 species), and the north of the Russian Far East (2 species). The south of the Russian Far East is of particular interest as it serves as a refuge for some seagrasses. This is because they suffer from strong anthropogenic pressure in the main part of their range, which is located further south, whereas in Russia they experience no negative impact. In the Arctic, seagrasses have a wider distribution than was previously thought. This comprehensive study has enabled the development of new approaches to finding seagrass meadows in hard-to-access coastal areas of the Russian Federation, using remote sensing techniques and the assistance of citizen science volunteers.
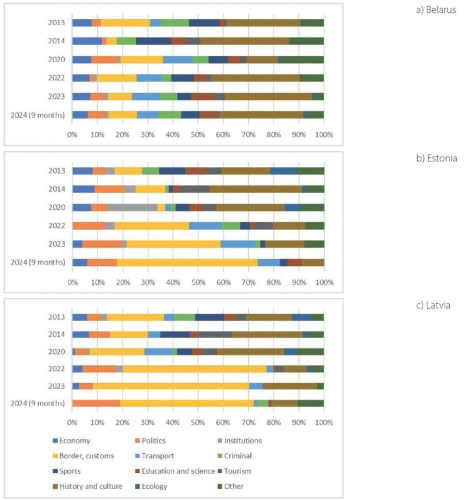
This paper uses the ‘Policy – Perception – Practice’ approach to assess the impact of neighbourhood character dynamics and restrictions on cross-border relations in the Pskov region between 2013 and 2024. The information base includes the authors’ database of documents that regulate various aspects of cross-border interactions in Russia, over 3,000 articles from Pskov media for 2013-2024, and expert interviews with government officials, as well as semi-structured interviews with the population in the regional capital and specific border towns. The analysis found that the cross-border relations of the Pskov region are asymmetric. Before the global pandemic and the geopolitical crisis of 2022, there was an emphasis on fostering cooperation with Latvia and Estonia, a collaboration that was institutionalised. The prevailing sentiment among the population, as shown by an analysis of media discourse, was that the Baltic borderland was seen only as a source of opportunities, while the Belarusian borderland was also viewed as a source of challenges. This finding underscores the imperative for cross-border cooperation to mitigate the potential for illegal activities, competitive economic pressures, illegal migration, and trade-related activities to grow without such collaboration. Despite a clear increase in the intensity of cross-border ties with Belarus after 2022, the study reveals significant shortcomings in the current approach to cross-border cooperation in Russia.
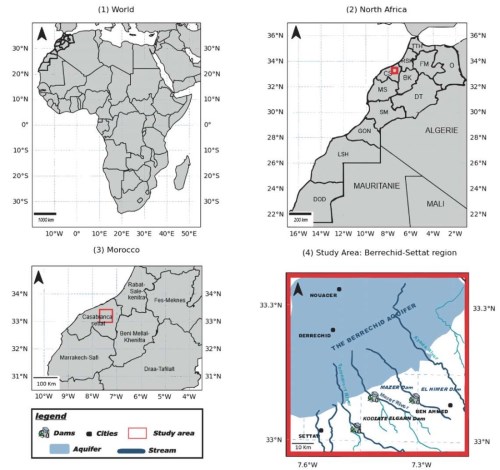
This study analyses the spatiotemporal dynamics of Land Use and Land Cover (LULC) in the Berrechid-Settat area of Morocco throughout three reference years: 2010, 2015, and 2023. Satellite images from Landsat 7 (ETM+) and Landsat 8 OLI were processed using the Google Earth Engine (GEE) platform to facilitate quick access, preprocessing, and analysis of extensive datasets. To classify LULC changes and assess the efficacy of machine learning models, Random Forest (RF), Decision Tree (DT), and Support Vector Machine (SVM) were examined. These models were used to categorise five principal LULC classes: water bodies, forests, urban regions, vegetation, and barren lands. Our findings indicated that Random Forest consistently yielded the highest classification accuracy, achieving an Overall Accuracy (OA) of 91.84% and a Kappa Coefficient (KC) of 0.86 in 2023, thereby affirming its efficacy for multi-temporal land use and land cover mapping. The Decision Tree exhibited competitive performance in 2010 (87.36% OA, a KC of 0.79) but showed diminished stability in later years. The SVM displayed middling performance, particularly excelling in the classification of urban areas (about 94%) but exhibiting reduced accuracy for forest regions. This analysis emphasises the efficacy of GEE and Python libraries in analysing large satellite imagery and the proficiency of DT and RF models in land use and land cover classification. The results can guide regional planning and land management policies, fostering sustainable development.
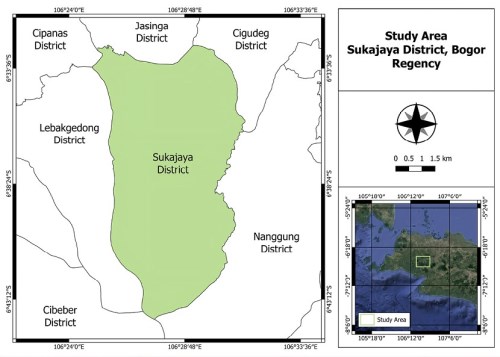
High-quality land cover data are essential for environmental policy, spatial planning, and ecosystem monitoring. However, pixel-based classification methods, while widely used due to their practicality, often suffer from salt-and-pepper noise, which undermines map reliability. This study aimed to integrate Random Forest (RF) classification and majority filtering to enhance the quality of land cover mapping in Sukajaya District, Bogor Regency. RF was applied to Sentinel-2 image data with varying numbers of trees (ntree) to determine the optimal model performance. Subsequently, majority filtering was applied to each classification result to reduce noise and improve spatial coherence. The evaluation employed multiple accuracy metrics, including User’s Accuracy (UA), Producer’s Accuracy (PA), F1-Score, Overall Accuracy (OA), and Kappa Coefficient (KC). Comprehensive accuracy increased with the ntree until reaching an optimal point. Beyond this point, additional ntree resulted in diminishing returns. Applying majority filtering as a post-processing procedure led to further improvements in classification accuracy. While majority filtering can reduce classification noise and improve the visual quality of land cover maps, it also carries the risk of removing small, accurately classified land cover patches. This consequence is rarely discussed in similar studies. These findings highlight the importance of integrating pixel-based machine learning classification with majority filtering in land cover classification workflows, while emphasising a trade-off that tends to favour visual accuracy over the preservation of spatial detail.

ISSN 2542-1565 (Online)


