



Contents
Scroll to:
https://doi.org/10.24057/2071-9388-2025-3669
Scroll to:
Renewable energy sources are critical choices for achieving long-term energy security while minimizing the effects of climate change. Wind energy in Egypt has received attention, however, wind power potential is dependent on climatic factors such as wind speed and temperature. Therefore, the wind power plan must rely on an in-depth understanding of wind resource sensibility to climate change to guarantee its sustainability, thereby supporting wind plan and climate change strategy. Using GIS analysis, the effect of climate change has been estimated on wind power density by 2065 under the climate change RCP 8.5 scenario. Furthermore, some criteria, such as elevation, slope, road networks, protectorates, archeological sites, touristic sites, and grids, have been used to identify regions that would be suitable for wind projects. The results revealed that wind energy potential is expected to be vulnerable to climate change, reflected in a 1% decrease in regions with high wind power density. Even after considering the effect of climate change, the Suez Gulf region would be the most suitable. Projects can also be expanded to other suitable locations where there are no projects yet, such as the Sinai Peninsula and the Red Sea coast.
Ghanem A., Abdrabo M., Hassaan M. Would climate change pose a challenge to meeting wind targets? A GIS-based approach to unravel impacts and identify suitable sites in Egypt. GEOGRAPHY, ENVIRONMENT, SUSTAINABILITY. 2025;18(3):6-18. https://doi.org/10.24057/2071-9388-2025-3669
Climate change is a serious challenge that will confront humanity in the coming years, which will have socio-economic and geopolitical consequences. Economic activities are a major driver behind the current warming trend, as greenhouse gas emissions (GHGs) have been steadily increasing since the mid-twentieth century, at an unprecedented rate over decades (Pachauri et al. 2014). One of the main challenges in addressing climate change is how to balance the growing energy demand with the need to reduce CO2 emissions. Renewable energy is essential to reaching climate goals because of its crucial role in reducing emissions and meeting rising electricity demand in a more sustainable way, as well as its advantageous strategic and economic benefits (Al-Riffai et al. 2015). In this regard, wind energy is regarded as one of the most successful renewables in the world, owing to its cost-competitiveness and technological maturity (IRENA 2023). Thus, wind energy supports the transition to a green economy, achieving sustainable development goals (SDGs), and international ambitions in terms of climate change mitigation. Climate change, on the other hand, would have an impact on the energy sector, including supply, demand, and infrastructure. Permanently rising global surface temperatures associated with unprecedentedly high levels of GHGs may considerably affect energy demand patterns (Clarke et al. 2022). Climate change is expected to cause spatial and temporal variability in wind resource, which can have a significant impact on extractable power output and production costs. Different parts of the world are likely to experience varying trends and magnitudes of change in wind power potential (Cronin et al. 2018; Fant et al. 2016; Ohba 2019; Pereira et al. 2013). Risks related to climate change, such as extreme weather, storms, hurricanes, temperature increases, and flooding, are anticipated to influence on the resilience of the power system and may harm the infrastructures of wind farms (Clarke et al. 2022). Climatic determinates of wind power potential include wind speed, air pressure, and temperature, hence changes in wind speed and temperature as a result of climate change impacts would have an influence on wind power output (El-Ahmar et al. 2017; Rao 2019).
In Egypt, renewable energy sources have experienced a noteworthy growth during the last decade. The total installed capacity was 6691 MW, which includes hydropower, onshore wind, solar PV, solar CSP, and biomass, accounting for 25.87 TWh of total electricity generated. This transition to renewable energy is anticipated to save $287.01 billion by 2050 due to decreased emissions (Abbas et al. 2021). Wind power represents one of the most promising sources of renewable energy. The installed wind power capacity has reached 2191 MW, contributing 3% of the country’s total electricity generation. With ambitious national strategies aiming to increase this share to 14% in the near future, Egypt is actively positioning itself as a regional leader in wind energy development. Key projects such as Gebel El-Zeit and Zaafrana have demonstrated considerable success, attracting international investment for large-scale wind power deployment. A clear and supportive governmental policy framework underpins its progress in wind power. The government has adopted a long-term Integrated Sustainable Energy Strategy (ISES) targeting 42% renewable energy by 2035, with wind playing a major role in this mix. Policy instruments such as feed-in tariffs, competitive bidding, and public-private partnerships have been crucial in mobilizing both domestic and foreign investment. In addition, streamlined licensing procedures and the availability of land in high-wind zones, such as the Gulf of Suez, have further accelerated project implementation (Ghanem & Elsobki 2024). Moreover, Egypt is fostering local manufacturing capabilities for wind energy components, including towers and related infrastructure. This is supported by competitive advantages such as low labor costs, favorable energy prices for industry, and access to raw materials (Salah et al. 2022). These factors enhance Egypt’s competitiveness in the global renewable energy market. Moreover, the development of wind power contributes to national goals of reducing greenhouse gas emissions, diversifying energy sources, and achieving long-term sustainability.
Egypt has a desert climate, with hot and dry summers and mild winters with little rainfall. It is predicted to experience negative climate change consequences as it becomes hotter and drier. Also, climate change may make climate extremes more frequent and severe that are related to renewable energy production in the future (Abbas et al. 2021; Smith et al. 2013). In warmer temperatures, wind power plants, for instance, which are usually designed for conditions of around 250C, may become less effective, reducing generation efficiency. Egyptian electricity systems may be better able to deal with the negative effects of rising temperatures and heat waves if adaptation measures are taken, such as incorporating a climate change impact assessment into energy planning with the aim of identifying locations for the construction of future power plant1.
Most published research on climate change’s impact has overlooked several critical sectors, including the energy sector, despite its vital importance (Hassaan 2018). Naturally, numerous research studies were carried out to assess the wind resource at multiple sites ( Agwa et al. 2023; Ahmed 2010; Ahmed 2012; Ahmed 2018a; Ahmed 2018b; Hamouda 2012; Lashin & Shata 2012), as well as conducted multi-criteria suitability analysis for installing offshore wind farms (Mahdy & Bahaj 2018). However, these studies presented assessments of wind power potential under current wind speeds, without considering climate change impacts and climate change scenarios. Hence, this study aims to assess the impact of climate change on the potential for wind power generation and determine the most suitable area to install projects by 2065 under the climate change RCP 8.5 scenario. Such research work can support the decision-making and policymaking process in terms of planning wind energy projects.
Geographical Information System (GIS) can be used for a wide range of fields as they can assist in organizing, querying, storing, and displaying spatial and non-spatial data. Thus, it can support knowledgeable decisions and policymaking. Power generation from renewable resources depends on numerous spatial determinants, such as wind speed, solar radiation, biomass availability, locations, grids, energy demand …etc. In this regard, several studies have been undertaken in different regions of the world, applying GIS analysis tools to analyze wind power potential (Eshete & Abate 2022; Razeghi et al. 2023; Samak 2023) or perform multi-criteria suitability analysis for siting wind power farms in either inland regions (Atici et al. 2015; Aydin et al. 2010; Elmahmoudi et al. 2020; Pakere et al. 2022), onshore regions (Effat 2014; Sliz-Szkliniarz et al. 2019), or offshore regions (Saleous et al. 2016; Tercan et al. 2020). Meanwhile, some previous research work used GIS to assess the economic impact of the turbines, in the construction and operation phases (Pakere et al. 2022).
The Arab Republic of Egypt is located in the northeastern part of Africa, with the Sinai Peninsula forming a land bridge into western Asia. Egypt is bordered by the Mediterranean Sea to the north, the Red Sea to the east, Libya to the west, Sudan to the south, and the Gaza Strip to the northeast. Geographically, it lies between latitudes 22° and 31° North and longitudes 25° and 35° East. The Nile River flows through the country from south to north, dividing it into distinct eastern and western regions. This strategic location encompasses a variety of climatic and topographic zones relevant to wind energy assessment under different climate change scenarios.
In this study, a four-phase methodology was implemented to assess the potential impacts of the climate change RCP 8.5 scenario on wind power in Egypt and identify suitable sites for future development using a GIS-based approach. The phases include (1) data collection and manipulation, (2) assessing current and projected wind power potential, (3) spatial-temporal profiling of changes in wind power, and (4) multi-criteria suitability analysis. Fig. 1 presents an overview of the workflow, and the following sections describe each phase in detail.

Fig. 1. Proposed methodology of assessment wind power under climate change
Data on wind energy determinants were obtained from the Coordinated Regional Climate Downscaling Experiment (CORDEX)2 in February 2022 for the Middle East and North Africa region. Climate models are forecasts of the future state of the climate system and are used to understand how the climate will change (Abbas et al., 2021). The CORDEX provides downscaled climate change scenarios using Regional Climate Models (RCMs) alongside the Intergovernmental Panel on Climate Change (IPCC) Fifth Assessment Report for a variety of global domains. RCMs usually provide climatic data at high spatial and temporal resolution. The data were collected monthly, and had a spatial resolution of 24 km, which was achieved using the RCA4 model (Hassaan et al. 2024; Nabipour et al. 2020). The gathered data included historical data on wind speed, air temperature, and air pressure at 10 m from 1970 to 2005, which represents the historical period, with 1988 being the mid-period year for this reference period. In addition, projected data on the same variables were acquired for the climate change RCP 8.5 scenario for 2050-2080, which represents 2065. The IPCC developed four Representative Concentration Pathways (RCPs) labeled based on possible radiative forcing in W/m² by the end of the twenty-first century, relative to the 1986-2005 period. Climate change scenarios represent how anthropogenic GHG concentrations may evolve in the future. RCP8.5 is considered the worst-case scenario, which has a radiative forcing of 8.5 W/m², high-level emissions of more than 1000 CO2-eq, and a 3.7 °C increase in mean temperature by 2100, implying no further climate efforts (Pachauri et al. 2014). The RCP 8.5 scenario is selected, which, despite being the highest emission pathway, provides valuable insights into potential extreme impacts on wind resources. Given Egypt’s long-term energy planning and the critical need to assess site robustness under high-risk climate conditions, RCP 8.5 is a useful analytical boundary to explore the upper limits of climatic impact.
Given the absence of direct long-term observational wind speed data across Egypt for the historical period, this study relied on the validation efforts of previous research that assessed the accuracy and performance of CORDEX-RCM outputs (Hassaan et al. 2024; Nabipour et al. 2020). Therefore, no additional bias correction or validation was conducted in this study, and the dataset was used as a reliable source to analyze climate-induced changes in wind power potential.
Furthermore, data on criteria for siting wind power projects such as elevation, roads, high voltage grids, and land use were downloaded from DIVA-GIS3, which provides geographical open access data for the world’s countries. Moreover, data on sensitive land uses such as archeological sites were acquired from (Nagi & Nagi 2002). The collected data were integrated into a geodatabase that included various vector and raster feature classes (Table 1). Using ArcGIS Software version 10.8, the collected data were masked and manipulated to produce raster layers representing monthly and annual averages of wind speed, air pressure, and air temperature over historical and future periods.
To assess whether the observed changes in monthly mean wind speeds between the reference period (1970–2005) and the future period (2050–2080) under the RCP8.5 scenario are statistically significant, a paired sample T-test was conducted. The test compared the same months between the two periods, based on monthly mean values derived from wind speed data that had been spatially processed. The analysis was performed using SPSS software version 26.
Table 1. Geodatabase Structure
Feature Class | Type | Description |
Current_Wind_Speed | Raster | Current wind speed for the reference period (1970-2005) |
Current_Air_Pressure | Raster | Current air pressure for the reference period (1970-2005) |
Current_Air_Temperature | Raster | Current air temperature for the reference period (1970-2005) |
Projected_Wind_Speed | Raster | Projected wind speed for the period (2050-2080) under RCP 8.5 scenario |
Projected_Air_Pressure | Raster | Projected air pressure for the period (2050-2080) under RCP 8.5 scenario |
Projected_Air_Temperature | Raster | Projected air temperature for the period (2050-2080) under RCP 8.5 scenario |
Elevation | Raster | Elevation above mean sea level |
Slope | Raster | Slope of land |
Roads | Vector | Road network |
Sensitive land uses | Vector | Protectorates, archaeological sites, and touristic destinations |
Grid | Vector | High voltage grids |
To find wind power potential under current conditions as well as projected climatic conditions in the future, the Eq.1 was employed:
 (1)
(1)
Where: Pw – Power in wind, ρ – Air density, ν – Wind Speed (Sawadogo et al. 2021)
The air density was calculated according to the Eq. 2:
 (2)
(2)
Where: ρ – Air density, R – The gas constant = 287 J/kg-K for air, P – Air pressure, T – Air temperature in kelvin (Tong 2010)
The estimated wind power potential of the reference period (1970–2005) was compared to the estimated future wind power potentials under the RCP8.5 scenario by the year 2065 (2050–2080). It is worth noting that wind turbulence needs to be considered when deciding to locate wind farms, as wind speed fluctuations may cause fluctuations in power output and also damage the turbine. Therefore, probability density functions (PDFs) were produced on an annual basis to determine the variance in wind speed in each area.
In general, wind power potential is critical but not sufficient for deciding where to locate wind power projects due to the existence of other factors that may raise the cost of the project or restrictions that prevent its construction. This emphasizes the importance of multi-criteria suitability analysis in determining the most suitable locations for wind farms, which are dependent on a variety of factors. Such an analysis involves the use of a set of criteria, including local topography, economic viability, and environmental aspects. Local topography criteria assess appropriateness for wind power farm construction and operation. For example, suitable sites for a wind farm should have a gentle slope to avoid difficulties in the installation and operation of wind turbines. In this respect, it was suggested that the slope of wind farm sites should not exceed 25 or more favorably 15. In addition, wind farms are usually installed at relatively high altitudes to generate more power. Nevertheless, installation at higher than 2000 m is not preferred because the air density reduces at these levels, resulting in low turbine efficiency. Also, moving the turbine components to extremely high regions is challenging (Feng 2021; Rediske et al. 2021). Economic viability entails identifying sites with the largest wind power potential as well as more accessible sites, allowing for easier and lower-cost wind farm construction and maintenance. Also, installing wind farms as close to the transmission power grid as possible to minimize power loss and grid connection costs. Wind farm construction and operation are usually associated with environmental impacts, for instance, turbine noise that can influence on both human health and animal life. Wind farms should thus be located away from sensitive land uses such as protectorates, archaeological sites, and tourism destinations.
Table 2. List of criteria and their relevant indicators
Criteria | Indicator | Unit | Relationship |
Local topography | Slope | Degree | Negative |
Elevation | Meter | Curvilinear | |
Cost-effectiveness | Wind power potential | W/m² | Positive |
Distance to roads network | Meter | Negative | |
Environmental impact | Distance to Grid | Meter | Negative |
Distance to sensitive land uses | Meter | Positive |
To represent the identified criteria and their relevant indicators, the slope was derived from the elevation digital model. Also, using Spatial Analyst Tools (Euclidean Distance Tool), several raster surfaces were created, representing the distance to road networks, power grids, and sensitive areas. As a result, six raster feature classes were produced, representing various indicators of the criteria considered. Thereafter, each of these raster surfaces was normalized through one of the Eqs. 3-4:
 (3)
(3)
 (4)
(4)
Where: Nx – Normalized pixel value, X – Pixel value,
Xmin – Minimum pixel value in the raster surface,
Xmax – Maximum pixel value in the same raster surface (Hassaan et al. 2021)
It should be noted that the raster surfaces of those indicators that are positively correlated with suitability were normalized according to formula (3), while the raster surfaces of those indicators that are negatively correlated with suitability were normalized according to formula (4). Meanwhile, the raster surface of elevation, whose curvilinear relationship with suitability, was normalized according to the Eq. 5:
 (5)
(5)
Where: Nx – Normalized pixel value, X – Pixel value,
Xmin – Minimum pixel value in the raster surface,
Xmax – Maximum pixel value in the same raster surface
These different formulae of normalization ensured consistent normalized raster surfaces, with pixel values ranging between 0 and 1 representing the least and highest levels of suitability, respectively. This is followed by calculating the composite suitability index through aggregating various primary indicators, assuming equal weight of all indicators according to the Eq. 6:
 (6)
(6)
Where: S – Suitability index, Ni – Normalized pixel value of indicator i, Wi – Weight of indicator Ni
As a result, a new raster surface was generated, representing different levels of suitability according to the considered criteria and their indicators. The resulting raster surface has pixel values ranging between 0 for the least suitable locations and 1 for the most suitable locations.
Annual mean wind speed in the reference period (1970–2005) ranged from 2.76 to 5.73 m/s at 10 m, whereas under the RCP8.5 scenario, annual mean wind speed would range from 2.74 to 5.91 m/s at 10 m (Fig. 2). This means that the annual mean wind speed is expected to experience a marginal increase. It should be noted in this respect that the annual mean wind speed does not reflect temporal and spatial variations in different locations within the country. Therefore, there would be a need to look more in-depth at temporal and spatial variations in different parts.

Fig. 2. Annual wind speed by 2065 under RCP 8.5 scenario compared to the reference period (1970-2005)
Temporally, the monthly mean wind speed in the reference period (1970–2005) ranged between 3.07 and 4.20 m/s at 10 m. Winds exceeding 4 m/s are prevalent in the summer and spring. Higher wind speeds indicate greater potential for electricity generation. It is worth noting that wind speeds are high during the summer, which is Egypt’s peak electricity demand season4. Monthly mean wind speed is expected to range between 3.20 and 4.22 m/s under the climate change scenario RC8.5. Compared to the reference period, wind speed on average would increase by 10% in September, while wind speed in February is expected to be unchanged. Some months would, meanwhile, experience some decline in wind speed, with August experiencing the largest decline, exceeding 4% (Fig. 3).
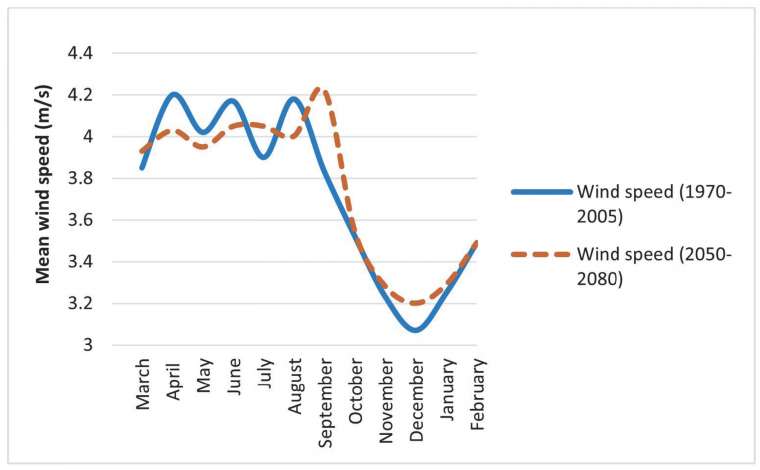
Fig. 3. Predicted change in monthly mean wind speed
A paired sample T-test was applied to the corresponding monthly averages between the two periods, and the results showed that the difference was not statistically significant at the 0.05 level (p > 0.05). This minor variation can be attributed to natural variability and may also fall within the margin of error inherent in the climate model used.
Spatially, wind speed varies from one area to another. Different sites have been chosen to evaluate wind potential. In the Gulf of Suez region, there are already some wind power projects, and more will be added in the future. Egypt intends to grow in the future, including the Red Sea and the West Nile areas. Furthermore, other sites, such as Sinia, Aswan, Sharq El Owainat, the Mediterranean Coast, and Kharga Oasis, have been selected to investigate the possibility of establishing future wind farms for local community development if they are determined to be suitable (Fig. 4).
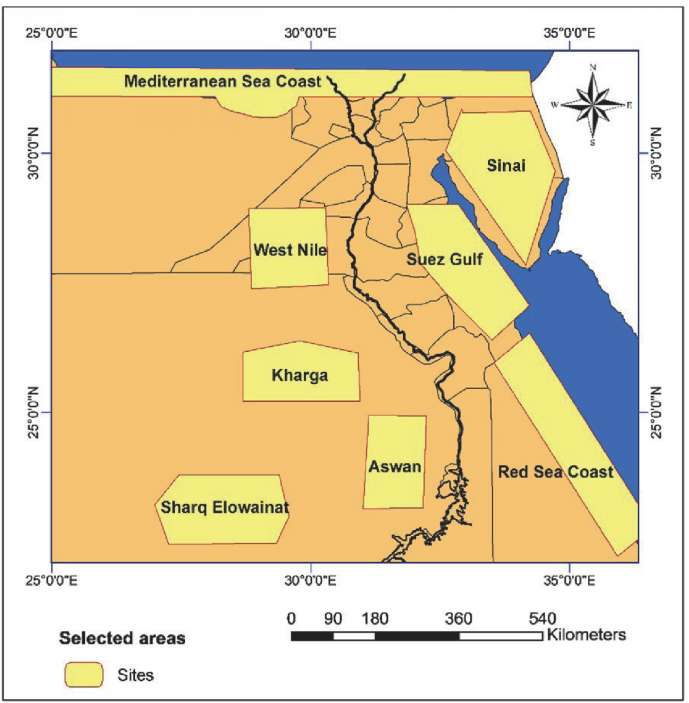
Fig. 4. Geographic location map of the eight selected sites in Egypt
Climate change is likely to cause different patterns in wind speed (Fig. 5). The Suez Gulf, Red Sea Coast, Sharq El-Owainat, and Aswan areas are expected to have significant increases in annual mean wind speeds ranging between 2.8 -1.1%. Kharga Oasis would experience the largest increase in wind speed with 7.3% compared to the reference period. The West Nile and the Sinai Peninsula areas would be unchanged, while the Mediterranean coast would experience a 2% decrease. The expected decline in wind speed alongside the Mediterranean coast was attributed to a decrease in the temperature difference between the polar regions and the tropics, resulting in a decrease in average wind speeds in the middle latitudes (Ebinger & Vergara 2011).
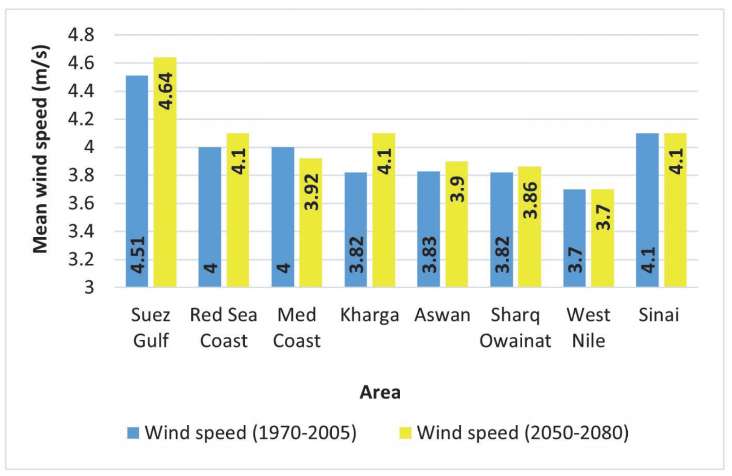
Fig. 5. Changes in annual mean wind speed at the selected areas
In order to understand patterns of change in wind speed in different sites under the climate change scenario RCP8.5 compared to the reference period, the wind speed probability density function (PDFs) was estimated. It is obvious that PDFs vary noticeably among different sites, so it is crucial to choose a location with favorable wind conditions for wind power generation (Fig. 6). The findings indicate that (a) Suez Gulf is predicted to be the windiest site, with increased variance with high wind speed values. (b) The annual mean wind speed of the Red Sea Coast is expected to rise, which would increase the likelihood of higher wind speeds at low values and lower wind speeds at high values. Furthermore, no significant variations are expected in this area. (c) In the West Nile region, the variance in wind speed would increase without a rise in its annual mean. This means a lower level of reliability of wind power in this region. (d) In the Sharq El-Qwinat region, the annual mean wind speed is expected to experience a marginal increase with an unchanged variance in wind speed, indicating that there is a probability increase in wind speed toward high values. (e) The annual mean of wind speed in Aswan would increase with a low variance, indicating that there is an increased probability of higher wind speed values. (f) In Kharga, the annual mean wind speed is expected to increase, with an increased probability of higher wind speed values and also low variance that indicates less fluctuation in wind speed. (g) Alongside the Mediterranean Sea coast, annual mean wind speed would decrease with unchanged variance, indicating that there is a decreased probability of higher wind speed values. (h) The variance in wind speed in Sinai would increase slightly without a rise in its annual mean. This generally means unchanged under climate change conditions.
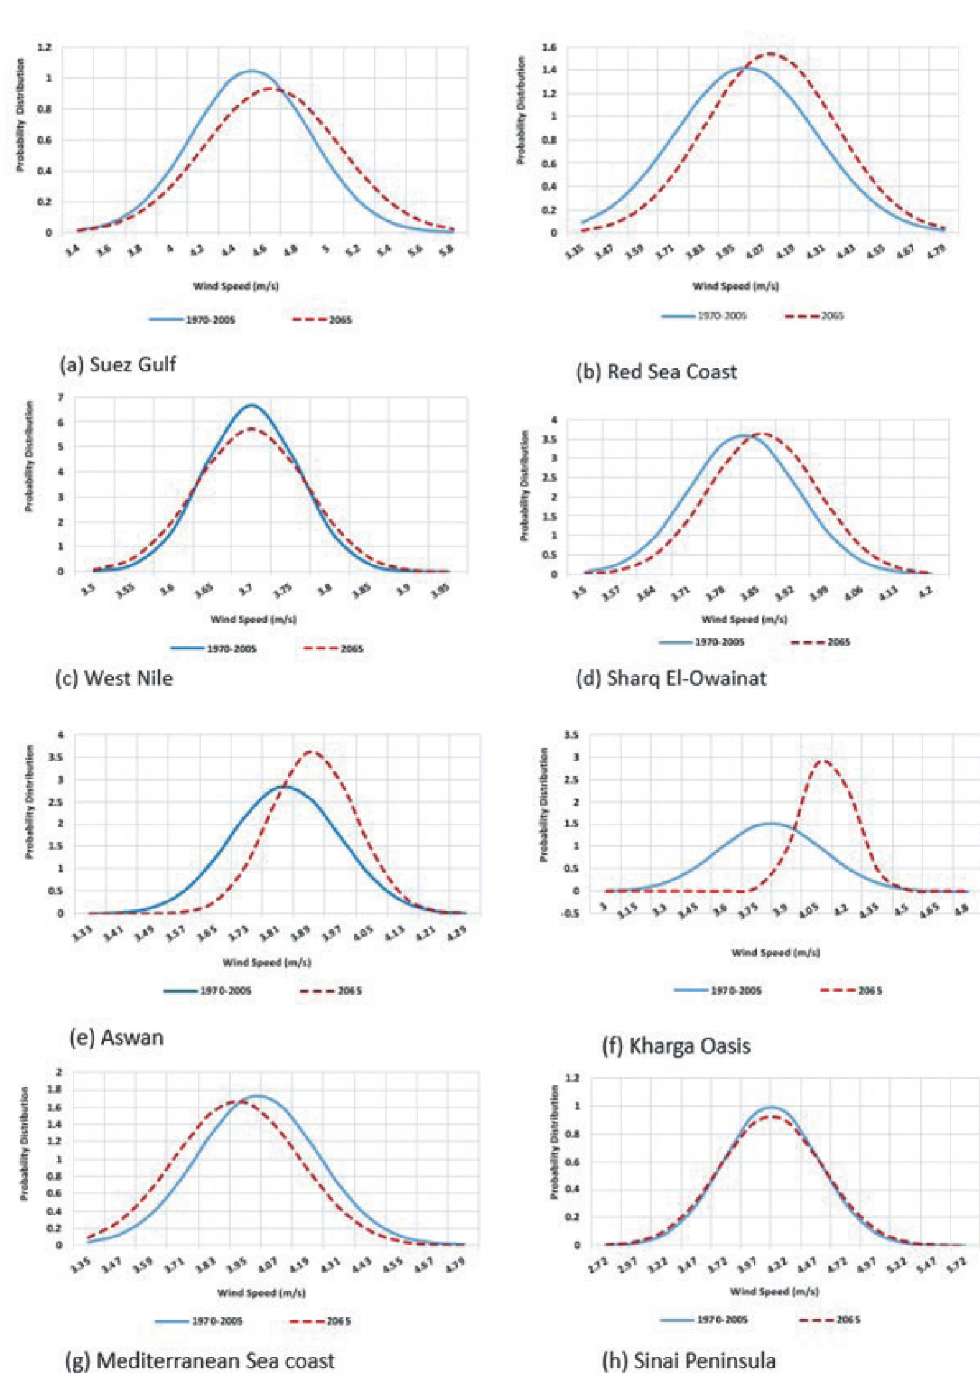
Fig. 6. Probability distribution function (PDFs) of wind speed in the selected areas
Based on temperature and air pressure for the reference period (1970–2005), the annual mean air density was found to be 1.00 – 1.22 kg/m³. Due to the inverse relationship between temperature and air density, an increase in temperature causes a decrease in air density. Under the RCP8.5 scenario, the annual average temperature is expected to increase by about 3 K on average, while air pressure is expected to experience an approximate decline compared to current levels of air pressure on average. Accordingly, the range of the annual average air density is expected to be 1.21–0.99 kg/m³, decreasing by about 3% (Fig. 7).
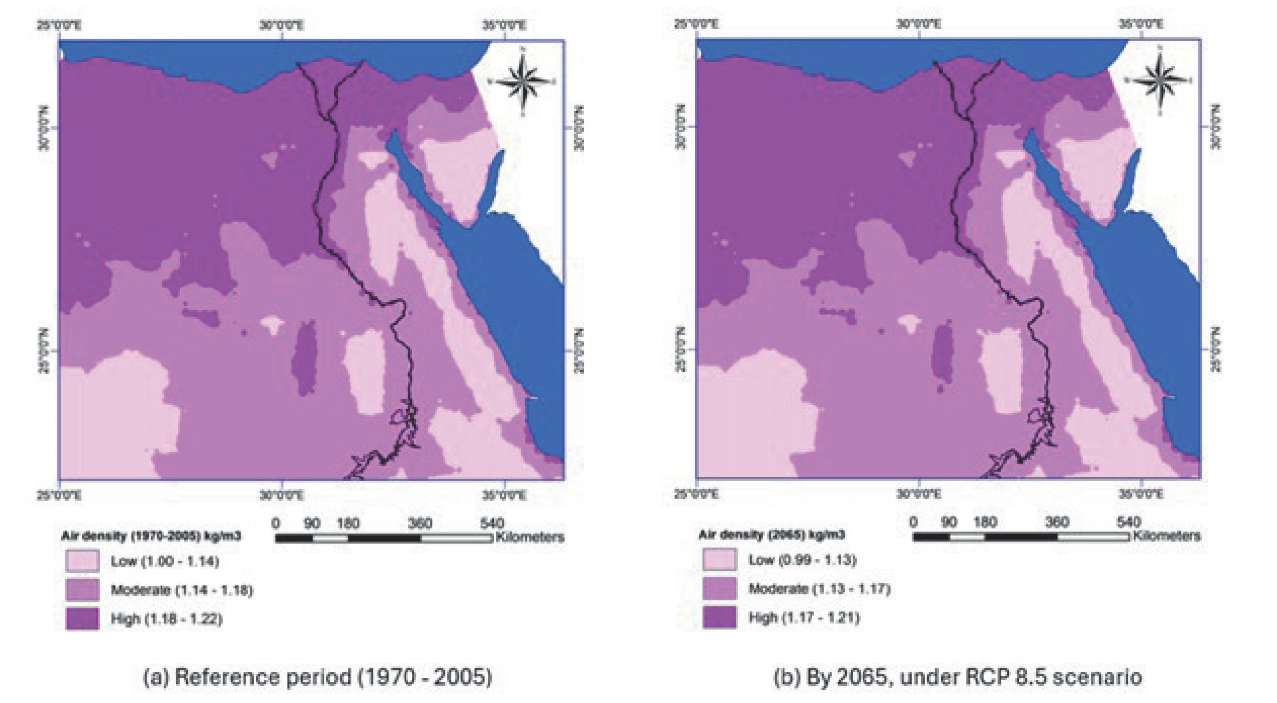
Fig. 7. Annual air density by 2065 under RCP 8.5 scenario compared to the reference period (1970-2005)
Annual wind power density ranged between 12.34 and 112.70 W/m² during the reference period (1970–2005), whereas it is anticipated to be 11.99 to 122.33 W/m² (Fig. 8). This, consequently, shows that climate change would have a slight negative impact on annual mean wind power density, and this decline is mainly due to a reduction in expected air density.
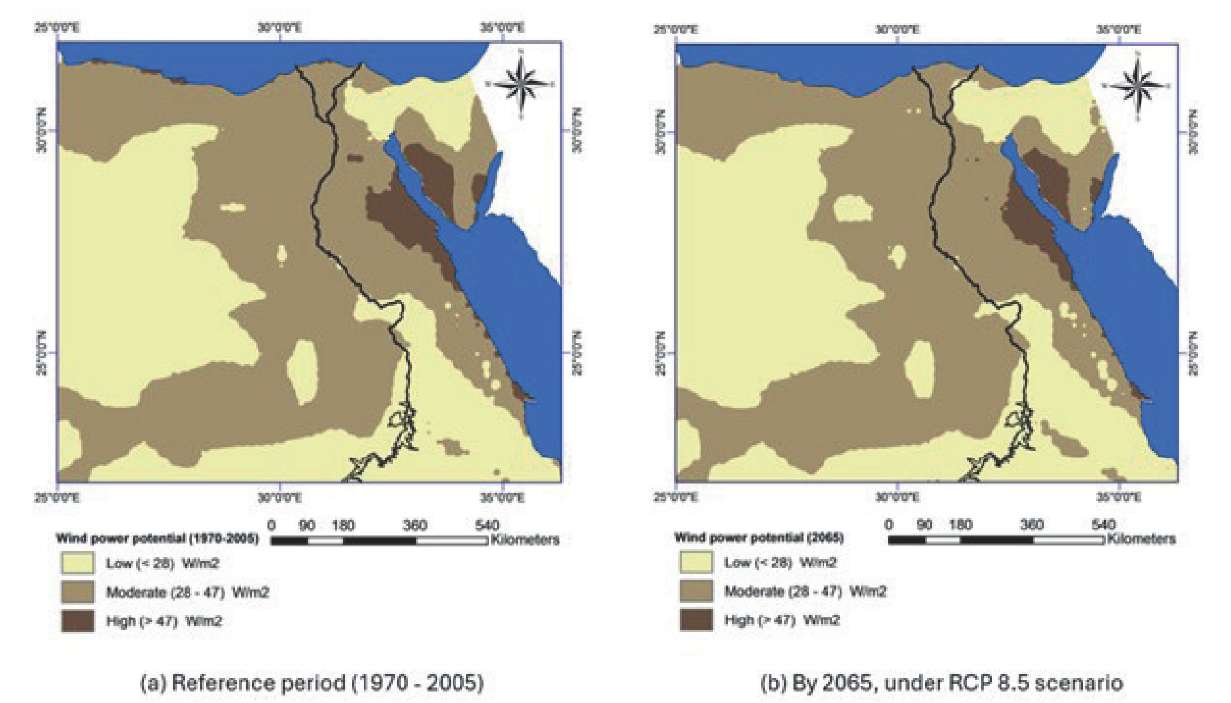
Fig. 8. Annual wind power density by 2065 under RCP 8.5 scenario compared to the reference period (1970-2005)
Wind power potential was classified into three categories based on wind speed in the reference period and under the RCP8.5 climate change scenario (Tables 3 and 4). Land areas with high wind power potential are projected to decrease by 1% because of climate change impacts.
Table 3. Classification of wind power density (1970-2005) at 10m
Class | Wind speed (m/s) | Wind power density (W/m²) | Resource potential | Area (%) |
1 | 2.8 - 3.5 | < 28 | Low | 44 |
2 | 3.5 - 4.1 | 28 - 47 | Moderate | 52 |
3 | 4.1 - 5.7 | > 47 | High | 4 |
Table 4. Classification of wind power density under RCP 8.5 scenario at 10m
Class | Wind speed (m/s) | Wind power density (W/m²) | Resource potential | Area (%) |
1 | 2.7 - 3.6 | < 28 | Low | 45 |
2 | 3.6 - 4.1 | 28 - 47 | Moderate | 52 |
3 | 4.1 - 5.9 | > 47 | High | 3 |
Annual wind power density in different locations of Egypt varied notably during the reference period, ranging between 29.35 and 53.61 W/m², and is anticipated to range between 29.95 and 55.40 W/m² under climate change (Fig. 9). Except for the Mediterranean Sea coast, all of the selected areas are predicted to increase their annual average wind power density. The Suez Gulf, which has significant potential, is anticipated to increase by 3%. This is consistent with (Gebaly et al. 2023) finding that wind power density in the Gulf of Suez would experience an increase under climate change scenarios. Meanwhile, sites with moderate wind power potential, such as Kharga Oasis, are expected to increase by 18%.
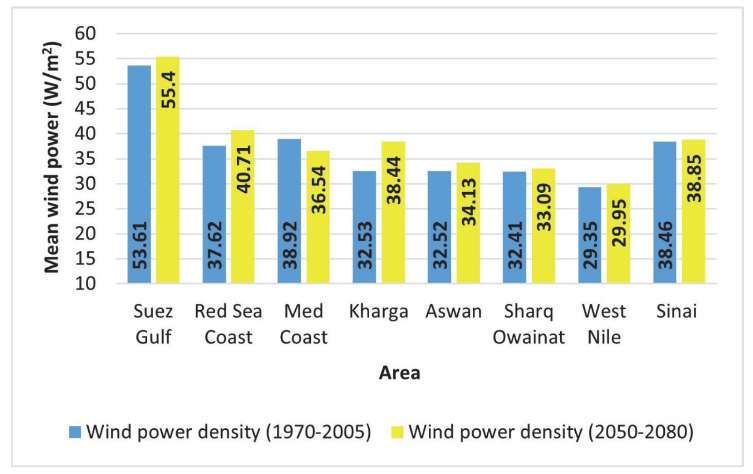
Fig. 9. Predicted change in wind power density in 2065
Limited research publications (Gebaly et al. 2023; Hassaan et al. 2024) examined changes in wind resources under climate change scenarios that revealed multiple expected trends in wind power density over Egypt. This research article’s findings differed from those of (Gebaly et al. 2023), who found that wind power potential based on the worst scenario (SSP5-8.5) would rise between 2041 and 2100.
This research paper suggested an approach to conducting a suitability analysis to determine the most suitable locations for wind power projects in light of climate change, which aspect has not been discussed in previous studies at all (Gebaly et al. 2023; Hassaan et al. 2024). Indicators revealed various levels of suitability (Fig. 10); for instance, based on slope and the distance to sensitive areas, western parts are more suitable than eastern parts. Meanwhile, the eastern parts have a higher level of suitability based on elevation and distance to the roads. This emphasizes the importance of a composite index, which combines several indicators into a single numerical value that represents the overall compatibility of different parts.
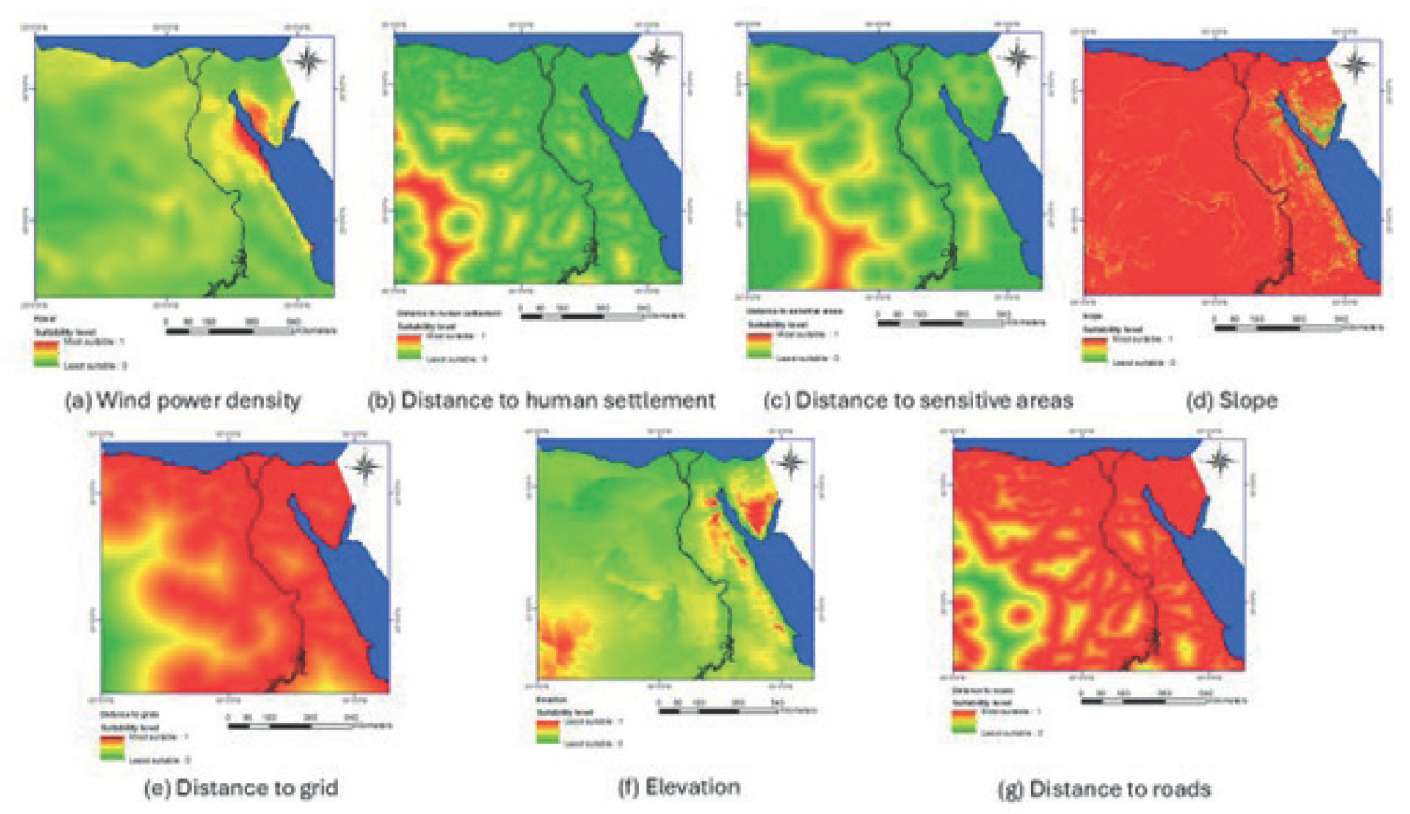
Fig. 10. Normalized raster surfaces of the selected indicators
Fig. 11 depicts the composite suitability index that indicates the most suitable regions are predicted to be in the Suez Gulf, a part of Sinai, and southern Egypt, which together encompass around 8.8% of Egypt’s entire landmass. In general, depending on the criteria chosen, it is possible to argue that up to 75% of Egypt’s land would be suitable for wind power installation in the future under the RCP8.5 climate change scenario.

Fig. 11. Suitable sites for installing wind power projects
Expected minimization in the landmass of the most suitable sites, especially in the Gulf of Suez region (Table 5), where wind power projects are highly concentrated, may obstruct the growth of additional wind projects there and necessitate expansion in other sites. There are no plans for installing wind power projects in the Sinai Peninsula, the Red Sea Coast, or Kharga Oasis, for instance, but these areas may be more suitable under climate change, especially since technological progress ensures that integrating remote locations is no longer a barrier to Egypt’s renewables development (Elgeziry et al. 2019). There could be a considerable socio-economic improvement for the local community if a wind farm proposal is made there. Furthermore, it presents a chance to export energy production to foreign nations. The West Nile region is one of the planned sites for wind farms with towers of up to 120 m for developing this area, which is expected to be suitable for wind project installation under climate change based on the selected criteria. Nevertheless, in general, it is preferable to expand to another much more suitable site with great potential for wind power. In addition, this area would experience significant fluctuations in wind speed, making it unsuitable for the installation of a wind farm since turbulence reduces wind turbine performance.
Table 5. Suitability level for future utilization of wind power under RCP8.5 climate change scenario
Suitability level | Reference Period (1970-2005) | Under RCP8.5 scenario (2050-2080) | ||
Area (km²) | (%) | Area (km²) | (%) | |
Most suitable areas | 95,167.39 | 9.50 | 88,837.18 | 8.85 |
More suitable areas | 461,043.49 | 45.94 | 450,372.7 | 45.15 |
Moderately Suitable areas | 288,279.32 | 28.72 | 298,773.12 | 29.95 |
Less suitable areas | 155,858.11 | 15.54 | 156,858.94 | 15.72 |
Least suitable areas | 2,363.28 | 0.23 | 2,458.71 | 0.24 |
Climate change has become an issue of concern, with a wide range of impacts already observed in countries all over the world. The objective of this research article is to assess climate change impacts on wind power potential utilizing climatic factors such as wind speed, air pressure, and temperature from 1970 to 2005, as well as expected values under the climate change RCP 8.5 scenario (2050-2080). In addition, some criteria were employed to determine the most suitable regions for wind farm installations, including wind power density, elevation above mean sea level, slope of land, road networks, protectorates, archeological sites, touristic sites, and power grids. Spatial analysis was carried out using GIS, and the results were presented in maps, tables, and figures.
Although the average wind speed did not exhibit a statistically significant change between the reference and future periods under the RCP8.5 climate change scenario, the wind power density demonstrated more spatial and quantitative variability. Specifically, the annual maximum wind power density increased from 112.70 W/m² to 122.33 W/m², while the minimum slightly decreased from 12.34 W/m² to 11.99 W/m². However, the overall average wind power density across Egypt declined. This apparent inconsistency is due to the nonlinear relationship between wind speed and wind power density, where even small increases in wind speed at certain locations can produce relatively large increases in power output. At the same time, this decline is mainly due to a decrease in the predicted air density that is greater than the rise in the expected wind speed under the future climate scenario (RCP8.5). This study demonstrates that climate change would have a slight adverse impact on wind power potential. Thus, it may not be able to produce more wind power in the future than it already does in current climate conditions.
Meeting increased power demand in the future can be accomplished by installing more wind farms. The findings revealed that wind power potential in the different sites would not change greatly under climate change, with different patterns in each area, however, the Gulf of Suez, Red Sea Coast, Sinai, and Kharga would have high annual mean wind density. Suitability analysis revealed that different parts have varied levels of suitability for future utilization of wind power. In this respect, the Suez Gulf region is expected to be the most suitable region, which is consistent with the state’s plans for wind projects in this region. It can be expanded to other suitable areas, such as the Red Sea Coast and Sinai, for example, to establish more projects to reach the desired percentage of electricity from wind.
In developing a strategy for wind energy utilization, it is essential to take into account not only the current situation but also predicted conditions under climate change and more viable measures.
It is important to note that the observed changes in wind speed and power density may fall within the typical range of modeling uncertainty. Therefore, the conclusions and recommendations are not only based on these numerical differences, but also on the absence of any substantial decline in wind resource potential, as well as the strategic importance of energy diversification.
Maximum utilization of wind power potential in Egypt under climate change requires:
This study provides insights into the spatial and temporal variability of wind power potential under projected climate conditions. While the findings lead to a broader understanding of future wind energy resources, several limitations have been identified that may influence the interpretation of the results. Recognizing these limitations is essential for guiding more targeted research in the future. First, the analysis relied on a single regional climate model (RCM) under a single climate change scenario (RCP8.5), which may not fully capture the range of possible climate futures. Therefore, multiple RCMs and climate scenarios such as RCP4.5 or Shared Socioeconomic Pathways (SSPs) should be incorporated in future analyses to improve the robustness and generalizability of the results. Second, the land suitability assessment was limited to proximity constraints such as roads, power grids, protected areas, archaeological sites, and touristic destinations. Certain land use categories were not fully integrated, such as military zones, urban expansion areas, high-value agricultural lands, and airport zones. It is recommended that future studies incorporate these additional constraints to enhance the practical feasibility of the selected sites. Third, all suitability criteria were assigned equal weights, which may not reflect the importance of each criterion. Future studies could apply multi-criteria decision-making techniques, such as the Analytic Hierarchy Process or fuzzy logic, to assign relative weights. Fourth, the reference period (1970–2005) may not fully represent current climatic conditions, particularly given recent trends in climate variability, and the collected data are at a height of 10 meters. It is recommended to use more recent reference periods, such as the 2000–2020 period, higher temporal resolution data, and extrapolate wind speeds to turbine hub heights, such as 50–100 meters, to enhance practical relevance. Fifth, wind speed modeling involves a degree of uncertainty, especially when using data from only one regional climate model and low spatial resolution. These uncertainties can affect how accurately wind power density is estimated. To improve future results, it is recommended to use multiple climate models and apply downscaling techniques to reduce uncertainty and increase confidence in the projections. Finally, although this study evaluated wind power density across Egypt and performed an analysis at eight selected sites using ArcGIS tools, these locations may not fully capture the local variability of wind resources. Future research could benefit from focusing on only a single location using the same methodology with higher-resolution spatial and climate data, possibly combined with ground-based measurements to enhance the local accuracy and provide deeper insights into wind power potential.
1. IEA. (2023). Climate Resilience for Energy Transition in Egypt. International Energy Agency (IEA), Paris. https://www.iea.org/countries/egypt. [ Accessed 16 August 2023]
2. CORDEX. (2022). Coordinated Regional Climate Downscaling Experiment. https://esgdn1.nsc.liu.se/search/cordex/. [ 1 February 2022].
3. DIVA-GIS. (2022). DIVA-GIS. Free Spatial Data by Country. Available: https://www.diva-gis.org/gdata. [ Accessed 16 November 2022].
4. CEIC. (2024). Egypt Electricity Consumption. Ceicdata. https://www.ceicdata.com/en/egypt/electricity-consumption/electricity-consumption. [ Accessed 11 April 2024].
1. Abbas W., Hassan A., & Ismael H. (2021). Climate Change Impact On Renewable Energy Resources In The Arab World Based On Jacobson’s Roadmap Of Renewable Wind, Water, And Sunlight (Wws) 2050. Geography, Environment, Sustainability, 14(2), 92–104.
2. Ahmed A. S. (2010). Wind energy as a potential generation source at Ras Benas, Egypt. Renewable and Sustainable Energy Reviews, 14(8), 2167–2173.
3. Ahmed A. S. (2012). Potential wind power generation in South Egypt. Renewable and Sustainable Energy Reviews, 16(3), 1528–1536.
4. Ahmed A. S. (2018a). Wind energy characteristics and wind park installation in Shark El-Ouinat, Egypt. Renewable and Sustainable Energy Reviews, 82, 734–742.
5. Ahmed A. S. (2018b). Wind resource assessment and economics of electric generation at four locations in Sinai Peninsula, Egypt. Journal of Cleaner Production, 183, 1170–1183.
6. Al-Riffai P., Blohmke J., Breisinger C., & Wiebelt M. (2015). Harnessing the sun and wind for economic development? An economy-wide assessment for Egypt. Sustainability, 7(6), 7714–7740.
7. Atici K. B., Simsek A. B., Ulucan A., & Tosun M. U. (2015). A GIS-based Multiple Criteria Decision Analysis approach for wind power plant site selection. Utilities Policy, 37, 86–96.
8. Aydin N. Y., Kentel E., & Duzgun S. (2010). GIS-based environmental assessment of wind energy systems for spatial planning: A case study from Western Turkey. Renewable and Sustainable Energy Reviews, 14(1), 364–373.
9. Clarke L., Wei Y.-M., de la Vega Navarro, A., Garg A., Hahmann A. N., Khennas S., Azevedo I. M. L., Löschel A., Singh A. K., & Steg, L. (2022). Energy systems. In Climate Change 2022: Mitigation of Climate Change. Working Group III Contribution to the IPCC Sixth Assessment Report (pp. 69–77). Cambridge University Press. https://doi.org/10.1017/9781009157926.008
10. Cronin J., Anandarajah G., & Dessens O. (2018). Climate change impacts on the energy system: a review of trends and gaps. Climatic Change, 151, 79–93. https://doi.org/10.1007/s10584-018-2265-4
11. Ebinger J., & Vergara W. (2011). Climate impacts on energy systems: key issues for energy sector adaptation. The World Bank. https://doi.org/10.1596/978-0-8213-8697-2
12. Effat H. A. (2014). Spatial modeling of optimum zones for wind farms using remote sensing and geographic information system, application in the Red Sea, Egypt. Journal of Geographic Information System, 6(4), 358–374.
13. El-Ahmar M. H., El-Sayed A.-H. M., & Hemeida A. M. (2017). Evaluation of factors affecting wind turbine output power. 2017 Nineteenth International Middle East Power Systems Conference (MEPCON), 1471–1476.
14. Elgeziry M. Z., Kawady T. A., Elkalashy N. I., Elsadd M. A., Izzularab M. A., El-Khayat M. M., & Taalab A.-M. I. (2019). Integration enhancement of grid-connected wind farms using HVDC systems: Egyptian network case study. 2019 21st International Middle East Power Systems Conference (MEPCON), 502–508.
15. Elmahmoudi F., El kheir Abra O., Raihani A., Serrar O., & Bahatti L. (2020). GIS based Fuzzy Analytic Hierarchy Process for wind energy sites selection in Tarfaya Morocco. 2020 IEEE International Conference of Moroccan Geomatics (Morgeo), 1–5.
16. Eshete S., & Abate T. (2022). Wind energy potential assessment in Nifas Mewucha, Amhara Province, Ethiopia. Wind Engineering, 46(1), 23–33.
17. Fant C., Schlosser C. A., & Strzepek K. (2016). The impact of climate change on wind and solar resources in southern Africa. Applied Energy, 161, 556–564.
18. Feng J. (2021). Wind farm site selection from the perspective of sustainability: A novel satisfaction degree‐based fuzzy axiomatic design approach. International Journal of Energy Research, 45(1), 1097–1127.
19. Gebaly A. M., Nashwan M. S., Khadr W. M. H., & Shahid S. (2023). Future changes in wind energy resources in Egypt under Paris climate agreements’ goals. Regional Environmental Change, 23(2), 1–14.
20. Ghanem A., & Elsobki M. S. (2024). Wind Power Development in Egypt: Historical Overview, Current Status, and Perspectives. Athens Journal of Mediterranean Studies (AJMS), 11(1), 21–46. https://doi.org/10.30958/ajms.11-1-2
21. Hamouda Y. A. (2012). Wind energy in Egypt: Economic feasibility for Cairo. Renewable and Sustainable Energy Reviews, 16(5), 3312– 3319.
22. Hassaan M. A. (2018). Using scholarly big data in assessing contribution of national expertise to climate change knowledge; case study: Egypt. Journal of Data Analysis and Information Processing 06: 67-78. 10.4236/jdaip.2018.63005
23. Hassaan M. A., Hassan A., & Al-Dashti H. (2021). GIS-based suitability analysis for siting solar power plants in Kuwait. The Egyptian Journal of Remote Sensing and Space Science, 24(3), 453–461. https://doi.org/10.1016/j.ejrs.2020.11.004
24. Hassaan M. A., Abdrabo M. A. K. A., Hussein H. A., Ghanem A., & Abdel-Latif H. (2024). Potential Impacts of Climate Change on Renewable Energy in Egypt. Environmental Monitoring and Assessment, 196(3), 268. https://doi.org/10.1007/s10661-024-12428-1
25. IRENA. (2023). Renewable Power Generation Costs in 2022. International Renewable Energy Agency (IRENA), Abu Dhabi.
26. Lashin A., & Shata, A. (2012). An analysis of wind power potential in Port Said, Egypt. Renewable and Sustainable Energy Reviews, 16(9), 6660–6667.
27. Mahdy M., & Bahaj A. S. (2018). Multi criteria decision analysis for offshore wind energy potential in Egypt. Renewable Energy, 118, 278–289.
28. Nabipour N., Mosavi A., Hajnal E., Nadai L., Shamshirband S., & Chau K.-W. (2020). Modeling climate change impact on wind power resources using adaptive neuro-fuzzy inference system. Engineering Applications of Computational Fluid Mechanics, 14(1), 491–506. https://doi.org/10.1080/19942060.2020.1722241
29. Nagi A. A., & Nagi H. A. (2002). Archaeological and tourist attractions in Egypt. Cairo: Dar Nahdat El Sharq. Ohba M. (2019). The impact of global warming on wind energy resources and ramp events in Japan. Atmosphere, 10(5), 265.
30. Pachauri R. K., Allen M. R., Barros V. R., Broome J., Cramer W., Christ R., Church J. A., Clarke L., Dahe Q., & Dasgupta P. (2014). Climate change 2014: synthesis report. Contribution of Working Groups I, II and III to the fifth assessment report of the Intergovernmental Panel on Climate Change. IPCC.
31. Pakere I., Kacare M., Grāvelsiņš A., Freimanis R., & Blumberga A. (2022). Spatial analyses of smart energy system implementation through system dynamics and GIS modelling. Wind power case study in Latvia. Smart Energy, 7, 100081.
32. Pereira E. B., Martins F. R., Pes M. P., da Cruz Segundo E. I., & Lyra A. de A. (2013). The impacts of global climate changes on the wind power density in Brazil. Renewable Energy, 49, 107–110.
33. Rao K. R. (2019). Wind Energy: Technical Considerations. In Wind energy for power generation: meeting the challenge of practical implementation. Springer Nature.
34. Razeghi M., Hajinezhad A., Naseri A., Noorollahi Y., & Moosavian S. F. (2023). Multi-criteria decision for selecting a wind farm location to supply energy to reverse osmosis devices and produce freshwater using GIS in Iran. Energy Strategy Reviews, 45, 101018.
35. Rediske G., Burin H. P., Rigo P. D., Rosa C. B., Michels L., & Siluk J. C. M. (2021). Wind power plant site selection: A systematic review. Renewable and Sustainable Energy Reviews, 148, 111293.
36. REN21. (2023). Renewables in Energy Supply. In Renewables 2023 Global Status Report (GSR).Paris
37. Salah S. I., Eltaweel M., & Abeykoon C. (2022). Towards a sustainable energy future for Egypt: A systematic review of renewable energy sources, technologies, challenges, and recommendations. Cleaner Engineering and Technology, 8, 100497.
38. Saleous N., Issa S., & Al Mazrouei J. (2016). GIS-based wind farm site selection model offshore Abu Dhabi Emirate, UAE. The International Archives of the Photogrammetry, Remote Sensing and Spatial Information Sciences, 41, 437–441.
39. Samak Y. A. A. (2023). Geospatial Multi-criteria Analysis for Solar and Wind Power Modelling for Kingdom of Saudi Arabia’s Population Using GIS: A Case Study for the Cities of Makkah and Jeddah. American Journal of Geographic Information System, 12(1), 28–42.
40. Sawadogo W., Reboita M. S., Faye A., da Rocha R. P., Odoulami R. C., Olusegun C. F., Adeniyi M. O., Abiodun B. J., Sylla M. B., & Diallo I. (2021). Current and future potential of solar and wind energy over Africa using the RegCM4 CORDEX-CORE ensemble. Climate Dynamics, 57(5–6), 1647–1672.
41. Sliz-Szkliniarz B., Eberbach J., Hoffmann B., & Fortin M. (2019). Assessing the cost of onshore wind development scenarios: Modelling of spatial and temporal distribution of wind power for the case of Poland. Renewable and Sustainable Energy Reviews, 109, 514–531.
42. Smith J., Deck, L., McCarl B., Kirshen P., Malley J., & Abdrabo M. (2013). Potential impacts of climate change on the Egyptian economy. In Report of a study implemented under the UN Climate Change Risk Management Joint Programme funded by the UN MDG Fund and the Finnish Government, prepared for the United Nations Development Programme (UNDP) with the Government of Egypt, UNDP, Cairo, Egypt.
43. Tercan E., Tapkın S., Latinopoulos D., Dereli M. A., Tsiropoulos A., & Ak M. F. (2020). A GIS-based multi-criteria model for offshore wind energy power plants site selection in both sides of the Aegean Sea. Environmental Monitoring and Assessment, 192, 1–20.
44. Tong, W. (2010). Fundamentals of wind energy. In Wind Power Generation and Wind Turbine Design (p. 8). WIT Transactions on State of the Art in Science and Engineering, WIT press. https://doi.org/10.2495/978-1-84564-/205-101
163 Horreya Avenue, Elshatby, Alexandria, 21526
163 Horreya Avenue, Elshatby, Alexandria, 21526
163 Horreya Avenue, Elshatby, Alexandria, 21526
Ghanem A., Abdrabo M., Hassaan M. Would climate change pose a challenge to meeting wind targets? A GIS-based approach to unravel impacts and identify suitable sites in Egypt. GEOGRAPHY, ENVIRONMENT, SUSTAINABILITY. 2025;18(3):6-18. https://doi.org/10.24057/2071-9388-2025-3669
 Email this article (Login required)
Email the author (Login required)
Email this article (Login required)
Email the author (Login required) 
Editor-in-Chief
Kasimov Nikolay S.Lomonosov Moscow State University
Moscow 119991 Russia, Leninskie Gory, Faculty of Geography, 1806a
Phone +7 495 939-15-52
E-mail: ges-journal@geogr.msu.ru





