


RESEARCH PAPER
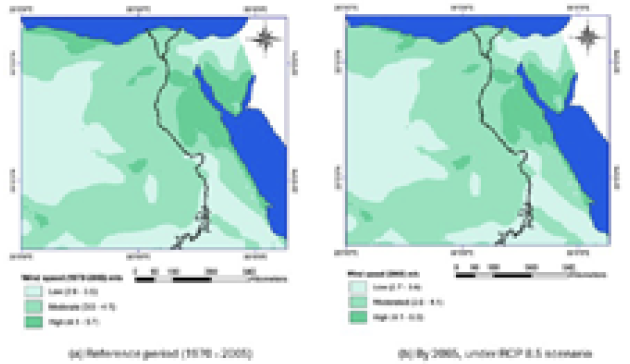
Renewable energy sources are critical choices for achieving long-term energy security while minimizing the effects of climate change. Wind energy in Egypt has received attention, however, wind power potential is dependent on climatic factors such as wind speed and temperature. Therefore, the wind power plan must rely on an in-depth understanding of wind resource sensibility to climate change to guarantee its sustainability, thereby supporting wind plan and climate change strategy. Using GIS analysis, the effect of climate change has been estimated on wind power density by 2065 under the climate change RCP 8.5 scenario. Furthermore, some criteria, such as elevation, slope, road networks, protectorates, archeological sites, touristic sites, and grids, have been used to identify regions that would be suitable for wind projects. The results revealed that wind energy potential is expected to be vulnerable to climate change, reflected in a 1% decrease in regions with high wind power density. Even after considering the effect of climate change, the Suez Gulf region would be the most suitable. Projects can also be expanded to other suitable locations where there are no projects yet, such as the Sinai Peninsula and the Red Sea coast.
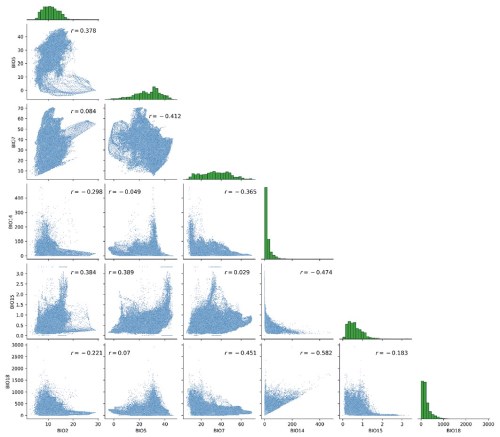
Nineteen bioclimatic parameters from BIOCLIM are widely used in Species Distribution Modeling (SDM). To improve modeling quality, it is essential to reduce the number of parameters. Several approaches have been proposed to solve this challenge, but each has its own limitations. In this study, we aimed to develop an effective statistical method based on identifying correlation groups of parameters and selecting the least correlated ones. Several statistical techniques were used to ensure a reliable parameter selection: simple correlation matrix analysis, cluster analysis (HDBSCAN), and factor analysis (varimax and quartimax). As an example, bioclimatic parameter values for the period 1991–2020 were analyzed for the whole globe. The results obtained using different methods show good consistency. Several correlation groups were identified, ranging from four to five, depending on the interpretation of the negative correlations. One group of two parameters, BIO14 and BIO17, can also be identified based on the results of the varimax factor analysis, although this correlation group was not identified by other methods. Finally, six bioclimatic parameters were selected (BIO2, BIO5, BIO7, BIO14, BIO15, and BIO18), one from each group that demonstrated the minimum average value of the correlation coefficient with parameters from other groups. The average correlation between the selected parameters was significantly lower than in the case of using previously applied methods with the same number of selected parameters.
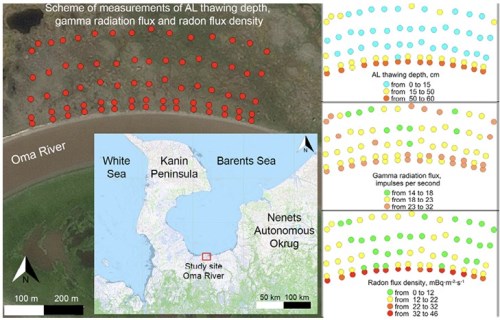
The purpose of this article is to examine the distribution of natural radionuclides as well as the gamma radiation flux due to the variations of soil seasonal thawing depth. The study was conducted at a lumpy peat bog located within the catchment area of the Oma River, located within the Nenets Autonomous Okrug of Russia. The site was selected due to the presence of an active layer (AL) with varying depths of thawing, as well as the warming effect of the river. This feature enabled an initial assessment of the impact of thawing depth on radon flux, gamma radiation, and the distribution of other natural radionuclides along the peat profile. Field observations revealed that permafrost deposits act as a barrier to the intake of ²²²Rn from geological layers. The relationship between alterations in radiation parameters (gamma radiation flux, radon flux density (RFD), radionuclide composition of peat) and the thickness of the AL has been established. An increase in gamma radiation levels and RFD has been observed in areas exhibiting maximum seasonal thawing of the seasonally thawed layer. The correlation coefficients were found to be 0.70 and 0.83, respectively. The analysis of peat profiles in diverse permafrost settings revealed that in regions exhibiting deeper thawing of soil, there is an abundance of ²¹⁰Pb relative to the concentration of its progenitor radionuclide, ²²⁶Ra. The observed excess of ²¹⁰Pb may be attributed to radon flux from deeper geological layers.
In the context of climate change, forests are a vital source of ecosystem services for humankind, acting primarily as carbon sinks. The aim of this study is to use the machine learning algorithms available in the Google Earth Engine (GEE) to predict the above-ground biomass of the Azrou forest in the Middle Atlas Mountains of Morocco. After a literature review, the work consisted of characterizing the natural features through Land Use Land Cover analysis (LULC) and forest stand types. The accuracy of the forest stand type classification was assessed at 81.55% using the kappa index. Analysis of vegetation cover time series data, derived from NASA imagery and MODIS, was carried out, focusing on four key indices: NDVI (Normalized Difference Vegetation Index), EVI (Enhanced Vegetation Index), LAI (Leaf Area Index), and FPAR (Fraction of Photo synthetically Active Radiation). The study predicted biomass using the Random Forest machine-learning model, implemented in GEE with JavaScript. NASA/ORNL biomass data for 2010 served as the dependent variable, while LULC, elevation, and the four indices were used (selected summer period) as independent explanatory variables. In addition, forest stand types were integrated to calculate total biomass for specific stand types and for the study area as a whole for the years 2015, 2020 and 2024. In 2024, the predicted biomass is 461,587 tons, compared with 501,172 tons in 2010. The biomass median values by species were 29 tons/ha for pure Atlas cedar (Cedrus atlantica Manetti), 24 tons/ha for pure holm oak (Quercus ilex) and 31 tons/ha for a mixture of Atlas cedar and holm oak. The results highlight challenging conditions for the Azrou forest, with a notable decline in biomass over the study period. These results will serve as a basis for future forestry planning in the context of climate change.
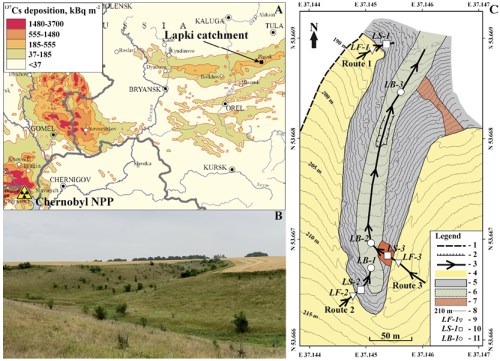
This paper explores the use of ¹³⁷Cs derived from Chernobyl as an indicator of sediment supply and transport within small agricultural catchments by analyzing the depth distribution of radionuclides, with a focus on post-Chernobyl changes in the activity concentration of radionuclides. To this end, depth-incremental sampling was carried out along routes of sediment transport within a small agricultural catchment subject to intense radioactive contamination in the Tula region. Some points were set to repeat the position of those made 27 years earlier and to understand the dynamics of deposition and the ¹³⁷Cs content in the sediment load. It has been suggested that a decrease in the activity concentration of ¹³⁷Cs can be used as an indicator of the relative age of deposits. Assuming this, the pattern of erosion product deposition on the sides and bottom of the dry valley was determined. This pattern was found to be stable and consistent with the observed geomorphic features and climate trends: the rate of accumulation in the valley bottom over the past 27 years has dropped almost twice, coinciding with a decrease in snowmelt runoff during springtime and no increase in intense rainfall. Grain-size analysis of the collected samples showed that selective transfer of clay particles may occur, but over a short delivery distance, it is unlikely that the sorting process will significantly alter the downward trend of ¹³⁷Cs concentrations. The proposed approach has the potential to significantly improve the accuracy of sediment budget estimations and environmental quality assessments.
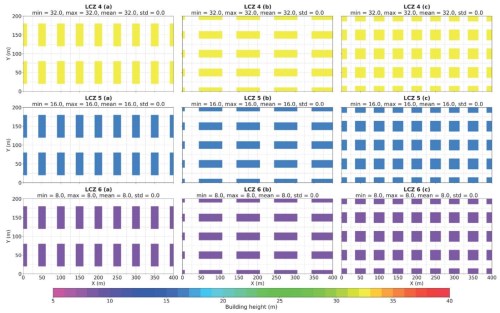
As urban areas grow, understanding the impact of built environments on aerosol distribution is crucial for accurate monitoring and forecasting of urban air quality and for the development of mitigation strategies. This study uses Large Eddy Simulation approach combined with Local Climate Zones (LCZ) classification to simulate the transport of Lagrangian aerosol particles in different urban configurations. The study simulates several urban configurations based on LCZ classification, specifically LCZ 4 (open high-rise), LCZ 5 (open mid-rise), and LCZ 6 (open low-rise), varying in building height and density. Both regular and randomized urban development configurations were examined to understand the impact of building geometry on particle dispersion. The study reveals that building orientation significantly influences particle distribution, with structures parallel to the wind adding horizontal dispersion and those perpendicular promoting vertical mixing. In randomized configurations, variations in particle concentrations highlight the role of architectural heterogeneity in turbulence development and aerosol dispersion. The findings suggest that aggregated block- or district-scale building geometry properties strongly influence aerosol transport. For randomized urban configurations, without idealized regular structures, the difference in the large-scale morphometric characteristics of specified LCZ types has a significantly greater impact on the particle dispersion process than the local geometric differences between configurations of the same LCZ type. Future research taking into account diverse meteorological conditions and more LCZ types is recommended to enhance the accuracy and applicability of this approach.
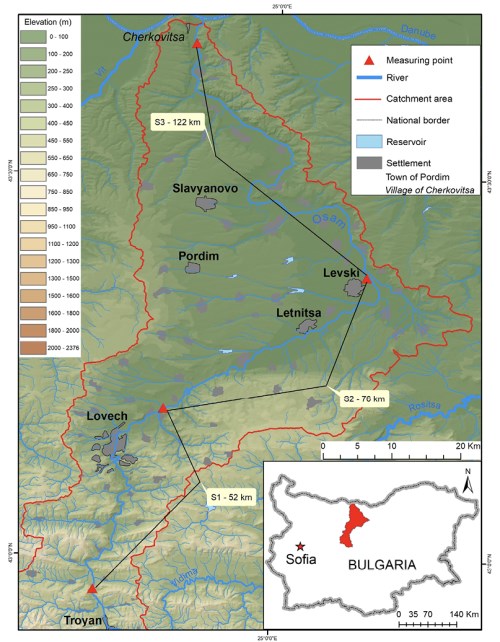
Various anthropogenic impacts alter the structure and functioning of natural components, and the process of self-recovery in a damaged environment is more relevant than ever. Water quality worsens due to pollution with organic and inorganic chemical substances, and understanding the ability of aquatic streams to self-purify is a key challenge facing the scientific community. This article, dedicated to the Osam River (Bulgaria), provides knowledge on how eight physico- chemical elements change their concentrations from upper to lower reaches and to what extent the river manages to self- purify of pollutants. The paper is based on information concerning the values of DO2, N-NH4, N-NO3, N-NO2, N-tot, P-PO4, P-tot, and BOD5, recorded at four sampling sites from 2015 until 2021. Water quality is classified into one of three classes of physico-chemical status (excellent, good, or moderate) following the guidelines in Regulation H-4/14.09.2012 for surface water characterization. The self-purification coefficient of Tumas (α) is computed to determine the extent to which the river is able to rid itself of pollutants. The results indicate that water quality changes from upstream to downstream due to the inflow of untreated wastewater discharged from various sources and the ongoing self-purification processes. In the upper section, the river fails to get rid of phosphate pollution caused by households and industry, while in the lower sector, nitrate loading from agriculture is most disturbing. The current research focuses on the ability of rivers to restore their natural conditions under various anthropogenic impacts and points to the need for more effective control of unregulated discharges.
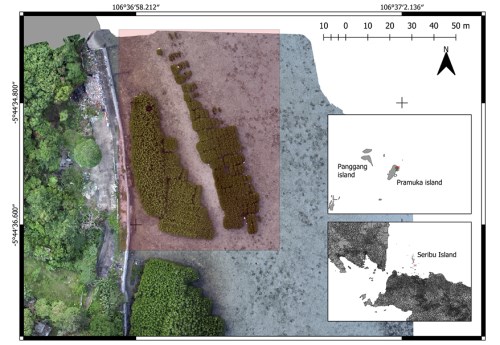
Mangrove forests provide critical ecosystem services, including coastal protection, habitat for biodiversity, and carbon sequestration. Monitoring these ecosystems is essential for their conservation and sustainable management. This study was conducted on Pramuka Island, Indonesia, focusing on high-density Rhizophora stylosa vegetation. Data was collected using the DJI M300 RTK UAV equipped with the Zenmuse L1 LiDAR sensor, which generated a Canopy Height Model (CHM) and identified treetops. Various kernel sizes (3×3, 5×5, 9×9, 11×11, 21×21) and Local Maximum Filter (LMF) window sizes (0.5, 1, 3 meters) were applied to analyze mangrove tree density. The study found that the combination of a 3×3 kernel with a 0.5 meter window size yielded the best results, achieving the highest F-score and balancing precision and recall. However, despite the optimized settings, LiDAR still struggled to detect individual trees in dense mangrove stands, resulting in the underestimation of tree counts compared to field data. This highlights the challenges LiDAR faces in dense vegetation environments. The study emphasizes the need for optimized kernel and window size configurations for more accurate tree detection and calls for further development of LiDAR-based algorithms to improve detection in mangrove forests. Improved methodologies will enhance the effectiveness of mangrove forest conservation and management efforts.
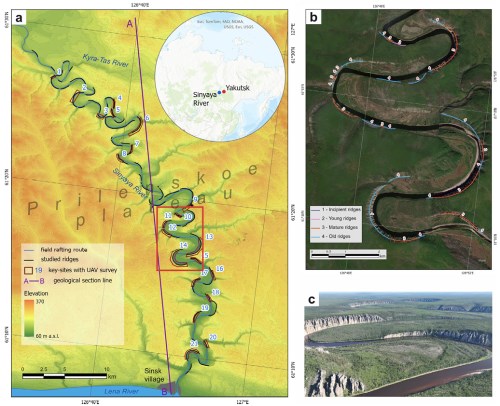
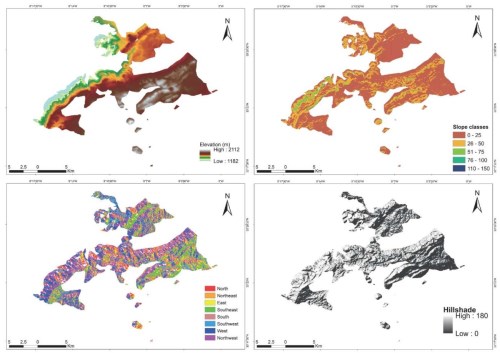
Unique karst evolution in Siberia is attributed to climatic factors and the presence of permafrost. Climatic fluctuations in Northern Eurasia had occurred during the Quaternary period and significantly influenced the processes of permafrost aggradation and degradation, as well as the karst activity. Despite their wide popularity and impressive manifestations, the karst landforms on the Prilenskoe Plateau still remain tenuously studied in terms of landform classification and obtaining their morphometric characteristics. The article presents the results of field studies of karst terrain in the Sinyaya River valley in Central Yakutia. Based on field observations and the analysis of the generated digital surface models, we have determined the median relative heights of different types of karst ridges in the Sinyaya River valley: “incipient ridges” - 34 m, “young ridges” - 42 m, “mature ridges” - 79 m and “old ridges” - 58 m. Most ridges that exceed 100 m are “mature and old”. The highest ridges are located on the concave parts of river meanders and belong to the type of “mature ridges”. In addition, our observations in the Sinyaya River valley have shown “old ridges” are the most common, accounting for over 58% of the overall ridge length. “Mature ridges” make up approximately 25%, “young ridges” 13%, and “incipient” ridges only 4% of the total. This distribution reflects the long history of topographic development in the valley and the significant influence of erosion processes on these features. The most prominent forms of this landscape include karst ridges, which present as rock pillars formed through physical and chemical weathering, with very active frost shattering, gravitational, and erosion processes. Using field surveys conducted with unmanned aerial vehicles (UAVs) and subsequent processing in a geographic information system (GIS), it was determined that the highest ridges are located in the lower reaches of the Sinyaya River, where it cuts through the axial, most elevated part of the Prilenskoe Plateau. The morphometric characteristics of the identified types of karst ridges and their spatial change along the river meanders are associated mainly with the activity of lateral river erosion, which ensures the removal of weathering material and slope deposits.
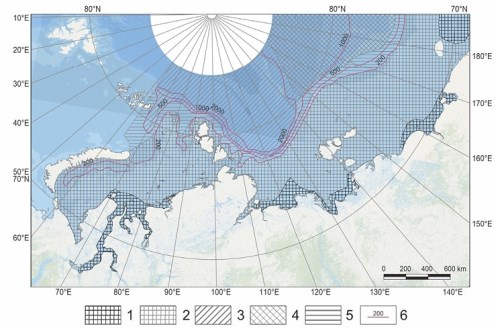
The article presents the results of digitizing the maps of submarine permafrost on the shelf of the Arctic seas of Russia. Submarine permafrost mapping relies heavily on expert knowledge because there is a lack of data regarding the structure and thickness of permafrost. Maps compiled by different authors vary significantly due to the use of different approaches, paleogeographic scenarios, ideas about the geological structure, evolution of shelf permafrost, sea level and climatic changes. The first maps were based on the analysis of shelf morphology and seawater temperature; they represent only the assumed boundaries of the submarine permafrost distribution. Later, the distribution of submarine permafrost was associated with neotectonic movements on the modern shelf. As the first drilling and seismoacoustic data were received, more detailed maps were compiled, and the discontinuous distribution of submarine permafrost was substantiated, especially in the Western Arctic. By now, a large amount of seismoacoustic and drilling data has been accumulated, which has made it possible to create new maps based on these data. In recent decades, methods of mathematical modeling the formation and evolution of submarine permafrost have been rapidly developed. Calculated maps of the distribution and depth of submarine permafrost top in the Russian Arctic have been compiled. For the first time, it has become possible to predict the rate of degradation of submarine permafrost under climate warming.
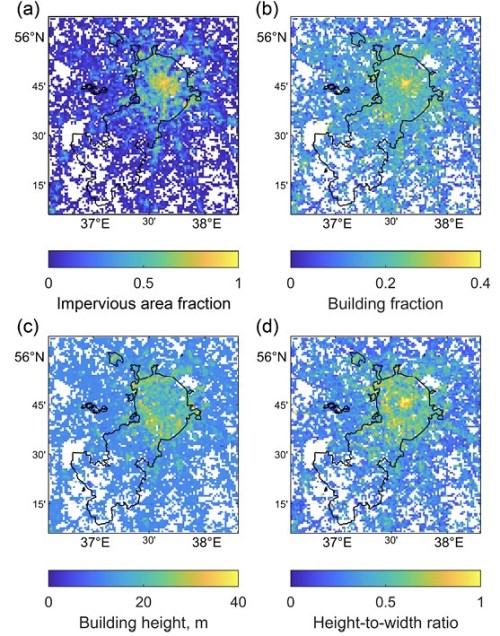
Numerical weather prediction (NWP) models, coupled with urban parameterizations, play a crucial role in understanding and forecasting meteorological conditions within urban environments. In the mesoscale NWP model COSMO, only one urban parameterization, TERRA_URB, is available in the model’s operational version. TERRA_URB describes the city as a flat surface with modified physical properties in accordance with the urban canyon geometry. In this study, we have coupled the latest version 6.0 of the COSMO atmospheric model with a more sophisticated urban canopy model, TEB (Town Energy Balance), which explicitly simulates the energy exchange between the facets of the urban canyon. Here, we present the coupling approach and assessment of the model’s sensitivity to urban schemes of different complexity (TEB and TERRA_URB) over the Moscow region for August 2022. Despite using the same external parameters for both schemes, simulations demonstrate notable differences in modeled temperature, with TEB generally producing lower nighttime and morning temperatures. This leads to a greater underestimation of the urban heat island intensity in TEB when compared with the observations but improves the modeled diurnal cycle of the urban temperature. We attribute the observed temperature discrepancies to the different descriptions of heat conductivity and storage within urban surfaces. Although there are no clear advantages to using a more complex parameterization in terms of model air temperature errors, TEB offers more options to fine-tune input parameters and takes into account additional processes, in particular those associated with building heating and cooling, as well as with urban green infrastructure.
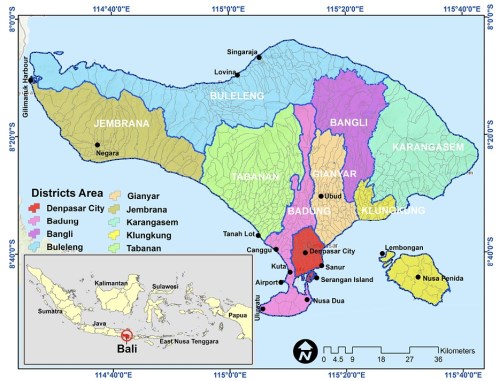
Global warming, driven by the rising concentration of greenhouse gases (GHGs), demands innovative, data- driven approaches to assess emission vulnerability at regional scales. This study developed a novel framework utilizing an unsupervised Convolutional Autoencoder (CAE) deep learning model combined with multi-sensor satellite data to map GHG emission vulnerability. The framework integrated nine environmental indicators, including tropospheric gases, land surface temperature, vegetation cover, anthropogenic proxies, and elevation, all sourced from freely accessible remote sensing platforms. The CAE model effectively captured complex spatial patterns and reduced high-dimensional inputs into 128 latent features, enabling vulnerability assessment without requiring labeled training data. Results indicated that southern coastal regions, particularly Denpasar and Badung, exhibited the highest vulnerability due to dense urbanization and tourism-related activities. Based on zonal statistics, 11.31% of local administrative zones were identified as having high to very high vulnerability, while 18.72% were classified as moderate, and 69.97% as low to very low. The most vulnerable areas were concentrated along the southern coastline, known as a hub for tourism and economic activity, with additional pockets of vulnerability found in several northern coastal zones. These findings demonstrate the capacity of unsupervised deep learning to detect emission hotspots and spatial variability, particularly in data-limited environments. The integration of scalable algorithms with open- access satellite data allows for rapid, cost-efficient assessments to inform evidence-based climate planning and mitigation strategies. This study introduces a practical and transferable approach for spatial quantification of GHG vulnerability, offering actionable insights for advancing global climate policy and supporting the Sustainable Development Goals.

ISSN 2542-1565 (Online)


