Preview

GEOGRAPHY, ENVIRONMENT, SUSTAINABILITY

Advanced search

Special Issue "Water sustainability at global, regional and national levels"

Guest editors:

  1. Prof. Natalia Frolova, Lomonosov Moscow State University, Russia
  2. Prof. Frank Winde, North-West University, South Africa
  3. Prof. Chansheng He, Western Michigan University, USA
  4. Prof. Liliana Zaharia, University of Bucharest, Romania
  5. Dr. Maria Kireeva, Lomonosov Moscow State University, Russia
Vol 13, No 2 (2020)
View or download the full issue PDF

Special Issue "Water sustainability at global, regional and national levels" 

6-16 1653
Abstract
Through moving large volumes of rock for decades or even centuries from geological underground to surface, industrial scale mining invariably alters the natural local and regional hydrological conditions. Consequences include irreversible changes of flow gradients and water quality in aquifers and streams effected through dewatering, ground subsidence, acid mine drainage, etc. During their lifetime mines spent significant resources and energy on maintaining an ever-increasing diversion from natural hydraulic equilibria through pumping rising volumes of ingress water from ever greater depths, especially if operating below water-rich formations (karst) or in humid climates. Associated pumping costs may even lead to premature mine closure. In cases where complete flooding of closed mines is not an option (e.g. to protect water resources or infrastructure) such costs remain well after mines closed for as long as flooding restrictions apply. In large and densely populated regions in South Africa or Germany, for example, where mining succeeded in triggering urbanisation and self-sustaining economic development it is (currently) assumed that pumping will be needed forever. Accordingly, postclosure water management is no longer only a long-term liability but indeed a perpetual burden placed on future generations that had little direct benefits from earlier mining. This paper focuses specifically on possible ways of reducing perpetual postclosure water management costs specifically of using abandoned mines for generating and storing renewable energy. It discusses successful examples already implemented, concepts investigated but not yet realised as well as technologies that received little, if any, attention to date. The latter range from using mines (included flooded ones) for the storage of electrical energy via different technologies, harvesting geothermal energy from mine water and voids to different ways of transforming chemical energy contained in mine water into electricity.
17-24 1107
Abstract
Despite numerous researches on river channel incision, there are fewer studies on the impact of channel adjustments on floods. This paper aims to investigate channel adjustments and to analyse their impact on the frequency of floods by estimating the return period of the bankfull discharge of the Prahova River in the South-Eastern Subcarpathians (Romania). The study is based on the analysis of the maximum annual discharges and cross-section profiles of the Prahova River at Câmpina gauging station (1976–2015). To estimate the return period of the bankfull discharge, the log Pearson III distribution was used. Overall, the maximum depth and the cross-section area at the bankfull stage increased during the analysed period, indicating channel incision and lateral stability. The bankfull discharge of 1976 could be reached every year and the one of 2015 could occur almost every 5 years. Therefore, due to channel incision and increased channel capacity, overflowing the bankfull stage is a less frequent hazard on the Prahova River at Câmpina gauging station. River management appears to maintain this situation as no measure is taken to decrease channel incision.
25-34 1601
Abstract

Water consumption has been evaluated for the basins of the rivers flowing into the Arctic seas of the Russian Federation and, separately, for the Arctic zone of Russia (AZR). Long-term dynamics of the major characteristics of water consumption are given for the period from the 1980s to 2017 along with data on its structure. The possible effect of the total water withdrawal and consumptive water use on river water inflow into the Arctic seas has been evaluated for the 1980s (a period of maximal anthropogenic load), for 2006–2017 and up to 2030. The volumes of water consumption in limits of AZR are relatively low. Moreover, the water withdrawal has dropped considerably compared with the situation in the 1980s, in particular, by about 30% in the Pechora, Lena river basins, and from the rivers of Murmansk oblast, and by 50% in the Northern Dvina, Yenisei, and Kolyma river basins. It has increased in the Nenets and Yamalo-Nenets AO because of the intense development of the local oil-and-gas complex. Nowadays, according to the authors’ estimates, 21.28 km3/year is being withdrawn in the drainage basins of RF Arctic seas and 2.58 km3/year, within the AZR, or 28.8 and 3.5% of the total volume in Russia. The largest contribution to this value is due to the water-management complexes in the basins of the Ob (14.7 km3/year), Yenisei (2.77), Northern Dvina (0.64), and Murmansk oblast (1.72 km3/year). The volumes of water discharges back into water bodies at the drainage basins of Russian Arctic seas are comparable with the volumes of freshwater withdrawal -71% of water intake. Even lesser is the difference within AZR. The major water users are the industry (with a high proportion of mining plants), thermal power engineering, and municipal economy. But considerable and diverse hydrological restrictions exist at the municipal level and for some water users in AZR. These local hydrological restrictions have been formulated and analyzed in detail, for the first time. They form three large groups. Original maps are given to illustrate the specific features and regularities in the present-day distribution of water-management characteristics over AZR.

35-42 2721
Abstract
The hydrological disasters have the largest share in global disaster list and in 2016 the Asia’s share was 41% of the global occurrence of flood disasters. The Jammu and Kashmir is one of the most flood-prone regions of the Indian Himalayas. In the 2014 floods, approximately 268 people died and 168004 houses were damaged. Pulwama, Srinagar, and Bandipora districts were severely affected with 102, 100 and 148 km 2 respectively submerged in floods. To predict and warn people before the actual event occur, the Early Warning Systems were developed. The Early Warning Systems (EWS) improve the preparedness of community towards the disaster. The EWS does not help to prevent floods but it helps to reduce the loss of life and property largely. A flood monitoring and EWS is proposed in this research work. This system is composed of base stations and a control center. The base station comprises of sensing module and processing module, which makes a localised prediction of water level and transmits predicted results and measured data to the control center. The control center uses a hybrid system of Adaptive Neuro-Fuzzy Inference System (ANFIS) model and the supervised machine learning technique, Linear Multiple Regression (LMR) model for water level prediction. This hybrid system presented the high accuracy of 93.53% for daily predictions and 99.91% for hourly predictions.
43-51 1706
Abstract

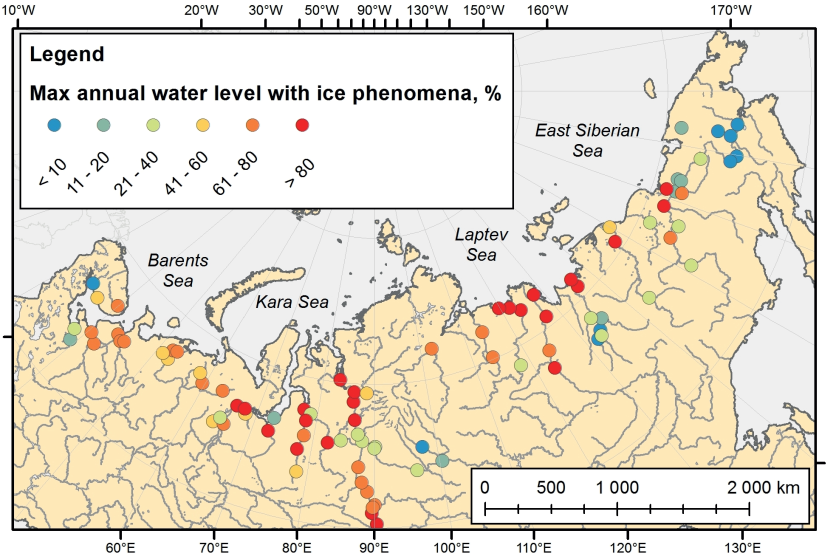
The ice regime of the Russian Arctic rivers and its hazardous manifestations under current climate conditions are characterized. The ice phenomena in rivers in the region determine the conditions of navigation, water supply, hydropower station (HPS) operation, and the construction of temporary ice bridges and roads. Data of more than 100 hydrological gages over period from 1936 to 2016 were used to compile various cartographic materials and to analyze the spatial variations of the dates of ice phenomena, the duration of ice-free and ice cover periods, and the maximal ice thickness. Special attention is paid to the characteristics of level regime in periods with ice phenomena. Data on the frequency of floodplain inundation during spring ice run, the hazard of ice jams, and the seasonal features of the passage of maximal annual water level are generalized.

The observed changes in ice regime characteristics and ice hazard are analyzed. The years of the start of statistically significant shift of the periods of ice phenomena, caused by both climate changes and anthropogenic impact, are identified. The increase in the duration of the ice-free period was found to be not greater than 3–4 days for East Siberian rivers, 5–6 days for the Middle and West Siberian rivers, and up to 10–12 days for the rivers in the European part. A decrease in the maximal ice thickness is most pronounced in the rivers of the Northern European Russia, where it is 10–15 cm. The frequency of floodplain inundation during spring ice run remains constant.

52-64 1170
Abstract
Floodplain soils function as long-lasting stock or source of different substances, including pollutants. The main factor determining biochemical processes in fluvisols is flooding. Global climate change, which is causing more frequent and massive floods, is urging us to assess the potential environmental risks and create appropriate environmental management strategies. This study was performed to estimate the impact of a heavy flood on the total content of major elements and both total and mobile trace elements in fluvisols of one of the longest rivers in the world, the Amur. The study was conducted in field conditions by sampling from the same soil profiles before and after the flood. As a result, 10 major and 42 trace elements were distinguished. Major-element composition was determined with X-ray fluorescent method, trace-element composition - with the inductive coupled plasma mass spectroscopy. Maximum decrease of concentration was determined for CaO, MnO, P2O5 (up to 60%) and Sr, Cd, Ba, Tl and Pb (up to 40%). Significant increase was in concentration of Ni, Cu, and Mo (up to 160%). Among mobile trace elements, increase was observed in concentration of Sc, Ni and Th (up to 400%). With the correlation analysis, it was also established that the main causes of changes in elemental composition of the soils were decrease of pH, development of redox environment and washing out of organic matter. The main factor determining the influence of the flood on fluvisols was floodplain relief, which affected the length of the inundation, flood water velocity and the way allochthonic matter retained.
65-72 1674
Abstract
The transition of water-deficient regions to sustainable agricultural development requires taking into account natural, economic and social factors, and restructuring of the sectoral and territorial structure of agriculture. In the case of the Crimean Peninsula, the most important factor was the interruption of water supply through the North Crimean Canal (April 2014). Hence, there was a need to revise the possibility of growing crops in dryland conditions. It has become practically impossible to grow rice, soybean, some vegetables, potatoes, grain corn, pome and stone fruits, etc. Farmers were forced to review grain and fodder crop rotation. They stopped growing crops that required systematic irrigation. Given these realities, a special place in crop rotation should have such plants as pea, chickpea, lentil, sainfoin, etc. The studies conducted by Crimean scientists and experience in commercial production stimulated farmers to grow essential oil crops since they are among the most promising. Viticulture based on the well-developed agriculture and vine growing in favourable areas of the Republic is also promising. Some pome and stone fruits that demand less irrigation are very promising for the Crimea too. Special attention should be paid to filbert, jujube, sweet almond, hazelnut, etc. Considerable efforts should be made to develop animal husbandry. The search for water at depths of 1-1.2 kilometres should be one of the ways to solve problems in the agro-industrial complex (AIC) of the Crimea, as well as wastewater treatment and their use for irrigation purposes. All the aforementioned changes are already taking place in the AIC. But they require significant acceleration and investments in prospective economic sectors.
73-83 4510
Abstract
The Thai government launched Phase 3 of its Rubber Plantation Project in 2011 aiming to expand the total area of new plantations to 128,000 ha. The northeastern region contains the largest areas for new rubber plantation areas, yet it is known to have unfertile areas and regular encounters with water scarcity during summer. This leads to research questions as to how the policy affects land and water use in the country. This study shows that the water requirement of rubber trees is 14,221 m3/ha/year which is higher than that of other local crops (e.g., rice, cassava, sugarcane, and corn). Thus, irrigation systems must be utilized during certain months. The land use changes from the cultivation of edible crops to rubber do not threaten the amount of food available for domestic consumption since Thailand generally exports more of its crops than it consumes. From this policy, total rubber yield would increase to 742 M kg and rice, corn, and cassava would disappear about 1613 M kg (24% of the total amount of rice exported in 2012), 7837 M kg, 8926 M kg, respectively.The government should provide a better plan on crop water requirements suitable for each region and knowledge on increasing crop-per-drop efficiency to all farmers.
84-95 2159
Abstract
The article focuses on the study of flood flow changes on the rivers of the European Territory of Russia (ETR) in the last thirty years. This is an extremely important problem, as with floods, whose contribution to the structure of the annual flow of European rivers in recent decades has been increasing, the most destructive floods are associated. On the example of 55 representative hydrological gauge stations located on the ETR in regions with different conditions of runoff formation, the features of both summer and winter floods formation are considered. It has been established that over the past thirty years on the most rivers there has been an intensive reduction in the ratio of volumes and maximum flood discharges in relation to the similar characteristics of the basic runoff. Increased groundwater supply is observed, and the absence of significant freezing of the soil leads to an increase in infiltration. The volumes of flood runoff and the basic runoff become comparable or the proportion of the latter begins to prevail. The main reason for the increase in minimum water discharge is associated with an increase in flood flow under the influence of more intense and prolonged thaws. A distinctive feature of the water regime of recent decades has been the flood peaks in almost any season of the hydrological year. In the middle and southern part of the ETR – in the basins of the Volga, Oka, Vyatka, Don Rivers – there is an increase in low-water flow and in the quota of flood in annual flow. On some rivers of the ETR, the spring flood runoff currently accounts for less than 50% of the annual runoff.
96-103 1556
Abstract
We examine water resource mapping as an important component of the geographical approach in land hydrology and in the water sector which serves to assist considerably in dealing with water problems and water resource management. We suggest that seven groups of water resource maps be distinguished: introductory maps, maps of formation of surface and subsurface water regimes, maps of assessments of water resource potential, maps of water management, maps of anthropogenic impacts on water, maps of hazardous hydrological phenomena and maps of water protection measures. Characteristic properties water resource mapping for atlas products are identified using a case study of territory surrounding Lake Baikal as a site of global significance. We compiled an inventory of water resource themes covered by various atlases of the Baikal region and determined gaps relating to economic aspects of water and to maps on water protection. Limitations of the traditional isoline method in geographical water resource mapping are shown. At hillslope level where atmospheric precipitation transforms to surface runoff further to stream flow, it is recommended that the indication localization method be used, which is based on interdependencies of components of the geosystem. Water runoff mapping at the regional level in the hydrographic network uses the technique of long-channel (epure) mapping based on tools of structural hydrographic and Horton-Strahler classification. A technique of regionalization is described for flood hazards, water protection and recreation zoning of Baikal’s shores as well as cartographic modeling of processes in the Selenga river delta.
104-114 2750
Abstract
Estimation of design flood is imperative for hydraulic designs of spillways and various other water resources development projects as well as very essential for flood risk assessment. The objective of the present study is to apply Geographical Information System (GIS) supported hydro informatics approach for estimation of design flash-flood in Bargi dam cross-section. A criterion used for estimation of design flash flood is validated by central water commission (CWC). A hydrologic modelling software (HEC-GeoHMS) is used for the delineation of basin characterises for simulation of the precipitation-runoff process of the dendritic basin system. The SUH (Synthetic Unit Hydrograph) and flood hydrographs for 25, 50 and 100 year return periods are computed along with time distribution curve which can be used to derive the time distribution co-efficient of storm rainfall in the sub-basins for the rainstorm of any duration. It is observed in this research that the peak characteristics of the design flash-flood are more perceptive to the various design storm pattern. It is demonstrated that flood hydrographs are important in flood-risk management. The results attained exhibit the capability of the flood hydrograph to describe the effects of different hydraulic systems.
115-123 4666
Abstract
In addition to the five main factors affecting the formation of floods including slope, rainfall, drainage density, soil, and land cover, the relative slope length factor has also been considered to be one of the fundamental causes that contribute to flood hazard. The paper analyzes the theoretical basis for choosing the relative slope length criterion when zoning flood hazard in Lam river basin. The important role of this factor was evaluated by the results of the flood risk zoning map established by the method of integrating AHP and GIS technology in two cases: using 5 flood influence criteria and using 6 flood influence criteria. Flood hazard zoning maps for 2 cases were tested with 3 historic floods occurring on Oct 2010, Oct 2013 and Oct 2016. The results showed that the map established with six influence factors is more detailed and accurate than the one created with five factors affecting flood hazard because of the similarity with the reality of that map. The results of the study are applicable to other river basins which their geographical features are similar to characteristics the Lam river basin.

REGULAR ISSUE 

127-134 1547
Abstract
The content of heavy metals and Al in the aerosol matter over the Sea of Azov has been studied. According to the special test the vast majority of samples were attributed to the type of marine aerosol. The ranges of contents were determined as following: Fe (200 – 2000 ng/m3), Al (20 – 200 ng/m3), Zn (10 – 280 ng/m3), Cu (2 – 23 ng/m3), Ni (1 – 16 ng/m3), Pb (3 -30 ng/m3), Cd (0.4 –2.8 ng/m3); Mn (3 – 23 ng/m3), Cr (1 – 15 ng/m3). The spatial distribution of HMs in the marine aerosol of the Sea of Azov depends on the influence of the river-sea geochemical barrier zone in the Taganrog Bay and the anthropogenic impact of the coastal industrial cities. HM concentrations decrease from the northern coast of the bay and the mouth of the Don River towards the open sea. The maximum HM content in marine aerosol observed in the mouth area of the Don River. It may be associated with the HM accumulation at the river-sea geochemical barrier, and also with the anthropogenic impact of the cities of Rostov-on-Don, Azov and Taganrog. Anthropogenic impact of the city of Mariupol cause the maximum values of Fe, Cr, and Cd in marine aerosol matter of the western part of the Taganrog Bay.
135-146 5473
Abstract
This paper assesses the trends of greenhouse gas emissions in Ethiopia. To assess the trends of greenhouse gas emissions, the paper uses quantitative data ranging from 1990–2013. This data is ascertained from United Nations Framework Convention on Climate Change Data interface. The Paper analyzed these data using descriptive methods of data analysis. Accordingly, the paper revealed that Ethiopia has shown increasing trends of emission in most sectors, except land use-land use change, and forestry. Having an average emission of 50739.73 GgCO2e , land use-land use change, and forestry is the largest sector that contributes to greenhouse gas emissions in Ethiopia. The agricultural sector played the second largest role with an average emission level of 47093.63 GgCO2e . Following the above two sectors, the energy sector, ranked third, has contributed an emission of 17670.13 GgCO2e . Other sectors like waste, industrial, and international bunkers have contributed a trivial amount to the country’s greenhouse gas emissions, with average greenhouse gas emissions of 3081.21 GgCO2e , 881.21 GgCO2e , and 458.65 GgCO2e respectively. However, the annual emissions growth rate of the bunker sector is very high accounting for 57.53%. The industrial sector has shown a 20.05% average annual growth rate followed by land use- land use change and forestry with an annual emission growth rate of 19.76%. The energy sector and waste sector have 9.45% and 7.4% average annual growth rates. The agricultural sector has a 3.11% of average annual growth rate. The country has introduced different policy instruments. However, most of the policy instruments are not effective enough.
147-153 1353
Abstract
The study goal is to monitor and evaluate the significant changes in land use/land cover (LULC) in Al-Yarmouk basin (YB) within only 8 year. (YB) is shared between Syria, Jordan, Palestinian Authority, and Israel. (YB) has been affected not only by water scarcity, frequent drought conditions; But nowadays provide proof that the major factor responsible for the current of the significant changes in (LULC) in the study area is the Syrian civil war that began in mid-2011, and the Syrian refugee influx into Jordan has been massive, more than 660,935 Syrians were registered in three camps; Za’atri the largest refugee camp in the world, Azraq and the Emirate, according to the Official figures, with the highest density about 58 not 50 person look; Fig.5 in YB. Landsat Thematic Mapper Landsat 5 (2010) and 8-OLI (2018) covering a period of 8 years. An on-screen digitizing methodology has been employed. The images of the study area were categorized into four different classes: vegetation, built-up area, barren area, and water bodies. Normalized difference vegetation index (NDVI) was applied at a threshold value≥ 0.1 to distinguish between the vegetated area and non-vegetated areas. IN this study, the NDVI and LULC based classification have indicated that significant change in (LULC) between a year 2010 and 2018. The Major change has been found in the vegetation area which decreased by (-12.02%), in addition, an increase of the built up area by (+1.69%). Al-Wehda dam area decreased by -0.08%. Linear regression trends showed a slight decrease in the mean rainfall during the study period (2010/2018). However, this finding is not statistically significant at the 95 % confidence level.
154-165 1669
Abstract
The paper presents a series of maps of extreme climatic characteristics for the Ural region and their changes under climate warming observed in last decades. We calculate threshold, absolute and percentile-based indices with the use of daily temperature and precipitation dataset of 99 weather stations of Roshydromet. Extreme climatic characteristics were averaged by moving 30-year periods from 1951 to 2010 for temperature and from 1966 to 2015 for precipitation. The regression-based interpolation was used for mapping climatic extremes taking into consideration the influence of topography. Elevation and general curvature of the terrain are considered as independent variables. In addition, the changes of extreme characteristics between the 30-year periods were estimated. As a result, a series of maps of temperature and precipitation extremes for the Ural region has been created. The maps present not only spatial distribution of the climatic extremes, but also regional features of their changes under climate warming. In general, the revealed changes in extremes in the Ural region correspond to the trends observed on the most of the territory of Russia. There is a substantial decrease of the number of extremely cold days in winter, and the minimum winter temperature has a strong positive trend (up to 1-5°C/30 years). The maximum temperature in summer has a positive trend in most of the territory, but the increase rate does not exceed 2°C between 1951–1980 and 1981–2010. The precipitation extremes also increased up to 0.5-1.5 mm when comparing 1966–1995 and 1985–2015 periods.
166-174 1454
Abstract
Data analysis shows that dust and CO have a very high concentration, causing air pollution. Meanwhile, SOand NO2 concentrations are lower than the permitted levels. The method inverse distance weighting (IDW) has been proved to be effective in modeling atmospheric pollution space in the study area. The results indicated that the air was contaminated. Pollution levels increase gradually in the following areas: Residential areas <Waste treatment areas <Industrial parks. The integrated pollution map shows that there have been signs of ecological insecurity in the dry season, so there should be measures to control the source of emissions into the environment.
175-184 2112
Abstract
Investigating information on land cover changes is an indispensable task in studies related to the variation of the environment. Land cover changes can be monitored using multi-temporal satellite images at different scales. The commonly used method is the post-classification change detection which can figure out the replacement of a land cover by the others. However, the magnitude and dimension of the changes are not been always exploited. This study employs the mixture of categorical and radiometric change methods to investigate the relations between land cover classes and the change magnitude, the change direction of land covers. Applying the Change Vector Analysis (CVA) method and unsupervised classification for two Landsat images acquired at the same day of years in 2000 and in 2017 in Duy Tien district, the experimental results show that a low magnitude of change occurs in the largest area of direction I and direction IV regarding the increase of Normalized Difference Vegetation Index (NDVI), but the opposite trend of (Bare soil Index) BI in the rice field. Alternately, the high magnitude of change is seen in the build-up class which occupies the smallest area with 1700 ha. The characterized changes produced by the CVA method provide a picture of change dynamics of land cover over the period of 2000-2017 in the study area.


Creative Commons License
This work is licensed under a Creative Commons Attribution 4.0 License.


ISSN 2071-9388 (Print)
ISSN 2542-1565 (Online)