


Contents
Scroll to:
https://doi.org/10.24057/2071-9388-2020-12
Scroll to:
The ice regime of the Russian Arctic rivers and its hazardous manifestations under current climate conditions are characterized. The ice phenomena in rivers in the region determine the conditions of navigation, water supply, hydropower station (HPS) operation, and the construction of temporary ice bridges and roads. Data of more than 100 hydrological gages over period from 1936 to 2016 were used to compile various cartographic materials and to analyze the spatial variations of the dates of ice phenomena, the duration of ice-free and ice cover periods, and the maximal ice thickness. Special attention is paid to the characteristics of level regime in periods with ice phenomena. Data on the frequency of floodplain inundation during spring ice run, the hazard of ice jams, and the seasonal features of the passage of maximal annual water level are generalized.
The observed changes in ice regime characteristics and ice hazard are analyzed. The years of the start of statistically significant shift of the periods of ice phenomena, caused by both climate changes and anthropogenic impact, are identified. The increase in the duration of the ice-free period was found to be not greater than 3–4 days for East Siberian rivers, 5–6 days for the Middle and West Siberian rivers, and up to 10–12 days for the rivers in the European part. A decrease in the maximal ice thickness is most pronounced in the rivers of the Northern European Russia, where it is 10–15 cm. The frequency of floodplain inundation during spring ice run remains constant.
Agafonova S.A., Vasilenko A.N. Hazardous Ice Phenomena In Rivers Of The Russian Arctic Zone Under Current Climate Conditions And The Safety Of Water Use. GEOGRAPHY, ENVIRONMENT, SUSTAINABILITY. 2020;13(2):43-51. https://doi.org/10.24057/2071-9388-2020-12
Studying the present-day trends in changes in the ice regime of arctic rivers and its hazardous manifestations is an important scientific and practical problem. Ice phenomena in Arctic rivers are taking place over the major part of the year. The ice regime of the rivers determines the character of water economy functioning in the territory under consideration. The time and duration of ice phenomena determine the periods of summer navigation, and the conditions of water supply, the operation of HPSs, and temporary ice bridges and roads. The hazardous ice phenomena and processes include ice jams and hanging ice dams, which cause floods, dense ice run at high water level, through freezing of rivers, the formation of frazil ice and sludge, weak and thin ice, unstable ice cover, aufeises, earlier ice formation, and delayed ice disappearance at low water levels (Table 1) (Agafonova et al. 2017).
Table 1. Hazardous ice phenomena in Russian rivers
Engineering problem | Ice phenomena and processes | |
Increased water levels and flooding | Ice jams, hanging ice dams | |
Violation of operating conditions of various facilities | Water intakes | Through freezing, underwater ice |
Ice crossings | Low strength and thickness of ice, unstable freeze-up | |
Roads and bridges | naleds (aufeis) | |
Water transport | Early dates of ice appearance, late breakup and ice clearing at low water level | |
Damage to hydraulic structures and fleet | Ice run at high water level, ice pile-up | |
The study region is the Arctic zone of Russia, the boundary of which is determined by the Prezidential Decree of May 2, 2014 (the most recent amendments of May 13, 2019, Kremlin.ru 2019). The Arctic zone includes several administrative formations: Murmansk oblast, some regions of the republics of Karelia and Komi, Arkhangelsk oblast, Nenets and Yamalo-Nenets Autonomous districts, some regions in Krasnoyarsk krai and the Republic of Sakha (Yakutia), the Chukotka Autonomous District, as well as the continental lands and islands in the Arctic Ocean (Fig. 1).
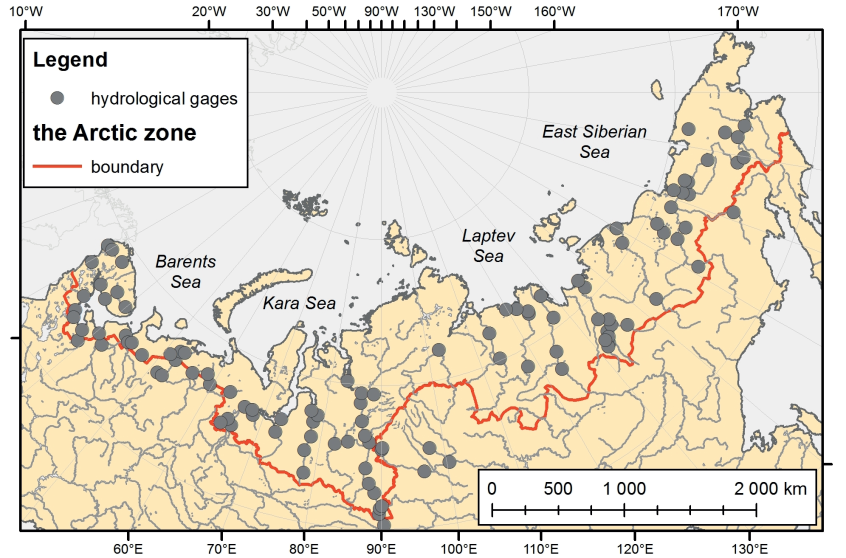
Fig. 1. The study area
The climate of the Arctic zone shows a long and severe winter and a short and cool summer. The length of the period with negative air temperature averages 200-230 days for the European sector and 240 days and more for the Asian part of the territory and the lower reaches of the Pechora. The mean temperature of January decreases from west to east from -10°C in Kola Peninsula to -30°C in Taimyr peninsula and to -40°C in the basins of the Lena, Yana, and Indigirka. The number of days with temperature below -30°C in the northeastern European part of the Arctic zone is 30 and that for the central regions of Siberia is 120. The annual precipitation varies from 200 mm on the coast of the East Siberian Sea to 500 mm in the European sector. Stable snow cover lies on the average 200-250 days per year. Permafrost is common for the Arctic zone of Russia; it is insular in Kola Peninsula, mostly discontinuous from Kanin Peninsula to the Urals and continuous in the Asian part (Alekseevsky 2007; Kasimov 2017).
The major rivers in the territory are the Northern Dvina, Pechora, Ob, Yenisei, Khatanga, Olenek, Lena, Yana, Indigirka, and Kolyma, which belong to the basin of the Arctic Ocean. The water regime shows a spring (or spring-summer) flood and a stable winter low-water period. In the northeastern part, the high summer-autumn floods can be caused by the melting of snow cover, glaciers, and high-mountain snowfields, aufeises, and underground ice (Frolova et al. 2018). Because of the severe natural conditions, the runoff of the winter low-water season in the drainage basins of the Laptev, East Siberian, and Chukchi seas is very low. Some large and medium northern rivers (the Anabar, Olenek, Yana, Alazeya, Palyavaam, Amguema, etc.) will freeze through in winter.
Many rivers in Kola Peninsula and Karelia are used to generate electric power. HPS chains have been constructed on the Niva, Kovda, Tuloma, Paz, Suna, Kem, Vyg, and other rivers (Magritsky 2008). In the lower pools of HPS, ice-related problem can be due to the formation of hanging ice dams and ice jams. Considerable level rises, caused by ice jams, lead to a decrease in electric power production, which makes it necessary to regulate the regime of releases and water temperature in the lower pools. During the operation of water intakes, the intensive formation of frazil ice leads to its deposition in water intake systems, freezing and clogging of grates (Shatalina et al. 2013; Beltaos 2013).
The arctic territory of Russia is a key region of the country producing raw materials. The transport infrastructure of the Arctic zone of Russia is poorly developed, especially in its Asian part. Water transport is used for both passenger and freight traffic. Navigable rivers are used every year for Northern Delivery of Freight, primarily, fuel, into hard- to-reach areas. In the Republic of Sakha (Yakutia), for example, the route of the Northern Delivery of Freight runs downstream the Lena River toward the mouths of the Khatanga, Anabar, Olenek, Yana, Indigirka, and Kolyma and further upstream these tributaries on shallow-draft vessels. In the lower reaches of large rivers (Northern Dvina, Mezen, Pechora, Khatanga, Yenisei, etc.), large seaports are in operation. Winter navigation is taking place in the lower reaches of the Northern Dvina (Arkhangelsk port) and the Yenisei (Dudinka port) (Nokelaynen 2019). The ice conditions for river navigation are determined not only by the period of possible summer navigation (i.e., the period of ice-free channel), but also variations of the dates of ice phenomena, the periods of freezing and clearing of ice. The early freeze- up can result in a forced wintering of ships in places not adequately equipped for this.
In winter, temporary ice bridges are constructed on the Northern Dvina, Pechora, Ob, Nadym, Yenisei, and Khatanga. In large cities occupying islands or both river banks, communication between the banks are preserved, where possible, in the transitional autumn and spring periods. For example, towboats with ice reinforcement are used for this in Arkhangelsk. Another feature of river crossings in Arkhangelsk is that they cross the channel of the Northern
Dvina with year-round navigation. InWestern Siberia, because of the high density of river network, 80% of the winter road Aksarka-Salemal-Panaevsk-Yar-Sale are ice bridges. In the Republic of Sakha (Yakutia), some segments of winter roads run along the channels of rivers or branches (as, for example, part of the winter road «Arktika» from Burustakh town on the federal road R504 Kolyma to Cherskii) (Plyusnin 2014). The bearing capacity of the ice cover depends on its thickness and structure. The operation of ice bridges becomes difficult during thaws and in the cases of disturbances of ice cover with the formation of fractures and holes.
By the early XX century, only general data, mostly of descriptive character, were available on the ice regime of the major arctic rivers of Russia. Active studies of this region started in the 1930s, mostly to meet the needs of the developing navigation through the Northern Sea Route. Among the present-day studies of the hazardous ice phenomena and processes in Arctic rivers, of interest are the works analyzing the formation of hazardous water levels in periods with ice phenomena, including those that form during ice jam formation (Magritsky 2013, 2017). Earlier, the authors have assessed the hazards of the ice regime in the European sector of the Russian Arctic zone (Agafonova et al. 2016). This article, generalizes the data on the ice regime and its hazardous manifestations for the entire Arctic zone and nearby territories.
The network of hydrological gages on rivers in the arctic region is sparse. Even at the peak of this network development in the 1980s, the researchers mentioned that its density is not satisfactory. After the 1980s, the network started rapidly declining: the number of gages on rivers had decreased by 43 and that of mouth gages, by 48%; as of January 1, 2018, the number of gages in operation in the rivers of the Arctic zone was 174, of which 58 were located at river mouths (Aari.ru 2018).
This study uses data of 100 gages, which have been operating for more than 50 years and have a drainage area of more than 5 000 km2 (Fig. 1). To improve the maps for rivers in Karelia and Kola Peninsula, data from eight gages with drainage areas from 2000 to 5000 km2 were also used. The collected data included the dates of ice phenomena (appearance of ice, freeze-up, break up, and clearance of ice), their duration (period with ice phenomena, ice cover period, autumn and spring ice run), the recurrence of jams, maximal water levels during spring ice run and jam formation, the maximal ice thickness since 1936 or from the start of observations until 2016. Gaps and short series were restored by the method of hydrological analogy with the use of data on gages on rivers with similar physiographic conditions and catchment characteristics. Earlier, the authors have proposed to characterize the hazardous phenomena in ice regime by the following parameters, derived from data of observations on hydrological gages: the duration of physical navigation (i.e., a period without ice phenomena), variations of dates of ice phenomena and the duration of the periods of freezing up and breakup, the recurrence of water flooding the floodplain in the period with ice phenomena, and the frequency of the years when a maximal annual water level is accompanied by ice phenomena (Agafonova et al. 2016). The characteristic of ice regime under current conditions is based on data averaged over the past 30 years (a period from 1987 to 2016). The time variability of ice characteristics was estimated for the period from 1936 to 2016. The study used statistical methods for the analysis of data with testing series for agreement with statistical hypotheses (at a significance level of α = 5%) with the use of Fisher's (F-test), Student's (t-test), Andersen's (t(A)), and Spearman's coefficient of rank correlation (Spearmen RCC or rs). The statistical treatment of data and the application of the above criteria followed the recommendations given in (Kalinin et al. 2014; Ginzburg 1992, 2005). When Fisher's and Student's test were used, the break year was chosen by successively trying all years, provided that each period was longer than 30 years.
The duration of the period with ice phenomena in the Arctic rivers varies, on the average, from 180 days for White Sea rivers to 260 days for northeastern rivers and rivers in the Taimyr Peninsula. The ice cover in the rivers is stable, the only exceptions being rapids, outlets from large lakes, and river segments in regions with specific hydrogeological conditions. Rivers do not freeze up in the zones near industrial wastewater discharge sites and downstream of HPS dams. The duration of the ice cover period varies over the area from 5 to 8.5 months. The periods with ice phenomena and ice cover in the Ob, Yenisei, Lena, and Kolyma rivers are somewhat shorter than the respective periods for the medium-size rivers. According to (Donchenko 1987), the effect of the drainage area on the shortening of these period can be seen at values in excess of 500 000 km2. For example, for the Ob River at Salekhard, the average duration of the physical navigation (i.e., the period when the river is free of ice) over 1987-2016 is 15 day longer than the zonal values, the same difference for the Lena River downstream of Zhigansk is 7 days (Fig. 2).
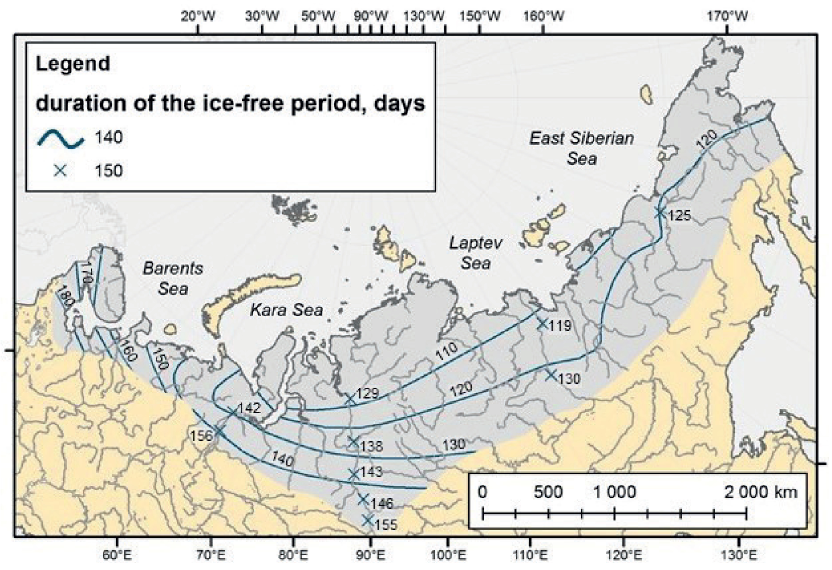
Fig. 2. Duration of the ice-free period (the average mean over 1987-2016)
The first ice phenomena appear, on the average, in late September in the rivers of Omolon, Malyi Anyui, in the upper part of the Yana River basin and in the Olenek River; in the rest part of the Asian Arctic sector, they appear by the middle October, and by late October-early November, they appear in the rivers of the southern White Sea coast. The freezing up of medium and large rivers is accompanied by autumn frazil and ice run. The variability of freeze-up dates determines the conditions of organization of operations on rivers - the long freezing periods reduce the period of possible operation of ice bridges. The average length of the freezing period in European rivers is about a fortnight, and that for Siberian rivers is 10 days. The average duration of the freezing period in rapid reaches of rivers in Karelia and Kola Peninsula is somewhat longer (for example, this period in the Varzuga River at Varzuga Village is 24 days long); in such river reaches hanging ice dams may occur all over the freeze-up period with water level rise reaching 3 m. The length of the freezing period in the Yenisei River varies from 6-7 (Karaul Vil., Dudinka City) to 35 days (Yartsevo Vil.). In the northwestern part of the territory, open water holes tens and hundreds kilometers in length can be seen, notwithstanding the low air temperature in winter. These holes are confined to the discharges of subpermafrost water through tectonic faults or under-bed taliks (Bol'shoi and Malyi Anyui, Omolon, etc.) (Arzhakova 2001). Aufeises can be seen in all rivers in the permafrost zone. They are of hazard to transport safety, as they clog the holes in artificial structures and cause inundation of railroads and motor roads on the nearby areas. River aufeises form at freezing up of rivers, at subsidence of ice cover under the pressure of snow or transport, at channel clogging by sediments or ice. The melting of aufeises can extend all over the warm season (Alekseev 1987).
In the majority of rivers in the Arctic zone, ice thickness is increasing throughout the ice cover period, reaching its maximal values in the last month of this period. The thickness of ice determines the loads onto the structures accompanying the thermal expansion of ice cover and changes in water level, as well as the dynamic loads during ice run and ice jam formation. Abrupt increases in ice thickness are due to water flowing over ice and freezing on it, as well as the formation of snow ice. A considerable increase in ice thickness in small rivers is often due to freezing of downstream river segments down to the bed and the absence of flow at the gage. A decrease in water flow in winter can cause the formation of ice consisting of several layers separated by spaces without water (sushnyak, sushchenets). The maximal ice thickness by the end of ice cover period vary in Kola Peninsula rivers from 0.5 in warm to 1.0 m in cold winters; the respective values in the Pechora are from 0.7 to 1.4 m. In the rivers of the Western Siberia, ice thickness for sections north of the polar circle can exceed 2.0 m; the rivers of the Yamal and Gydanskii peninsulas freeze through every year (e.g., the Shchuch'ya River at the villages of Labrovaya and Shchuch'ya remains frozen over up to 5 months). In the rivers of Eastern Siberia, ice thickness can reach over 3 m (the Lena River, the Bykovskaya Branch, p.st. Stolb: 3.35 on May 20, 1971 and 3.04 m on May 20, 1976). For rivers of the northeastern part of the territory, because of the diverse hydrogeological conditions, at the accumulated freezing degree days (AFDD) greater than 5000°C, the average ice thickness by the end of ice cover period varies from 0.8 m (the Enmyvaam (En'muveem) River-HMS En'muveem (Mukhomornoe V.) and the Bol'shoi Anyui River-HMS Konstantinovskaya) to 2.0 m and more (the Olenek River and the Yana River with tributaries).
The main rivers of the Russian Arctic zone flow in the general direction from the south toward the north at the direction of their debacle front movement from the upper to the lower reaches. The spring ice run in the majority of rivers is accompanied by high water levels, in particular, because of the formation of ice jams. The floods induced by ice-jams are especially hazardous because they take place in cold seasons and they are accompanied by ice moving onto the banks and destroying the structures located in the flooded zone. The losses caused by ice jams are commonly far in excess of those caused by floods in ice-free periods. In addition to the inundation of the territory and damage to hydroengineering structures, long-term jams hamper the removal of ice from the river, thus reducing the navigation period. Water level rises caused by ice jams and hanging ice dams downstream of HPS dams reduce electric power production (Kozlov 2015). The rivers of Karelia, and the Onega and Northern Dvina rivers break up on the average in the late April-early May; those of Kola Peninsula, in mid-May; and the lower reaches of the Pechora River, on May 20. In the rivers of Karelia and the southern coast of the White Sea, maximal annual water levels are accompanied by ice phenomena in half of cases or more; in the lower reaches of the Ponoi, Varzuga, Northern Dvina, Mezen, and Pechora rivers, this takes place in 70-80% of cases. Large ice jams with water level rise above 3 m form in the lower reaches of the rivers of Northern Dvina, Mezen, and Pechora. Note that now the regime of spring ice run and jam formation at the delta of the Northern Dvina is changed by the annual ice-breaking operations. In the lower reaches of the Mezen and Pechora, the recurrence of floodplain inundation during spring ice run is 90% and more. In the rivers of Kola Peninsula and Karelia, water level rise at the formation of jams most often does not increase 0.5-1.0 m. The only exception is the Varzuga gage on the Varzuga River, where jam-induced water level rises can reach 3 m and more (as, for example, in 1999 and 2013). In rivers of the Belomorsko-Kuloiskoe Plateau (the Kotuga, Kepina, and Kuloi rivers), no spring ice run takes place, and maximal water levels pass after their clearing of ice (Figs. 3 and 4).
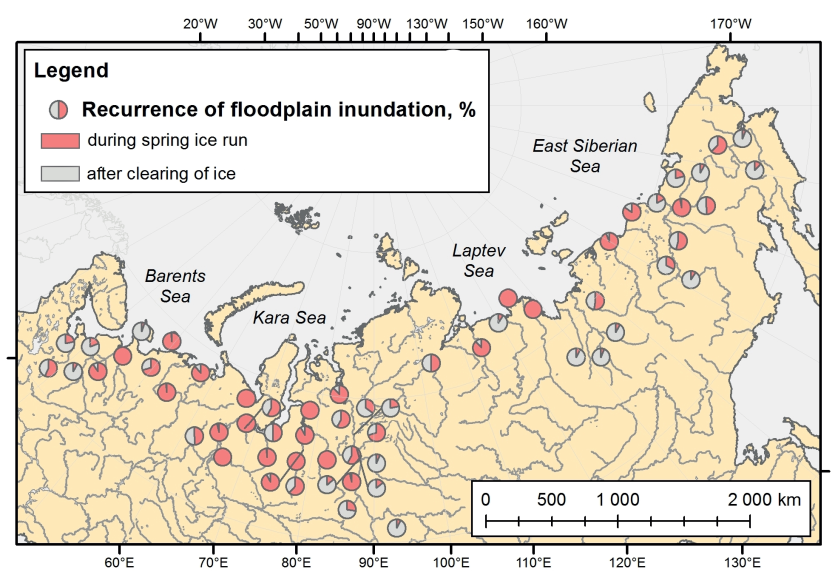
Fig. 3. Recurrence of floodplain inundation during spring ice run
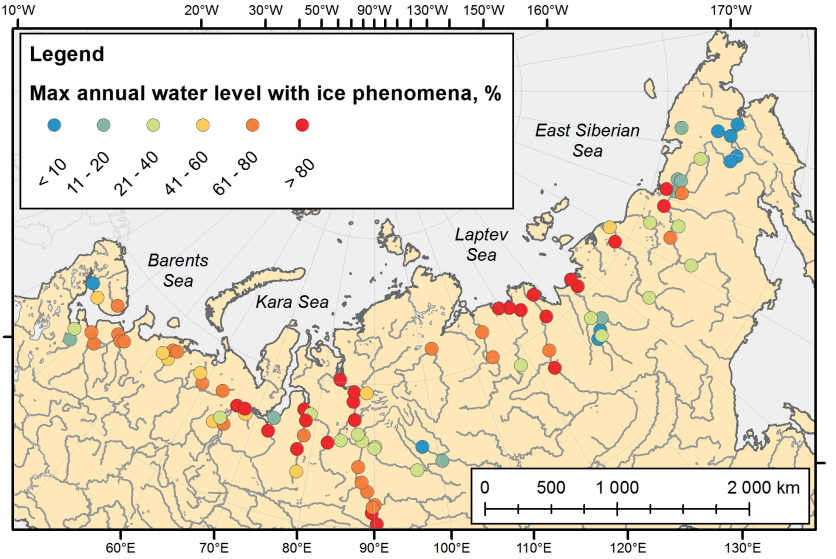
Fig. 4. Recurrence of the passage of peak water levels in periods with ice phenomena
The spring ice run in the Ob River upstream of Salekhard City begins on the average in the mid-May, while the lower reaches of the Pur and Taz rivers break up in early June. Because of the high swampiness of the area, the break up period in the river is extended and the ice is far less strong at the beginning of ice run. The jam-induced water levels never exceed 1-2 m, the duration of the spring ice run in the Nadym, Pur, and Taz rivers and in the Lower Ob is 3-5 days. The duration of the spring ice run in the Polar Ural rivers is somewhat longer (in the rivers of Shchuch'ya and Sob it lasts for 7-10 days). The maximal annual water levels for most rivers in the territory were recorded during spring flood (in late May-early June). The recurrence of floodplain inundation during spring ice run for medium and large rivers is 90-100%. For such rivers (the Ob, Nadym, Pur, and Taz), maximal annual water levels coincide with ice phenomena in 80-90% of cases, while in the rest 10-20%, maximal levels are recorded in the first week after it becomes free of ice.
The average date of the start of spring ice run along the Yenisei River varies from May 5 at Yartsevo Village to June 9 (Karaul Village), and the average date of the passage of maximal annual water level varies from April 21 to June 9, respectively. The duration of the spring ice run in the Yenisei River in the Arctic zone of Russia decreases downstream from 13 to 5 days. Ice jams form every year during spring ice run. The depth of floodplain inundation at the formation of large jams reaches 6.5 m near Dudinka City (1999) and 3.7 m near Igarka City (1999 and 2001). In this case, the recurrence of water levels above critical marks is not high - the most recent flood in Dudinka City was recorded in 1999.
In the late May-early June, spring ice run passes in the Lena River downstream of Zhigansk Village. A characteristic feature of ice run in the lower Lena is the simultaneous break up of long river reaches and the formation of large ice jams, which stop the propagation of break up for up to 5 days. According to (Buzin 2015), the length of ice jams in the lower part of the river is up to 150 km. The rivers that break up in the late May are the Yana (in the segment Verkhoyansk City- polar base Yubileinaya), Kolyma (Srednekolymsk C.-Kolymskoe V.), Bol'shoi and Malyi Anyui, and Anadyr; those that break up in early June are the Olenek, Indigirka (Chokurdakh V.), and Alazeya. No ice run takes place in the reaches that freeze through or where ice is thick (the ice here melts on the site). In the medium and large rivers in Eastern Siberia, the spring ice run is taking place at high water level. In the lower reaches of the Olenek, Lena, and Yana rivers, annual maximums of water level occur during spring ice run in 90% of years or more. The jam-induced level rises in the Yana, Indigirka, and Kolyma reach 5 m. In Srednekolymsk T., water levels during ice run in the recent 30 years are in excess of the critical level in 40% of cases; the latest floods during break up were recorded in this river reach in 2012 and 2013. In the upper reaches of the Yana, Indigirka, and Kolyma and in the northeastern part of the territory, maximal annual water levels occur after clearing of ice in the period of summer-autumn rain floods.
The time variations of the dates and duration of ice phenomena in Arctic zone rivers show regularities of the spatial distribution that are common for all ice characteristics. The least values of the root-mean-square deviation are recorded in East Siberian rivers and the largest, in the rivers of the southern coast of the White Sea, and the rivers of Karelia and Kola Peninsula. In the European Sector of the Arctic, the root-mean-square deviation of the dates of ice appearance is less than that of the freeze-up. In the Asian sector of the Russian Arctic zone, the variations of the autumn dates differ only slightly. The root-mean- square deviation of ice appearance in the European sector of the Russian Arctic zone is 10-12 days, and that of freeze- up dates varies from 12 days for the Pechora to 14-16 days for the rivers of Karelia and Kola Peninsula. For the major portion of the Asian sector, variation in the autumn dates of ice phenomena is 5-7 days. The dates of debacle and clearance of ice are interrelated and have the same values of root-mean-square deviation: 7-10 days for the European sector, 7-8 days for the Western Siberia and the Yenisei, and 5-6 days for the Eastern Siberia and Northeast within the Russian Arctic zone.
Studying the observed changes in the hydrological regime of rivers, including ice regime, is the focus of considerable recent attention. Under the project SWIPA (Snow, Water, Ice, Permafrost in the Arctic) of the Arctic Council, an international group of scientists in 2008-2011 generalized the main results of studying changes in the ice regime of Arctic rivers and the effects of these changes. This project was a continuation of ACIA Program (Arctic Climate Impact Assessment), the results of which were published in 2005. In the article (Prowse et al. 2011) the authors reveal a displacement of ice phenomena dates and correlate these changes with the global atmospheric processes. The main present-day features of Arctic climate changes are given in (Barros et al.2014). The ice characteristics of rivers change with changes in climate conditions and water regime. The article characterizes variations in ice characteristics over period from 1936 to 2016. The data on the northeastern part of the territory are too scarce to determine variations in ice characteristics over a long period. The data contain gaps, which cannot be filled because of the lack of analogues. In fact, only data from the gage at Srednekolymsk Town on the Kolyma River are available for filling the gaps.
Analysis of the series of ice phenomena dates with the use of Anderson test showed the violation of independence only for individual gages: the autumn dates of ice appearance in the Yenisei River (in the zone of influence of runoff regulation) and the Kolyma River at Srednekolymsk City; and the spring dates in the rivers of Kola Peninsula and the lower Onega River.
In the northern European Russia, including the rivers of Kola Peninsula and Karelia, changes in the dates of ice appearance are 5-6 days for the major portion of the territory and 9-11 days for the Onega and southern Karelia. The shift of the freeze-up dates at most gages is somewhat greater (by 1-2 days) than that for ice appearance. Changes in ice appearance dates are statistically significant for the Onega River since the mid-1970s; the freeze-up dates show no statistically significant trend (by Spearman's test). The shift of the break up toward earlier dates is 6-8 days. Changes in the mean values have been statistically significant since 1972-1973 for all rivers, except for the Pechora tributaries (the Sula and Tsil'ma rivers). According to (Agafonova et al. 2007, 2009), the earlier break up of rivers in the Northern European Russia was accompanied in the recent years by low water discharges and the formation of long-term jams. This results in a smaller shift of the dates of clearance of ice (by 4-6 days toward earlier times). The longer clearance of ice reduces the navigation period not only in medium and small rivers, but also in the segments of branching in large rivers.
In West Siberian rivers within the Arctic zone of Russia, the shifts of ice appearance and freeze-up dates coincide and amount to 4-6 days toward later time; the shift of the spring dates is 6-7 days toward earlier time. The observed changes in the dates are more pronounced at the gage the Ob River-Salekhard (where the ice cover period is of particular importance because of the operation of the Labytnangi-Salekhard ice bridge) and are not observed further upstream; the shift of the average dates of ice appearance and break up are statistically significant since 1975 and 1972, respectively. At other gages, the analysis of the series with the use of Spearman coefficient of rank correlation showed that there is no statistically significant trend in any date of ice phenomena.
In the recent years, the shift of the autumn dates of ice phenomena (the appearance of ice and freeze up) toward later dates decreases along the Yenisei from Yartsevo V. to Igarka C. These changes are caused by both climatic and anthropogenic factors. Yenisei runoff regulation had its effect, primarily, on the freeze-up dates: the shift of freeze- up dates after 1963 in the segment from Yartsevo V. to Podkamennaya Tunguska V. varied from 11 to 5 days, in the downstream reach, the dates in these years did not change. In addition, runoff regulation has caused a considerable disturbance in the homogeneity of freeze-up dates in terms of variance. The breakup dates shift toward earlier times by 2-4 days for gages from Yartsevo V. to Selivanikha V. and by 5-7 days further downstream. For the gages on the Nizhnyaya Tunguska R., the autumn dates of ice phenomena changed by 2-3 days, and the spring dates, by 4-5 days. Changes in the breakup dates are statistically significant for Potapovo V., Dudinka C., and gages on the Nizhnyaya Tunguska R. since 1980.
In the rivers of Eastern Siberia, the changes in the dates of ice phenomena do not exceed 2-3 days with appreciable changes having been observed since the early 2000s. The only exception is the Olenek R.: the dates of ice appearance and break up at the gages of Sukhana HMS and Tyumeti polar base shifted by 5 days. A statistically significant trend is typical of the series of spring dates of ice phenomena at gages on the Lena R. (Zhigansk V., Dzhardzhan HMS, and Kyusyur V.). The dates of ice phenomena in the Kolyma R. at Srednekolymsk T. change, in particular, because of runoff regulation by a chain of HPSs (the Kolymskaya HPS since 1982 and the Ust-Srednekanskaya HPSsince 2013); the shift of the dates is 3-4 days toward later times for autumn phenomena and 3 days toward earlier times for spring phenomena. The observed trends are statistically significant. Because of the lack of analogs, the changes in ice characteristics of rivers east of the Kolyma R. were evaluated with the use of data since 1957. In the Omoloi and Malyi and Bol'shoi Anyui rivers, the shift of ice phenomena does not exceed 2 days, and that for the Anadyr R. does not exceed 4-6 days toward later times for autumn phenomena and ~4 days toward earlier times for spring phenomena.
The decrease in the ice cover duration and the period with ice phenomena shows some spatial regularities, which are difficult to map because of the sparse gage network, but which can be expressed in terms of a dependence on the longitude. The changes are more pronounced for the European sector (up to 10-12 days for ice cover duration) and decrease eastward (they do not exceed 2-3 days for East Siberian rivers) (Fig. 5).
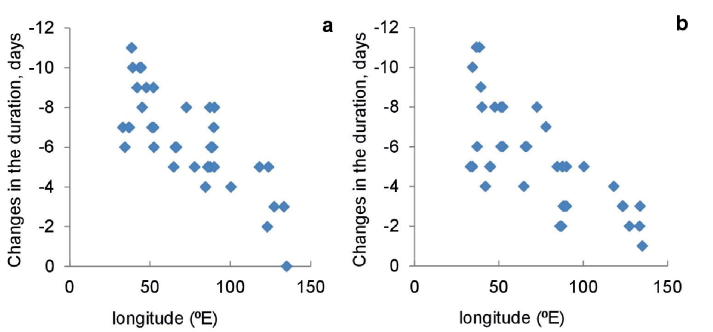
Fig. 5. Changes in the duration of ice cover (a) and ice phenomena (b) after 1987
The observed decrease in the accumulated freezing degree days (AFDD) in winter does not lead to a considerable decrease in ice thickness in the major portion of the territory. The ice thickness in Siberian rivers sometimes reaches maximal values by the middle of the ice cover period, and the further accumulation of the accumulated freezing degree days (AFDD) has no effect on the maximal ice thickness. The result is that the change in ice thickness in East Siberian rivers does not exceed 5 cm, it can reach up to 10 cm in other Siberian rivers and the large rivers of European north, and it is only in Karelian rivers that it can increase to 10-15 cm. Changes in the temperature regime in winter, i.e., frequent thaws, may have an effect on ice cover structure in the rivers of European Arctic sector. The long freeze-up periods along with ice-holes contribute to the formation of a large amount of frazil ice and sludge. After winter breakups the ice cover is often hummocky. Slush ice with water interlayers becomes more and more frequent in the ice structure. The changes in the characteristics of ice strength by the end of winter in the rivers of northern European Russia change the passage conditions of spring ice run in the lower reaches of the Onega, Northern Dvina, Mezen, and Pechora. It is worth mentioning that winter breakups are still few even in the European Arctic zone. For example, in winter of 20152016, long reaches of hummocky ice cover formed in the Northern Dvina basin with slush under ice in the upper and middle parts of the basin. In the spring of 2016, a jam formed in the Northern Dvina delta, which required the use of icebreakers to destroy.
In the recent years, the maximal ice-run water levels in the rivers of the European sector, West Siberia, and Northeastern territory showed a tendency toward a decrease. At the same time, the recurrence of floodplain inundation during spring flood remains constant for most rivers (Fig. 6). The frequency of ice jam has not changed. In addition, there still is a hazard of formation of large jams with jam-induced floods. In the rivers of the European part, this is facilitated by the special conditioins of freezing and winter breakups of rivers, as shown by various studies (Buzin et al. 2014; Agafonova et al. 2017).
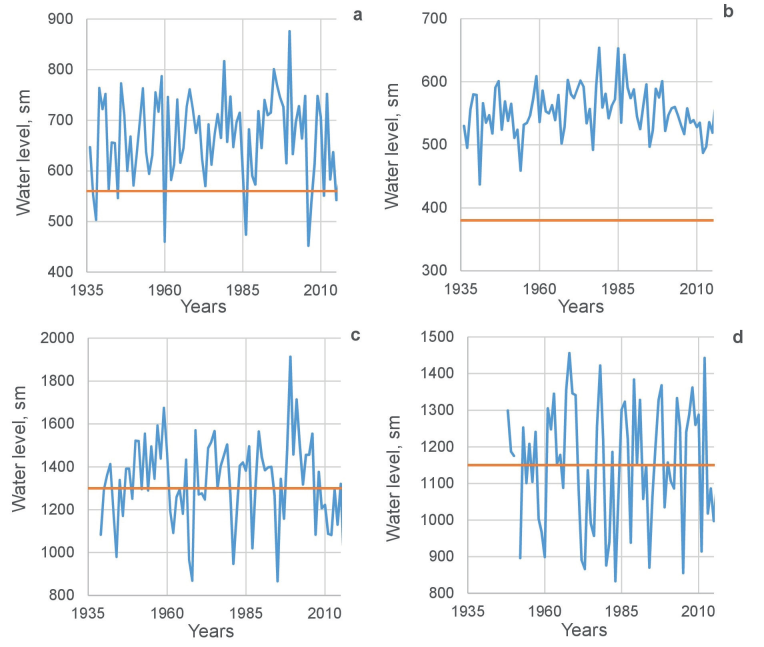
Fig. 6. Maximal ice-run water levels. (a) Mezen-Dorogorskaya, (b) Ob-Salekhard, (c) Yenisei-Dudinka, (d) Yana-Jubilejnaja (red line - level of floodplain)
Observation data from 100 hydrological gages in the Arctic zone of Russia over the past 30 years (since 1987 to 2016) were used to characterize the present-day ice regime and its hazardous manifestations. Periods with ice phenomena and ice cover last for the major portion of the year and average from 180 (150) days in Karelian rivers to 260 (250) days in the rivers of the northern East Siberia. The Ob, Yenisei, Lena, and Kolyma show the duration of ice phenomena somewhat shorter than the characteristic zonal values (by 15 days for the Lower Ob and by 7 days for the Lower Lena). The first ice phenomena appear, on the average, in late September in the rivers of Kolyma and Yana. The average duration of the freeze-up period in European rivers is about 2 weeks, and that for Siberian rivers is 10 days. Along the Yenisei, the duration of freezing varies from 6-7 (Karaul V., Dudinka C.) to 35 days (Yartsevo V.). The late dates of freeze-up reduce the operation periods of ice bridges, and the long freeze-up periods imply the formation of frazil ice and slush. In the river reaches with rapids in Karelia and Kola Peninsula, hanging ice dams can occur all over the ice cover period and cause water level rises up to 3 m.
In the majority of rivers in the Arctic zone, ice thickness increases all over the ice cover period, reaching its maximal values in the last month of the ice cover period. The maximal ice thickness averages ~1.0 m for the Pechora and up to 2.0 m and more for rivers in Western and Middle Siberia; it can exceed 3.0 m in some years in the Lena R. and in the upper parts of the Yana Basin. In the rivers of the northwest of the territory, because of the diversity of hydrogeological conditions, at the values of the accumulated freezing degree days (AFDD) greater than 5000°C, the average ice thickness by the end of ice cover period can vary from ~0.8 m to more than 2 m. The thickness and structure of ice cover on the rivers determines the carrying capacity of ice bridges and characterizes the ice load onto the hydroengineering structures during spring ice run.
The major rivers in the Arctic zone of Russia flow in a general direction from the south to the north with the direction of breakup front propagation from the upper to the lower reaches. The breakup of rivers is accompanied by the formation of ice jams, high water levels, and inundation of the floodplain. The damage caused by ice jams is commonly much larger than that of floods during ice-free period. In addition to inundation of the territory and damage to hydroengineering structures, long-term jams hamper the removal of ice and reduce the navigation period. In the rivers of the Northern European Russia, maximal annual water levels are accompanied by ice phenomena in 70% of cases, while in large Siberian rivers, this share can reach 100%. The large populated localities suffering inundation during spring ice run include Arkhangelsk (Northern Dvina R.), Nar'yan-Mar (Pechora R.), Salekhard (Ob R.), Nadym (Nadym R.), Igarka and Dudinka (Yenisei R.), and Srednekolymsk (Kolyma R.).
The time variations of the dates and duration of ice phenomena in the rivers of the Arctic zone characterize the conditions of navigation planning and organization in a river. The least root-mean-square deviations are typical of rivers in Eastern Siberia (from 4 days for autumn dates and from 5 days for spring dates); and their largest values, of the rivers of the southern coast of the White Sea, and the rivers of Karelia and Kola Peninsula (14-16 days for freeze-up dates). The high variability of the dates of ice appearance and breakup requires the development of methods for ice forecasts for navigable segments of rivers.
The hazardous ice phenomena that take place in Arctic rivers largely restrict the development of water economy in territories and determine the conditions of economic development of the territory and the living conditions for the population. The result is that the economic activity mostly develops in the regions where it is economically sound. Changes in ice regime characteristics can cause new ice-related problems: a considerable reduction of the operation period of ice bridges, destructive ice jam- induced floods in winter, disturbance of water intake operations because of the excessive formation of slush, frazil ice, etc.
The observed changes in the dates and duration of ice phenomena in Arctic rivers in the period from 1936 to 2016 have taken place under the effect of natural and anthropogenic factors. In the rivers of the European north and West Siberia, statistically significant shifts of the dates of ice phenomena have been observed since the early 1970s. The decrease in the ice cover period and the period with ice phenomena over the past 30 years varies from 6 days for the Ob to 10-12 days for the Onega, Mezen, and Varzuga rivers. The shift of the autumn dates of ice phenomena toward later times decreases along the Yenisei from Yartsevo V. to Igarka C. The effect of runoff regulation in the Yenisei R. can be seen primarily in the freeze-up dates: after 1963, the change varied from 11 to 5 days in the river segment from Yartsevo V. to Podkamennaya Tunguska V. and from 5 to 7 days further downstream. In the rivers of Eastern Siberia, the shift of the dates of ice phenomena can be seen only since the early 2000s.
Notwithstanding the recent trends toward a decrease in the maximal ice-run water levels in rivers of the European sector, Western Siberia, and the northeastern part of the territory, the recurrence of flood inundation during spring ice run keeps constant in most river segments. The changed autumn-winter conditions of ice cover formation in rivers contribute to the preservation of the high recurrence of hazardous ice jams in the European sector of the Arctic. The recurrence of ice jams in Siberian rivers shows almost no changes.
1. Aari.ru. (2018). Review of the state and operation of the hydrological network in the Arctic zone of the Russian Federation, including river mouths for 2017. [online] Available at: www.aari.ru/dept/science/hydrology/review2017.pdf [Accessed 20 Dec.2018] (in Russian).
2. Agafonova S., Frolova N. (2007). Specific features of ice regime in rivers of the Northern Dvina basin. Water Resources, 34(2), 123-131, DOI: 10.1134/S0097807807020029.
3. Agafonova S., Frolova N. (2009). Influence of ice regime of the northern rivers of European Russia on the hydroecological safety under the climate changes. Bulletin of the Moscow University. Geography. 4, 55-61. (in Russian with English summary).
4. Agafonova S., Frolova N., Krylenko I., Sazonov A., Golovlev P. (2017). Dangerous ice phenomena on the lowland rivers of European Russia. Natural Hazards. 88, 171-188, DOI: 10.1007/s11069-016-2580-x.
5. Agafonova S., Frolova N., Vasilenko A., Shirocova V. (2016). Ice regime and dangerous hydrological phenomena on rivers of the Arctic zone of European Russia. Bulletin of the Moscow University. Geography. 6, 41-48. (in Russian with English summary).
6. Alekseev V. (1987). Aufeis. Novosibirsk: Nauka (in Russian).
7. Alekseevsky N. (ed) (2007). Geoecological state of the Arctic coast of Russia and safety of environmental management. Moscow: GEOS (in Russian).
8. Arzhakova S. (2001). The winter flow of the rivers of the permafrost zone of Russia. St. Petersburg: Gidrometeoizdat (in Russian).
9. Barros V., Field C., Dokken D. et al (eds.) (2014). IPCC: climate change 2014: impacts, adaptation, and vulnerability. Part B: Regional aspects. Contribution of working group II to the fifth assessment report of the intergovernmental panel on climate change. Cambridge University Press, Cambridge, United Kingdom and NewYork.
10. Beltaos S. (2013). River ice formation. Edmonton: Committee on River Ice Processes and the Environment, Canadian Geophysical Union Hydrology Section.
11. Buzin V. (2015). Hanging ice dams and ice jams on the rivers of Russia. St. Petersburg: GGI. (in Russian).
12. Buzin V., Goroshkova N., Strizhenok A. (2014). Maximum ice-jam water levels on the northern rivers of Russia under conditions of climate change and anthropogenic impact on the ice jamming process. Russian Meteorology and Hydrology. 39(12), 823-827, DOI: 10.3103/S1068373914120061.
13. Donchenko R. (1987). The ice regime of the rivers of the USSR. Leningrad Gidrometeoizdat (in Russian).
14. Frolova N., Magritsky D., Kireeva M., Agafonova S., Povalishnikova E. (2018). Anthropogenic and climate-related changes in water flow and ice phenomena in Russian Arctic rivers. Geography issues. 145, 233-251. (in Russian).
15. Ginzburg B. (2005). River freeze-up and breakup dates in the late 20th century and their possible changes in the 21st century. Russian meteorology and hydrology, 12, 65-72.
16. Ginzburg B., Polyakova K., Soldatova I. (1992). Secular changes in dates of ice formation on rivers and their relationship with climate change. Soviet meteorology and hydrology, 12, 57-64.
17. Kalinin V., Chichagov V. (2014). Long-term variability of ice formation dates on the rivers of the Votkinsk reservoir catchment. Russian meteorology and hydrology. 39(7), 491-497, DOI: 10.3103/S1068373914070085.
18. Kasimov N. (ed) (2017). National Atlas of the Arctic. Moscow: Roscartography (in Russian).
19. Kozlov D. (ed) (2015). Dangerous ice phenomena on rivers and water reservoirs of Russia. Moscow: RGAU–MSHA (in Russian). Kremlin.ru (2019). Decree of the President of the Russian Federation No. 296 of 02.05.2014. On the land territories of the Arctic zone of the Russian Federation [online] Available at: www.kremlin.ru/acts/bank/38377 [Accessed 20 Dec.2019] (in Russian).
20. Magritskii D. (2008). Anthropogenic impact on the runoff of Russian rivers emptying into the arctic ocean. Water Resources. 35(1), 1-14, DOI: 10.1134/S0097807808010016.
21. Magritsky D., Lebedeva S., Polonsky V., Skripnik E. (2013). Journal of geographical institute «Jovan Cvijic», 63(3), 133-145, DOI: 10.2298/IJGI1303133M.
22. Magritsky D., Lebedeva S., Skripnik E. (2017). Hydrological hazards at mouths of the Northern Dvina and the Pechora rivers, Russian Federation. Natural Hazards. 88(1), 149-170, DOI: 10.1007/s11069-016-2673-6.
23. Nokelaynen T. (2019). Mapping the navigation conditions of arctic rivers of Russia. Intermap. Intergis, 25(2), 175-185. (in Russian with English summary), DOI: 10.35595/2414-9179-2019-2-25-175-185.
24. Plyusnin V. (ed) (2014). Geography of Siberia in the Early 21st Century. Vol. 3. Economy and Population of Siberia. Novosibirsk: GEO (in Russian).
25. Prowse T.D., Alfredsen K., Beltaos S., Bonsal B.R., Duguay C., Korhola A., McNamara J., Pienitz R., et al. (2011). Past and future changes in Arctic lake and river ice. AMBIO A Journal of the Human Environment, 40, 53-62, DOI: 10.1007/s13280-011-0216-7.
26. Shatalina I., Tregub G. (2013). Ice problems of construction and operation of hydraulic structures. St. Petersburg: VNIIG. (in Russian).
Faculty of Geography
Leninskie Gory 1, 119991, Moscow
Faculty of Geography
Leninskie Gory 1, 119991, Moscow
Agafonova S.A., Vasilenko A.N. Hazardous Ice Phenomena In Rivers Of The Russian Arctic Zone Under Current Climate Conditions And The Safety Of Water Use. GEOGRAPHY, ENVIRONMENT, SUSTAINABILITY. 2020;13(2):43-51. https://doi.org/10.24057/2071-9388-2020-12

Editor-in-Chief
Kasimov Nikolay S.Lomonosov Moscow State University
Moscow 119991 Russia, Leninskie Gory, Faculty of Geography, 1806a
Phone +7 495 939-15-52
E-mail: ges-journal@geogr.msu.ru


