


Contents
Scroll to:
https://doi.org/10.24057/2071-9388-2018-73
Scroll to:
Al-Husban Yu., Ayen A. The Impact Of The Syrian Civil War On Land Use / Land Cover In Al-Yarmouk Basin During 2010–2018. GEOGRAPHY, ENVIRONMENT, SUSTAINABILITY. 2020;13(2):147-153. https://doi.org/10.24057/2071-9388-2018-73
Jordan has not only suffered from limited water resources and high population growth and it is classified as the most Arab countries that suffers from water scarcity in the region (Haddadin 2001); But Jordan was a heaven for migrations, especially from Palestine, Iraq, and finally from Syria as a result of the Syrian civil war. (YB) is the biggest and the most important in terms of river in Jordan and it suffering from drought (Al-Dardoor et al. 2013; Alsharifa et al. 2018; Gleick 2014). Since 2011, more than 660,935 of refugees have migrated southward to Jordan to escape the Syrian civil war that began in mid-2011 (UNHCR 2018; Francis 2015). (YB) which is a branch of the - Jordan River watershed - shared by Syria, Jordan, and Israel; these countries are in a state of conflict over water sharing, especially between Jordan and, Israel (Comair et al. 2012; Shamir 1998; Tose et al. 2000; Haddadin 2009; Haddadin 2001; Rosenberg 2006; Al- Husban 2013). LULC analysis is important for agricultural planning, environmental studies, and drought monitoring (Anderson et al. 1976). LULC change detection is essential for understanding of landscape dynamic patterns within a specified period for sustainable management. Around the world, many researches focus on LULC changes using remote sensing data. (Kwarteng, et al. 1997; Khawaldah 2016; Al-Bilbisi 2012; Rawat and Kumar 2015). This paper is based on two years of satellite data represents 2010, and 2018 to calculate LULC and NDVI changes, in (YB). We found that the LULC classified into four different classes namely; water bodies, barren area, vegetated area and built-up area. Normalized difference vegetation index NDVI have been used for analysis of change detection in many studies to distinguish between the vegetated area and non-vegetat- ed areas (Singh, et al. 1989; Al-Husban 2019; Al-Husban and Zghoul 2017; Al-Husban and Almanasyeh 2017). On the other hand, rainfall is an important factor affecting, and indicator for drought conditions (Al-Husban 2013; Al-Husban and Makhamreh 2013), for that changes in the mean annual rainfall from the 12 meteorological stations located within the (YB) during the study period was analyzed using linear regression to test if there is a trend in the pattern of mean annual rainfall (increase/decrease or no trend).
Jordan is one of the countries most affected by the Syria crisis, with the second highest share of refugees compared to its population in the world, 89 refugees per 1,000 inhabitants Individuals. 527,803 of them live in Urban. The total number of Syrian refugees in Jordan by end of March 2018 is 660,935 (UNHCR 2018). YB is represents the borders of Syria, Jordan and Israel joins to the Holly Jordan River (HJR). The northern portion of the Yarmouk River is the boundary between Jordan and Syria, and the southern portion is the boundary between Jordan and Israel. The total catchment area of the river measures 6,790 km2, of which 1,406 km2 about (20.7%) from the total area Locate within Jordan, and the rest within Syria, and Israel. YB located between 32°20'N to 32°46'N and 35°50E to 36°20' Fig. 1. The topography of the study area is varied in terms of the elevation from 1146 m above mean Sea level (a.m.s.l) in the upper part, down to 222 m below mean Sea level (b.m.s.l) at its mouth; about 7% is classified as low land, while 64.8 % from the total area has elevation between 470 and 799 m. With respect to the slope, about 50.6% from the total area is flat and gently sloping, and only 2.5% is represents ridges. YB is hydrologically important; where the average of rainfall on its basin up to 400 mm / annually in the upper part of basin drop to 250 mm/annually at the lower part (ministry of water and irrigation 2017) and, as it is form the second major surface water resources, after the Jordan River, as the basin adjacent mountain areas and heights (Ajlun Mountains and Golan Heights (that stand at more than 1146 m) above sea level are the highest uplands to the east of the Jordan Rift Valley; and these areas receive the highest rainfall in the country (Alsharifa et al. 2018). The annual historical water discharge decreased from 467 MCM, to 14 MCM during the last few decades, As a result of the historical water conflict between Jordan, Syria, and Israel, since these all these countries are suffering from water resources scarcity, particularly Jordan In addition to the Population growth, immigration and refugees, (Alsharifa et al. 2018). Currently Syrian civil war, with the scarcity of water resources; more than 660,935 of refugees have migrated to Jordan, and this is an emergency circumstance, forced the Jordanian government to complete the Disi Water Conveyance Project from the non-renewable Disi aquifer in 2013 over a distance of about 325 km from the Southern to the Northern of Jordan, to meet the needs of drinking and domestic use, (Ferra- gina and Greco 2008).
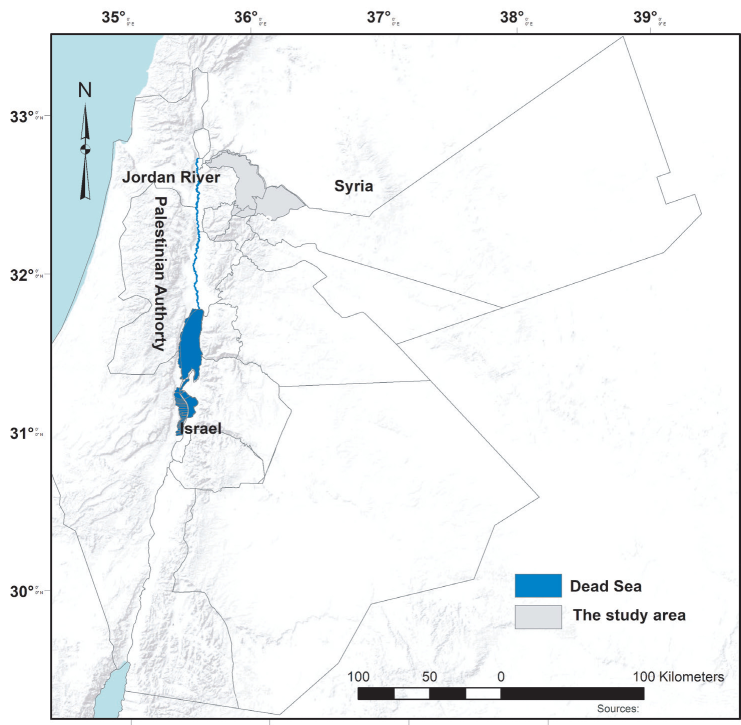
Fig. 1. The location of the Study area and the Riparian Countries
The LULC maps were extracted for detecting different changes in LULC during the tow selected years; 2010 and 2018. In order to achieve this goal, Satellite images of Land- sat 5 and Landsat 8-OLI were acquired from USGS website www.glovis.usgs.gov (USGS 2019).
The Landsat TM and OIL were prepared by using different pre-processing techniques to create LULC maps for the years of 2010 and 2018. The visible and NIR bands were combined to create layer stacking using ArcMap software, after that the Landsat were geometrically corrected using distinct ground features such as road crossing, then the Landsat images were mosaicked, subset and clipped to the borders of the (YB) (Farhan and Al-Bakr, 2012; AL-Taani et al. 2020).
Based on reconnaissance surveys and additional information of the study area, the LULC was generated using different image processing and GIS functions for assessing its recent changes. The medium ground resolution with 30 meter of satellite images for the years of 2010 and 2018 were processed using ArcMap for mapping LULC by using an on-screen digitizing procedure of different Landsat images overlaid by the boundary of (YB) as a shape file. Four classes of LULC classification were identified as shown in Table 1.
Table 1. Grouping of the East Eurasia countries and regions according to their economic potential and growth rate (according to data for 2018)
LULC classes | Description | Area (kmh) 2010 | Percentage (%) 2010 | Area (kmh) 2018 | Percentage (%) 2018 | Changes (2010-2018) % |
|---|---|---|---|---|---|---|
Water bodies | Al-Wehda dam | 2.7 | 0.2 | 1.968 | 0.14 | -0.08 |
Bare area | Barren or sparsely vegetated areas and bare soil. | 905.3 | 64.4 | 1052 | 74.82 | +8.42 |
vegetation | Irrigated lands and forested areas | 361.3 | 25.7 | 192.4 | 13.68 | -12.02 |
Built -up area | Includes all residential, commercial, and industrial development | 136.7 | 9.7 | 160.1 | 11.39 | 1.69 |
Total |
| 1,406 | 100.0 | 1,406 | 100.00 |
|
The visible and NIR bands were combined to create layer stacking using ArcMap software, after that the Landsat were geometrically corrected using distinct ground features such as road crossing, then the Landsat images were mosaicked, subset and clipped to the borders of the (YB).The digitizing technique was carried out to generate polygons by inclosing areas of different LULC types, such as built-up areas with specific boundaries, then, a new part of LULC was created and added as layers as input in ArcMap software. The new layer represents different types of LULC such as vegetated areas .Field surveys were executed during the study and supported with GPS to verify and correct results of recent LULC map (Farhan and Al-Bakri 2012).
NDVI: the red and near infrared bands were used to compute the NDVI for both dates (2010 and 2018). Using (Eq.1) (Rouse et al. 1974, USGS 20103; Signals 2012):
NDVI = [(NIR-Red)/(NIR+Red)] (1)
where, Near Infra Red (NIR) is the band 5 for the both images, and Red is band 4 for both images. The NDVI maps were reclassified at NDVI thresholds value ≥ .0.1 to separate the vegetation from the non-vegetation areas based on a threshold determined using raster calculator. The two NDVI layers were used to analyze the vegetation expansion changes and to calculate the changes of the vegetated areas.
NDVI changes between 2010 and 2018 was calculated applying (2018-2010).Both of the NDVI values exacted at value ≤ 0.1 value represent non-vegetated area, while NDVI values ≥ 0.1 represent vegetated area, Fig. 2.
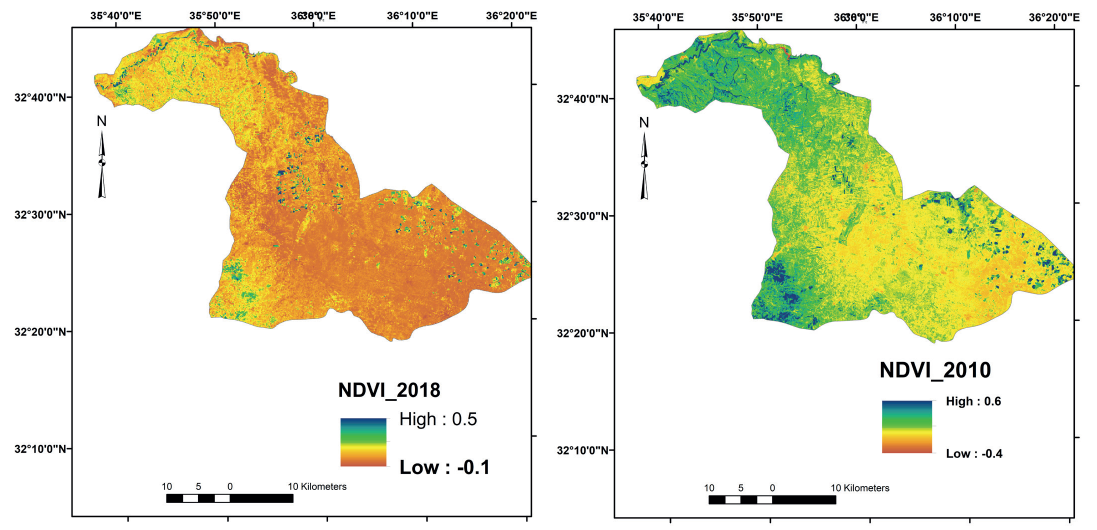
Fig. 2. NDVI variation in the study area in 2010 and 2018
IDW and Linear regression; the mean annual rainfall data from 12 meteorological stations distributed within the study area, was summarized into hydrological year. Hydrological year used in this study starts from January to December (rainy months). The hydrological year rainfall of all stations were calculated for the years (2010-2017). Then Surface Interpolation Method was applied to convert the point data, which represents the twelve meteorological stations, into spatial surface (Al-Husban 2017). Inverse Distance Weighting (IDW) was applied in this study.
NDVI is an index based on spectral reflectance of the ground surface feature. Each feature has its own characteristic reflectance varying according to the wavelength (USGS 2000). NDVI value ranges between -1 to +1. A Higher value of NDVI infers the presence of healthy vegetation in the area while its lower value is the indicator of sparse vegetation. The NDVI value calculated from Landsat satellite image of the year 2010 ranges from 0.60 to -0.4. The upper part of the area having higher NDVI value belongs to the irrigated and forest areas, were found in the northern part of the (YB) and at the long of the main stream around the border between Jordan and Syria, where Al-Wehda dam constructed, in addition the high NDVI value in the western part of the basin. In comparison the NDVI 2010 values with the results of 2018 show a significant change across the whole region with NDVI value ranges from 0.50 to - 0.1 (Fig. 2). Higher NDVI was found in scattered patches. The decrease in NDVI value indicates the change in the vegetated area mainly due to the decline of dense vegetated area and shifted from north to southern part far away from the border areas between Jordan and Syria.
Image differencing method was applied for pixel-by pixel comparison and was performed on the NDVI generated images of both dates. Image differencing was calculated using GIS tools (Raster calculator), to distinguishing the vegetation area from the non-vegetation area. Fig.3. The results indicated that the vegetation areas mainly the irrigated agriculture decreased by 12.02%, due to scarcity of water resources, as the amount of water allocated for irrigation decreased by 50% in order to meet the needs of water for the domestic uses. On the other hand, the bare area and the built-up area are increased by 8.42%, 1.69%, respectively, during the study period.
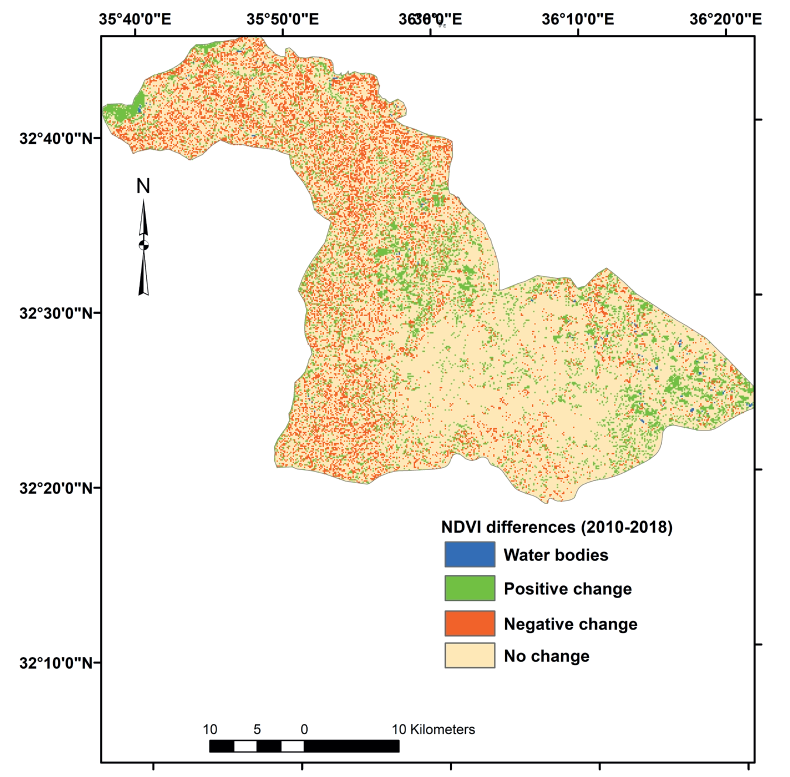
Fig. 3. Changes in NDVI during the period (2010-2018)
Table 3. Information of satellite images used in this paper
Satellite Data | Bands | Acquisition Date | Spatial ground Resolution | Path and Row |
|---|---|---|---|---|
Landsat (5) TM | All bands excluded band 6 (Shortwave Infrared) | 2010 / August | 30*30 m | Path 174 Row 38 |
Landsat (8) (OLI) | All bands excluded bands 10 and !!(Thermal Infrared) | 2018/August | 30*30 m | Path 174 Row 38 |
Both the two images were acquired in the same month (August) in order to minimize the impacts of seasonal differences of vegetation. To map changes that had occurred between the two dates, six spectral bands of both TM digital data were individually used as input to extract of the LULC, we applying digitizing on screen from the satellite images with the help of Google Earth. In this study, four land-cov- er classes could be identified. These LULC are Built-up area, vegetation area, Water bodies, and bare area. These four categories of land use/cover are definitions and summarized in table 2. The classified satellite image of the year 2010 and 2018 shows a significant change in LULC in the study area. The classified image of the year 2010, Fig. 4 shows that about 361.3 km2 (25.7%) of the area is covered by vegetation, while the classified image of the year 2018 shows a significant reduction and the major change has been found in the vegetation cover area where the reduction about 13.86 kmh (-12.02%) of vegetated area have been degraded between the year 2010 and 2018. The changes occur mainly due to the Syrian conflict. The results showed that the vegetation land have decreased from 361.3 kmh to 192.4 kmh during the study period, built up area has increased from 136.7 kmh in 2010 to 160.1 km2 in 2018 which indicates that the number of population has increased during this period. In comparison, another increase was in barren area class was occurred during the study period, which increased by 74.82 kmh.
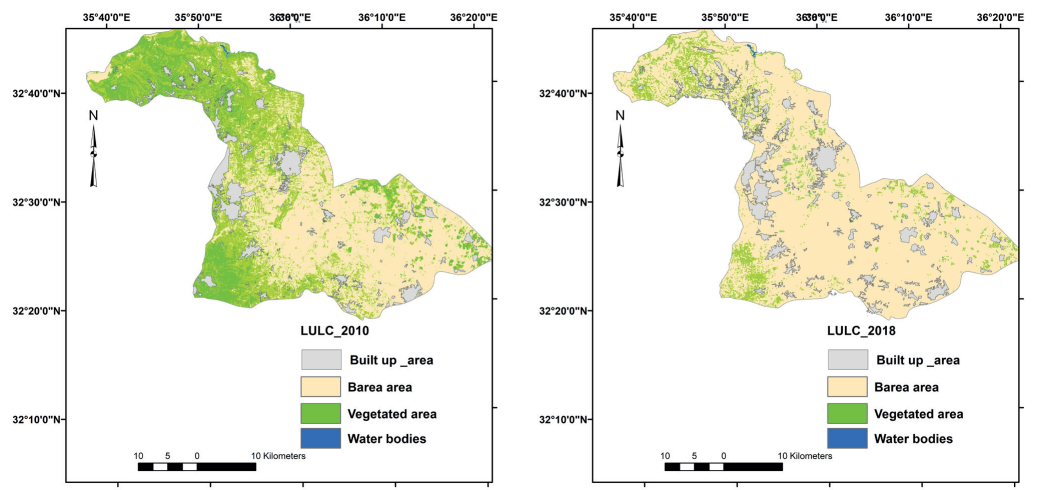
Fig. 4. LULC during the monitoring period (2010-2018)
Linear regression In order to demonstrate the direct and rapid impact of the Syrian refugee crisis on the shrinkage of the LULC, and to exclude the effect of climate change on the dramatic decrease of vegetated area a linear regression and IDW were analyzed.
Linear regression was applied to examine and clarify the general trends in the annual mean rainfall, in the study area between (2010/2017). Simple linear regression, which studies the relationship between a response variable y (meteorological variable) and a predictor variable x (year), is essentially a trend test. Linear trend means that the rate of change over time is constant. The results of the analysis show that the gradient of trend is a slight negative, which indicates a decline in the mean rainfall in the study area. And the value of the regression coefficient (b) is 0.034 the negative values indicate an adecrease in the annual rainfall during the study period; but these findings are not statistically significant at the 95 % confidence level.
IDW Spatial interpolation method (IDW) for the time series (2010/2018) for all the twelve station was used to convert the point layer (meteorological stations) into spatial layer, as shown in Figure 6. In order to assess the change in the area of rainfall and to measure the area according to the mean of rainfall. The main results showed that no changes in the areas with the least mean of rainfall between the two dates. While the areas with highest mean rainfall decreased by 2%.
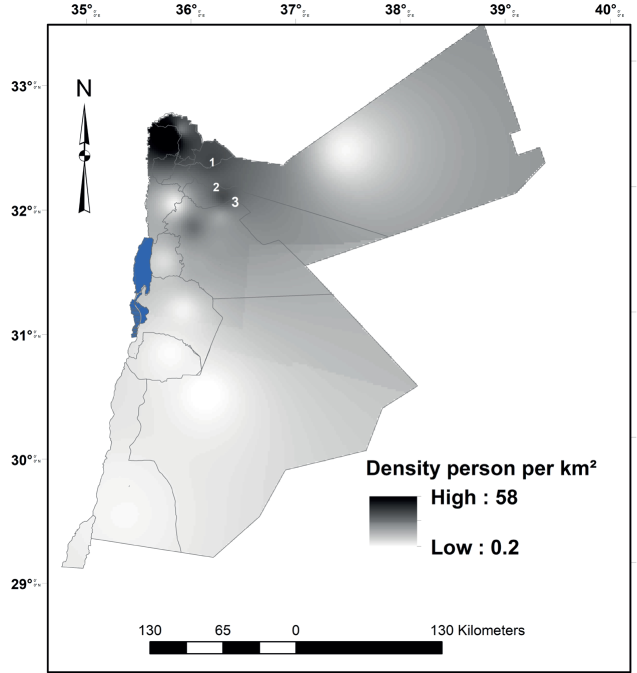
Fig. 5. Syrian refugees by locality, Numbers (1-3) Za'atri, Azraq and the Emirate Camps respectively, and density person per km2 (modified) from Data source: https://data2.unhcr.org/en/documents/download/63034
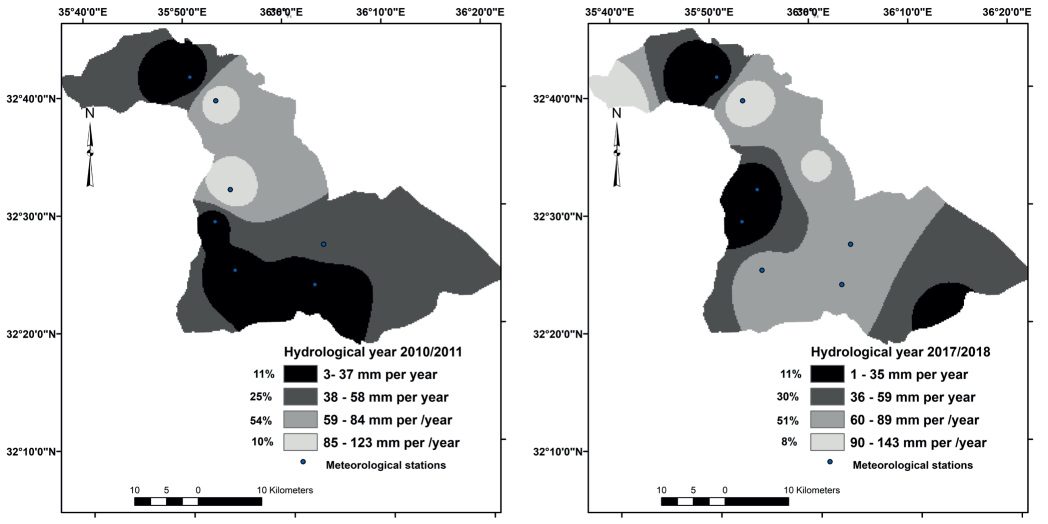
Fig. 6. IDW results and the locations of the meteorological stations
As the study goal is to highlight the direct and indirect effects of Syria crisis on freshwater resources through the impacts of refugee migration, land use change, and changes in water management practices in the Yarmouk-Jordan river watershed, which is the highest density of Syrian refugees, Fig. 5. NDVI index was used to monitor and evaluate the vegetation area, practically, the irrigated cropland in the study area during the dry summer months (June to September). Changes in the vegetation cover are shown in table 2 and Fig. 4. The analysis indicates a decrease in the vegetated by (-12.02%) within only 8 years in addition, an increase of the built up area by (+1.69%). Linear regression results showed that the mean annual rainfall Characterized by fluctuations and contrast, and the changes have no statistically significant at the 95 % confidence level was found. Finally, (IDW) spatial interpolation method showed decline of the areas with the highest mean rainfall by 1.4%. These results confirm the indirect impact of Syrian refugees on water for domestic purposes, which reduced the amount of water allocated for irrigated agriculture. The natural historical annual flow of the Yarmouk River is an estimated more of 400 MCM, The Current flow is around 14 MCM per year (Water Authority of Jordan 20 1 74). In addition, Ground water balance is (-14) MCM (Department of Statistics and World Food Program 20165). Increases in water for domestic lead to a fall in per capita water from 140 m3 to 90 m3 by 2020, (Salman et al. 2018). The number of Syrian refugees in Jordan is about 1.4 million, representing 20% of the total population of Jordan. More than 3,500 million cubic meters are transported daily to Zaatari camp, and the per capita water supply in the northern cities has fallen below 68 liters per day in 2018.
1. Anderson J., Hardy E., Roach J. and Witmer R. (1976). A land use and land cover classification system for use with remote sensor data. Geological Survey Professional Paper No. 964, Washington DC. 28: Government Printing Office.
2. Al-Bilbisi H. (2012). A two-decade land use and cover change detection and land degradation monitoring in Central Jordan using satellite images. Jordan Journal of Social Sciences. 5(1), 133.
3. Comair G, McKinney D. and Siegel D. (2012). Hydrology of the Jordan River Basin: Watershed Delineation, Precipitation and Evapotranspiration, Water Resource Management, 26, 4281-4293.
4. Al-Dardoor A., Al Taani A. and Hammouri N. (2013). Drought assessment using advanced GIS and remote sensing techniques: A case study of Yarmouk River Basin, unpublished Master thesis.
5. Farhan I. and Al-Bakri, F. (2012). Use of GIS and Remote Sensing to Assess Soil Erosion in an Arid to Semiarid Basin in Jordan. In: Proceedings of the International Conference on Sediment Transport: Modeling in Hydrological Watersheds and Rivers, Istanbul, 145-152.
6. Ferragina E. and Greco F. (2008). The Disi project: an internal/external analysis, Water International, 33, 451-463.
7. Gleick P. (1993). Water and conflict: Fresh water resources and international security, Int Secur (18) 79-112.
8. Gleick P. (2014). Water, Drought, Climate Change, and Conflict in Syria, American Meteorological Society. 331-340.
9. Haddadin M. (2009). Cooperation and lack thereof on management of the Yarmouk River. Water International, 34, 420-431.
10. Haddadin M. (2001). Diplomacy on the Jordan: International Conflict and Negotiated Resolution. Norwell, Mass: Kluwer Academic Publishers. Al-Husban Y. (2013). The Effect of Water Conflict on the Geomorpholoical of the Lower Yarmouk River during the Period (1960–2011), European Journal of Scientific Research, 327-337.
11. Al-Husban Y. (2019). Urban expansion and shrinkage of vegetation cover in Al Balqa Governorate, the Hashemite Kingdom of Jordan, Environmental Earth Sciences, Springer, 78, 620.
12. Al-Husban Y., (2013), Analysis of trends in temperature, selected stations in Arab Gulf during the period 1980–2011. Journal of Social Sciences, 42(1), 210-31.
13. Al-Husban Y. and Zghoul M. (2017), Analysis of Drought Patterns in Azraq Depression (AD), During the Period (1984–2016). International Journal of Applied Environmental Sciences, 12(2), 341-358.
14. Al-Husban Y. and Almanasyeh N. (2017). Accounting for the Level of Decline in the Dead Sea: Land Use and Land Cover Changes, 1984–2015. The Arab World Geographer / Le Géographe du monde arabe, 3(2-3), 317.
15. Al-Husban Y. and Makhamreh Z. (2013). Trends in the Minimum Temperature and Number of Frost Events in the North-Eastern Badia of Jordan during the Period 1980–2010. The Arab World Geographer / Le Géographe du monde arabe, 16(4), 333-348.
16. Al-Husban Y. (2017). Inverse Distance Weighting (IDW) for Estimating Spatial Variation of Monthly and Annually Rainfall in Azraq Basin during the monitor Period (1980–2016). Al-Hussein Bin Talal University’s journal of research, 2(3).
17. Rosenberg D. (2006). The Yarmouk River Agreements: Jordan-Syrian Transboundary Water Management, 1953–2004. The Arab World Geographer, 9, 23-39.
18. Rouse J., Haas R., Schell J. and Deering D. (1974). Monitoring vegetation system in the Great Plains with ERTS. 3ed ERTS Symposium, Washington, D. C.: NASA SP-351. 1, 309-317.
19. Salman M., Claudia C., Bucciarelli M. and Losacco M. (2018). An assessment of policies, institutions and regulations for water harvesting, solar energy, and groundwater in Jordan, A review and gap analysis, Rome: FAO.
20. Shamir U. (1998). Water agreements between Israel and its neighbors. Middle Eastern Natural Environments, 103, 274–296.
21. Al-Sharifa H., Chul H., Odeh T., Bhuiyan C. and Hussein H. (2018). Understanding the impact of droughts in the Yarmouk Basin, Jordan: monitoring droughts through meteorological and hydrological drought indices. Arabian Journal of Geosciences, 11, 103.
22. Singh A. (1989). Digital change detection techniques using remotely-sensed data, Int. J. Remote Sensing, volume 10, p. 989-1003. Sensing of Environment, 37, 35-46, DOI: 10.1016/0034-4257(91)90048-B.
23. Al-Taani A., Al-Husban Y., Farhan I. (2020). Land suitability evaluation for agricultural use using GIS and remote sensing techniques: The case study of Ma’an Governorate, Jordan. The Egyptian Journal of Remote Sensing and Space Sciences. DOI: 10.1016/j.ejrs.2020.01.001.
24. Toset H., Gleditsch N., Hegre H. (2000). Shared rivers and interstate conflict. Polit Geoge, 19, 971-996.
Department of Geography
Amman 11942
Al-Husban Yu., Ayen A. The Impact Of The Syrian Civil War On Land Use / Land Cover In Al-Yarmouk Basin During 2010–2018. GEOGRAPHY, ENVIRONMENT, SUSTAINABILITY. 2020;13(2):147-153. https://doi.org/10.24057/2071-9388-2018-73

Editor-in-Chief
Kasimov Nikolay S.Lomonosov Moscow State University
Moscow 119991 Russia, Leninskie Gory, Faculty of Geography, 1806a
Phone +7 495 939-15-52
E-mail: ges-journal@geogr.msu.ru


