


Contents
Scroll to:
https://doi.org/10.24057/2071-9388-2020-29
Scroll to:
Kireeva M.B., Rets E.P., Frolova N.L., Samsonov T.E., Povalishnikova E.S., Entin A.L., Durmanov I.N., Ivanov A.M. Occasional Floods On The Rivers Of Russian Plain In The 20Th –21St Centuries. GEOGRAPHY, ENVIRONMENT, SUSTAINABILITY. 2020;13(2):84-95. https://doi.org/10.24057/2071-9388-2020-29
The study of occasional floods is vital because the phenomenon is often associated with the world's most destructive floods (Bloschl et al. 2017). An analysis of foreign studies shows that the water regime of the rivers not only in the European territory of Russia (ETR), but also of other rivers of Eastern and Western Europe, has undergone significant changes in nature and structure over the past decades.
For example, according Parajka et al. (2010), significant changes in the processes of floods caused by rain have been observed on the rivers of the Alpine-Carpathian region; the role of autumn floods is increasing in proportion to the total volume of peak flow. Thus, due to an increase in the volume of autumn floods, a decrease in summer runoff is observed. Parajka et al. mainly attribute this to changes in the climatic regime of the region, primarily the precipitation regime and the trends of air mass movement. The authors note that floods typically have a pronounced seasonality, especially for foothill or semi-mountain terrain. However, the precipitation maxima that historically occurred in July and August for the territory as a whole have moved to the end of summer and the end of autumn, and for other sections there was a shift in the maximum and intensity of precipitation in the spring. This happened as a result of the confrontation of cold air masses from the north and warm from the Mediterranean Sea.
Studies conducted in Germany (Beurton and Thieken 2009) show that country has three regions with different flood regimes. Winter floods prevail in western and central Germany, while in the north and east spring and summer floods dominate, and in southern Germany the peak flood season is in summer. These differences are most likely associated with a change in the western circulation of air masses. Since 1971, the flood regime of German rivers has undergone substantial changes in structure and character, leading Beurton and Thieken to consider two periods, 19712000 and 1940-2000. The occurrence of floods on the Rhine,
Odra, Danube, and Elbe over the past two decades has led to discussions about climate change and its consequences for river floods. Their analysis of flood development trends revealed greater changes for winter floods than for summer floods. The work of other researchers (Petrow and Merz 2009) has revealed that the observed changes in flood formation are influenced by climatic factors. Thus, milder winters and more frequent rains can cause an increase in the share of winter floods during the entire year for all of Western Europe.
Flood typing and classification is of interest to researchers (Marsh and Hannaford 2007). The vast majority of studies are based on cluster analysis - a multidimensional statistical procedure that collects data offering information about the objects. The clustering task relates to statistical processing, as a result of which typologies and classifications are obtained, and schemes or models are developed. Research results show that floods are least active in summer (Finch et al. 2007). Over recent decades, the share of floods in summer has been rapidly decreasing due to the strong influence of vegetation cover and evaporation. At the same time, the significance of winter floods has been increasing, due to western transport and the influence of the Atlantic, which determine the thermophysical features of the region and the presence of precipitation.
According to the authors of a 2001 article (Cunderlik and Burn 2001), an understanding of the hydroclimatic processes that determine the occurrence of floods is fundamental to assessing their recurrence. With this approach, the flood regime of the river is a reflection of the properties of the catchment. Many authors have noted that over the past few decades floods have become more frequent due to changes in peak flow, the contribution of which to the structure of the total runoff of rivers is becoming more significant.
Many studies are based on a description of seasonal peaks that caused flooding that led to significant damage to the urban infrastructure and offer analysis of the factors that caused them. In one example, the articles published with the support of the national hydrological monitoring program analyze the floods that occurred in England and Wales in 2007 (Marsh and Hannaford 2007; Finch et al. 2007) as a result of summer peak flow. The authors found uniformity and almost no change in the timing of flooding during the summer season in this territory. They note that the cause of the flood is abnormal synoptic conditions. Air flows under the influence of the North Atlantic weather system changed their direction to the south, contributing to the establishment of high pressure over Great Britain (Azores anticyclone), which prevented summer weather from coming to the region. Citing studies on climate modeling, note that the result of climate change will increase the intensity of rainfall, especially in the middle and high latitudes, as well as an increased risk of summer floods in some regions.
The seasonality of the maximum water discharge on the rivers of Europe is analyzed in an article published in Science (Bloschl et al. 2017) and is directly related to their genesis. The authors compare the coincidence of the maximum discharges with soil moisture, 7-day maximum precipitation and maximum winter snowpack. For most rivers of the ETR, there is a shift of the maximum water discharge to an earlier date. At the same time, for individual rivers of the northwest, dates of maximum discharge are in the winter months and are associated with thaw floods. An analysis of the spatial distribution of the seasonality of maximum discharge has been carried out by Hall and Bloschl (2018). Their findings show that all rivers of European Russia fall into a cluster with spring discharge peaks associated with seasonal spring floods. Their article describes methods that can be used in the future to pinpoint regions that give rise to floods on the rivers of the ETR.
The study of winter floods on the rivers of Belarus is extremely important, since it is a border region with Russia. The results of one study (Volchek and Shelest 2012) echo the trends in the growth of winter floods on the rivers of Central Russia and the north-west. The authors revealed statistically significant increases in the maximum winter peak discharge for 10 of the 30 rivers studied. The authors attribute these trends mainly to the increasing role of the western type of atmospheric circulation. The article (Volchek and Shelest 2012) identifies groups of years with extreme floods observed on many rivers. The authors also analyzed the number of floods during the years of prevalence of various types of circulation. It is shown that the number of floods on most rivers is greater in years with western atmospheric circulation (W). As a result of the work, it was revealed that the increase in maximum water discharge on most rivers in Belarus is about 10%, only on the rivers of the Polessye region the maximum winter discharge increases by 20-40%.
The time-series of daily water discharges for the observation period 1936-2015 is used as initial information. At the data preparation stage, large and medium rivers with a basin area from 2000 to 50,000 km2 were selected in the ETR. Calculations were also carried out for individual closing sections of large rivers with a catchment area of 150,000 to 250,000 km2. Medium rivers were used to assess the background changes in the water regime, and the closing sections of large rivers were used to study the transformation of runoff and water regime characteristics of large river basins. As a result, 55 gauging stations located in the regions with different flow formation conditions were selected for the ETR; priority was given to gauges with the most comprehensive hydrological data. Initial data for calculations (Table 1) were prepared for the selected sections, including a continuous series of water discharges. As the main method for processing the initial data, we used GrWat automated hydrograph partition algorithm (Kireeva et al. 2019). Partly this algorithm based on the same principals, described in several research papers (Nathan and McMahon 1990; Eckhardt 2005; Shevnina 2013). As a result of this partition, four genetic components of the runoff were obtained for each day of the water year: base flow, thawed snow (main flood wave), thawed snow (thawing peaks during the winter) and rain.
Table 1. Representative basins that were used to assess the characteristics of the flood flow of rivers in the European territory of Russia (ID numbers correspond to Fig. 1)
No. | River | Station | Watershed area, km2 | Observation period | Natural zone | |
|---|---|---|---|---|---|---|
Russian North | ||||||
1 | North Dvina | Ust-Pinega | 348,000 | 1930-2014 | taiga | |
2 | Sykhona | Kalikino | 49,000 | 1930-2014 | taiga | |
3 | Vym' | Veslyana | 19,100 | 1928-2014 | taiga, forest-tundra | |
4 | Onega | Nadporozhskiy Pogost | 12,800 | 1926-2014 | taiga | |
5 | Mezen | Malonisogorskaya | 56,000 | 1930-2014 | taiga, forest-tundra | |
6 | Pechora | Ust-Tsilma | 248,000 | 1932-2014 | taiga, forest-tundra | |
7 | Izhma | Ust-Ukhta | 15,000 | 1913-2014 | taiga, forest-tundra | |
8 | Usa | Petrun | 27,500 | 1915-2014 | taiga, forest-tundra | |
Kolskiy peninsula | ||||||
9 | Umba | Payalka | 6,470 | 1932-2015 | forest-tundra | |
10 | Ponoi | Kanevka | 10,200 | 1932-2015 | forest-tundra | |
Volga basin | ||||||
11 | Volga | Staritsa | 21,100 | 1920-2010 | mixed forest | |
12 | Tvertsa | Madnoe | 5,400 | 1877-2015 | mixed forest | |
13 | Mologa | Ustuzhna | 19,100 | 1934-2015 | mixed forest | |
14 | Kostroma | Buy | 8,870 | 1896-2015 | forest-steppe | |
15 | Unzha | Makarjev | 18,500 | 1900-2015 | mixed forest | |
16 | Vetluga | Vetluga | 22,200 | 1938-2015 | mixed forest | |
17 | Tsivil | Tuvsi | 4,040 | 1945-2015 | forest-steppe | |
18 | Sura | Poretskoe | 15,400 | 1935-2015 | forest-steppe | |
19 | Alatur | Turgenjevo | 11,000 | 1933-2015 | forest-steppe | |
20 | Samara | Elshanka | 22,800 | 1878-2015 | forest-steppe | |
Oka (main right tributary of Volga) Basin | ||||||
21 | Oka | Kaluga | 54,900 | 1876-2015 | forest-steppe | |
22 | Oka | Murom | 190,000 | 1936-2015 | forest-steppe | |
23 | Ugra | Tovarkovo | 15,300 | 1935-2015 | forest-steppe | |
24 | Moksha | Temnikov | 15,800 | 1935-2015 | forest-steppe | |
25 | Tsna | Knyazhevo | 13,600 | 1932-2015 | forest-steppe | |
26 | Klyasma | Kovrov | 24,900 | 1878-2015 | mixed forest | |
Don basin | ||||||
27 | Don | Kazanskaya | 102,000 | 1928-2015 | forest-steppe | |
28 | Sosna | Elets | 16,300 | 1927-2015 | forest-steppe | |
29 | Krasivaya Mecha | Efremov | 3,240 | 1944-2015 | forest-steppe | |
30 | Khoper | Besplemyanovskiy | 44,900 | 1929-2015 | forest-steppe | |
31 | Medveditsa | Archedinskaya | 33,700 | 1928-2015 | forest-steppe, steppe | |
32 | Medveditsa | Lisie Gory | 7,610 | 1936-2015 | forest-steppe | |
33 | Ilovlya | Aleksandrovka | 6,520 | 1915-2015 | steppe | |
34 | Chir | Oblivskaya | 8,470 | 1923-2015 | steppe | |
35 | Tikhoya Sosna | Alekseevka | 2,060 | 1941-2015 | forest-steppe | |
36 | Bitug | Bobrov | 7,340 | 1936-2015 | forest-steppe | |
Kama (main left tributary of Volga) basin | ||||||
37 | Kama | Gayni | 27,400 | 1911-2015 | taiga | |
38 | Vishera | Ryabinino | 30,900 | 1930-2015 | taiga | |
39 | Chusovaya | Lyamino | 21,500 | 1956-2015 | mixed forest | |
40 | Sylva | Podkamennoe | 19,700 | 1931-2015 | mixed forest | |
41 | Ufa | Krasnoufimsk | 14,200 | 1971-2015 | mixed forest | |
42 | Dema | Bochkarevo | 12,500 | 1946-2015 | mixed forest | |
43 | Belaya | Sterlitamak | 21,000 | 1931-2015 | mixed forest | |
44 | Cheptsa | Glazov | 9,750 | 1927-2015 | mixed forest | |
45 | Vyatka | Vyatskie Polyani | 124,000 | 1918-2015 | mixed forest | |
North Caucasus basins | ||||||
46 | Terek | Vladikavkaz | 1,490 | 1960-2017 | a | titudinal zone |
47 | Terek | Kotlyarevskaya | 8,920 | 1960-2017 | a | titudinal zone |
48 | Baksan | Zaykovo | 2,100 | 1960-2017 | a | titudinal zone |
49 | Kambileevka | Olginskoe | 359 | 1960-2017 | a | titudinal zone |
50 | Nalchik | Belaya Rechka | 140 | 1960-2017 | a | titudinal zone |
51 | Kuban | Armavir | 16,900 | 1960-2017 | a | titudinal zone |
52 | Marukha | Marukha | 301 | 1960-2017 | a | titudinal zone |
53 | Urup | Steblitskiy | 3,190 | 1960-2017 | a | titudinal zone |
54 | Bolshaya Laba | Nizhe Aziatskogo Mosta | 1,180 | 1960-2017 | a | titudinal zone |
55 | Belaya | Kamennomostskiy | 1,850 | 1960-2017 | a | titudinal zone |
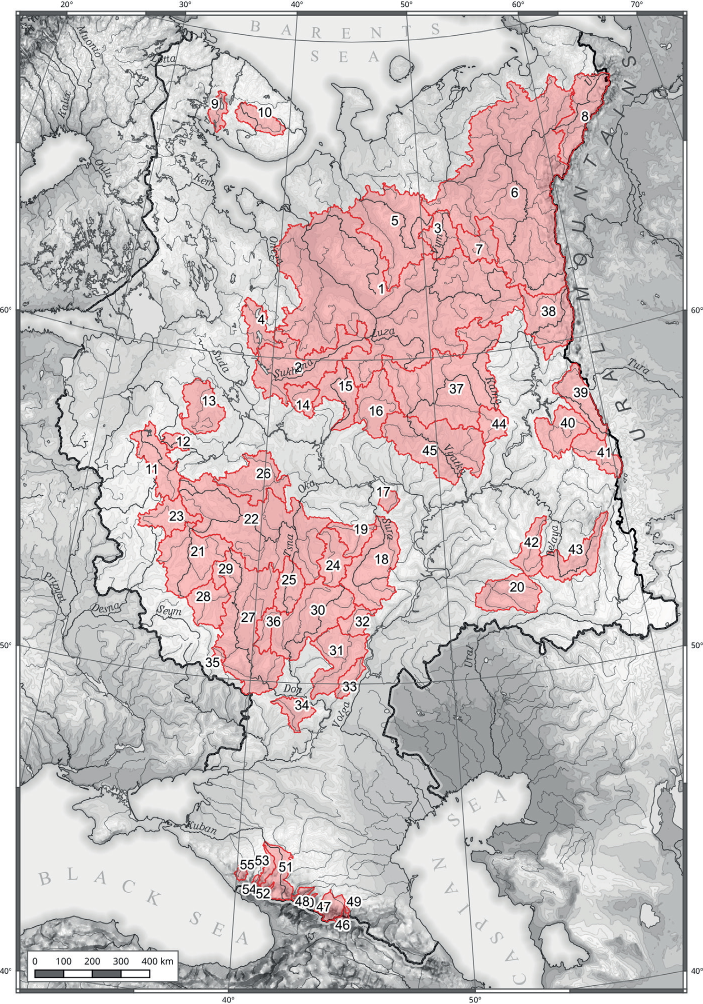
Fig. 1. Basins used in the analysis of occasional floods on the rivers of the European territory of Russia
For each output parameter from GrWat package statistical criteria's were calculated. Analysis include Fisher, Student and no parametric all Spearman criteria as well as Mann-Kendall test, t-test and petit test for threshold year.
As the result, all indicators characterizing the seasonal runoff, seasonal flood runoff, summer-autumn and winter low flow periods. Fourteen indicators were calculated for occasional floods (Table 2). A total of 1,680 hydrographs were analyzed. Despite the universality of the proposed algorithm, separation errors were observed for 45 hydrographs (2.7% of the total). Regardless, this can be considered a good result, as the same parameter set was used for the entire observational period each gauging station. The characteristics of the occasional floods were calculated for two seasons: the summer-autumn period (from this point, «rain floods») and the winter period («thaw floods»). The end of the summer-autumn period is set to a stable transition of the air temperature to negative values for five days during each year in each watershed.
Table 2. List of characteristics in the output file of the GrWat algorithm
Group | No. | Title | Units | Characteristics |
|---|---|---|---|---|
Runoff volume | 1 | Wpavs1 | km3 | Total volume of occasional rain flood runoff with groundwater component |
2 | Wpavs2 | km3 | Total volume of occasional rain flood runoff without groundwater component | |
3 | Wpavthaw1 | km3 | Total volume of occasional thaw flood runoff with groundwater component | |
4 | Wpavthaw2 | km3 | Total volume of occasional thaw flood runoff without groundwater component | |
Parameters of maximum flow | 5 | Qmaxpavs | m3/s | Daily maximum discharge of rain occasional floods |
6 | datemaxpavs | date | Date of daily maximum discharge of rain occasional floods | |
7 | Qmaxpavthaw | m3/s | Daily maximum discharge of thaw occasional floods | |
8 | datemaxpavthaw | date | Date of daily maximum discharge of thaw occasional floods | |
9 | DaysPavsSum | days | Number of days, classified as occasional flood, during summer-autumn low flow period | |
10 | DaysThawWin | days | Number of days, classified as occasional flood, during winter low flow period | |
Other | 11 | CvWin | - | The relative variability of winter low flow period |
12 | CvSum | - | The relative variability of winter low flow period | |
13 | CountPavs | number | Number of rain peaks | |
14 | CountThaws | number | Number of thaw peaks |
Recently, occasional river floods have been observed almost annually for most rivers of the European Russia. Moreover floods have been observed in most hydrological seasons in recent decades. This process is clearly visible in the long-term oscillations of the dates of the peak annual discharges of rain and thaw floods.
Trends in the characteristics of rain floods vary with the geographic location of the catchment. For the rivers of the Russian north, northwest and most rivers of central Russia rain floods, which were previously observed mainly in July, have shifted noticeably earlier, now characteristic of May and June (Fig. 2). Additionally, the number of autumn floods in the north of the ETR has generally decreased significantly. In the North Caucasus, the dates of the peak runoff have shifted from July-August to June-July for rivers with a significant share of alpine snow and glacial snowmelt runoff. The trend toward an increased «spread» of the dates of annual maximum water discharge of flash-floods is characteristic of the steppe and forest-steppe regions - the Don basin, tributaries of the lower reaches of the Oka River, and rivers of the Middle and Lower Volga basin. So, for example, on the Samara river the maximum discharge of rain floods was mainly observed in May-August until the mid-1970s (Fig. 2a) and was associated with intense summer rains. In the following decades another «cluster» of dates is distinguished - rain floods observed in October- December.
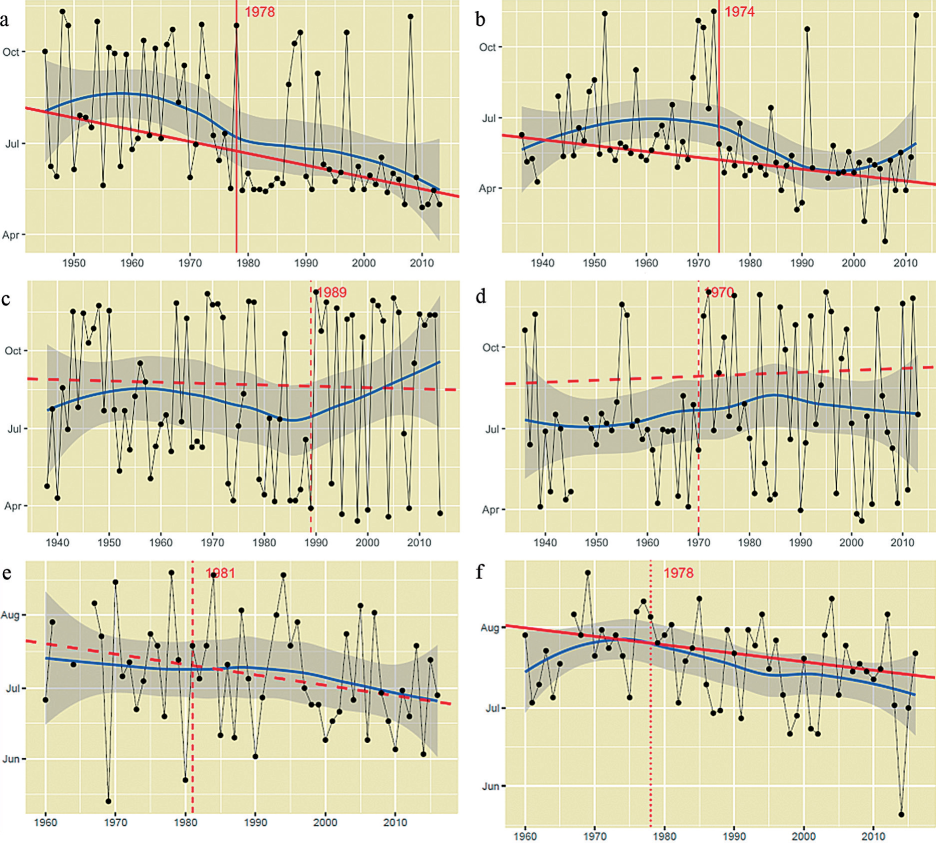
Fig. 2. Dates of maximum discharge of rain floods for: (a) the Mezen River - village Malonisogorsk, (b) the Oka River - Kaluga city, (c) the Hoper River - Besplemyanovsky farm, (d) the Samara River - village Yelshanka, (e) the Terek River - Vladikavkaz city, (f) the Baksan River - village Zayukovo
Trends in annual maximum discharges of rain floods are multidirectional. The annual maximum discharges of rain floods of the Mezen river increase in a statistically significant manner, while the same feature of the neighboring Northern Dvina and Pechora, and their tributaries - the Sukhona, Vym, and Usa - has not changed appreciably. There is a slight increase in rain flood maximums in the upper reaches of the Oka and the Don, while the left-bank tributaries of the Volga exhibit the opposite trend. An increase in annual maximum discharges of rain floods is observed in the foothills of the Kuban basin, and there are no statistically significant trends in the mountainous part and in the Terek basin. The only pronounced trend is a statistically significant increase in annual maximum discharges of rain floods for all rivers of the Kama basin (Fig. 3).
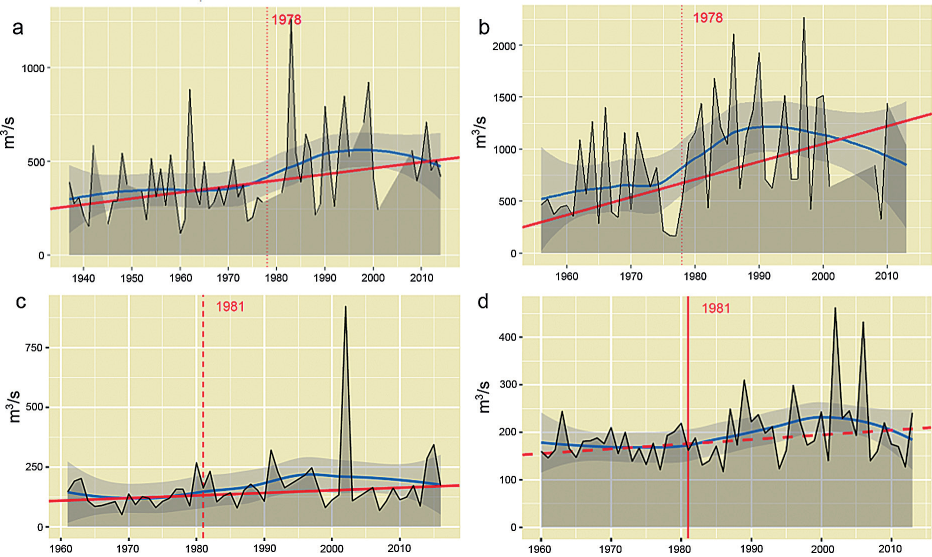
Fig. 3. Annual maximum discharge of rain peaks for: (a) the Kama River - village Guines, (b) the Chusovaya River - village Lyamino, (c) the Urup River - Steblitsky farm, (d) the B.Laba River - below the Asian Bridge
Changes in the volume of rain floods runoff has a noticeable pattern. In general, an increase in the volume of rain floods runoff is observed for most of the rivers of the ETR. This tendency is especially pronounced in the northern territories. Statistically significant trends were identified for the rivers Pechora, Severnaya Dvina, Mezen and Ponoi (Fig. 4). For the rivers of Central Russia and the left-bank tributaries of the Upper Volga - Unzha, Kostroma, Vetluga and the upper Kama River - this trend is less pronounced and not statistically significant (Fig. 4d). At the same time, no increase in the volume of rain floods was observed for the eastern Kama tributaries. Multidirectional trends are characteristic of the south of Russia; in most cases this is a slight decrease, with the exception of the Kuban basin, where a statistically significant increase was detected.
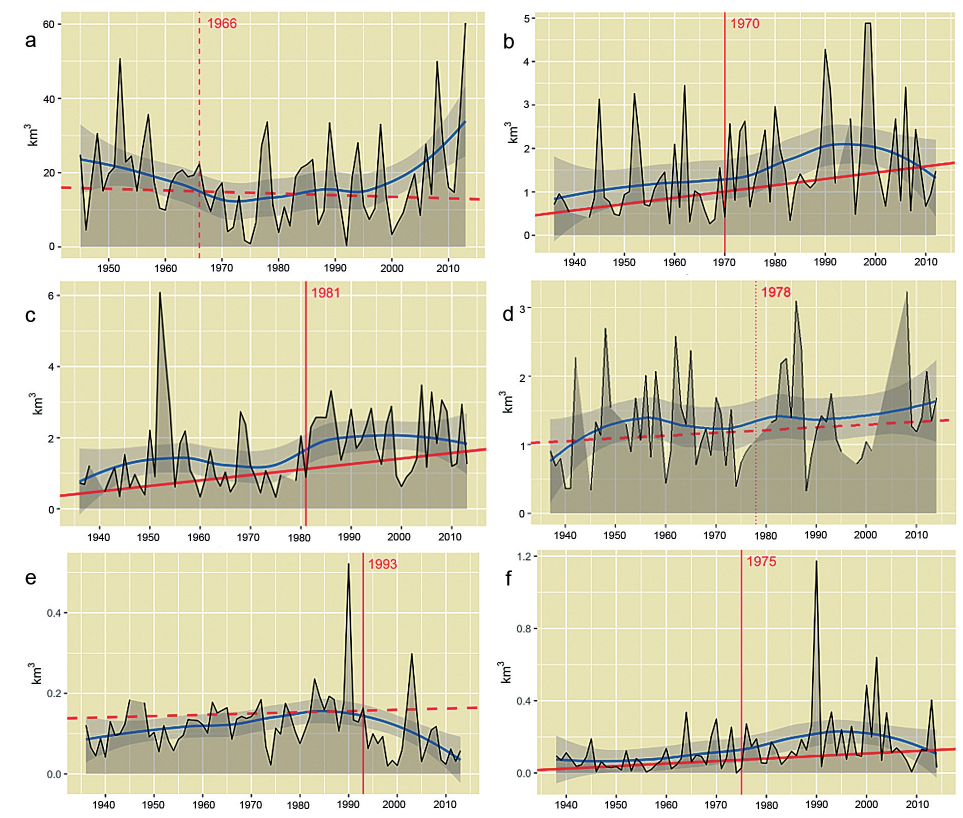
Fig. 4. Volumes of maximum discharge of rain floods for: (a) the Northern Dvina River - village Ust-Pinega, (b) the Oka River - Kaluga city, (c) the Unzha River - Makaryev city, (d) the Kama River - village Gayny, (e) the Samara River - village Yelshanka, (f) the Hoper River - Besplemyanovsky farm
The amount of rain floods has changed insignificantly for all the rivers of the ETR, on average 3-4 floods per year are observed for the rivers of the north. Among the rivers of the Kola Peninsula, an average of 8-10 rain floods occur annually under the influence of the Gulf Stream and Atlantic cyclones, and in some years the number of occasional floods can reach 15. In central Russia, the number of flood waves associated with liquid precipitation averages 6-7 events and has a statistically insignificant upward trend. In the North Caucasus, there are 7-13 rain floods per year in the highlands and up to 15-19 in the foothills. Along rivers with an insufficient zone of humidification, including tributaries of the Don and Lower Volga, the number of rain floods has halved in the last 10 years. While 1-2 rain floods a year were previously observed there, it is common in recent years for none to occur. However, data for a 10-year period is not sufficient to draw reliable conclusions about the trend in number of rain floods in the region.
When assessing the contribution of flash floods to the increase in annual runoff, two characteristics should be considered: the thaw floods' volume including the basic ground flow and without it. The latter indicator reflects the volume of water that enters the channel network relatively quickly as a result of melting snow during thaws and liquid precipitation events. The thaw flood runoff with the basic component include partial melt or liquid precipitation runoff entering the riverbed as an underground component; and depends on the water content of the previous period. Almost everywhere, the volume of thaw runoff without a base component has no statistically significant tendency to increase. Explicit growth is recorded only for the rivers of Central Russia, the Oka basin and its tributaries. For the Kama basin, there is a decrease in the volume of thaw runoff without base component, as well as for the left-bank tributaries of the Volga. In the south, a series of thaw runoff volumes constitute small values with separate pronounced emissions; thus, it is not possible to identify trends for this region. Apparently, the main manifestation of the role of thaw flash floods is expressed in the growth of the base component, reflecting the relationship between surface runoff and groundwater.
The maximum discharges of thaw floods are growing in almost every part of the ETR. In the north, this growth is insignificant; with a move southward, to the Volga basin, this signal is more pronounced (Fig. 5). The strongest growth is recorded for the Oka basin, the left-bank tributaries of the Upper Volga—Unzha, Kostroma and Vetluga (Fig. 5 b, c, e). Among the rivers of the arid zone, the maximum discharge of thaw floods are also increasing in a statistically significant manner. Simultaneously, a shift in the dates of thaw floods to the spring is recorded for the most of gauges (from December-January to February-March). During autumn, the occasional floods, previously classified mostly as thaw floods, occur during rain events in more recent observations.
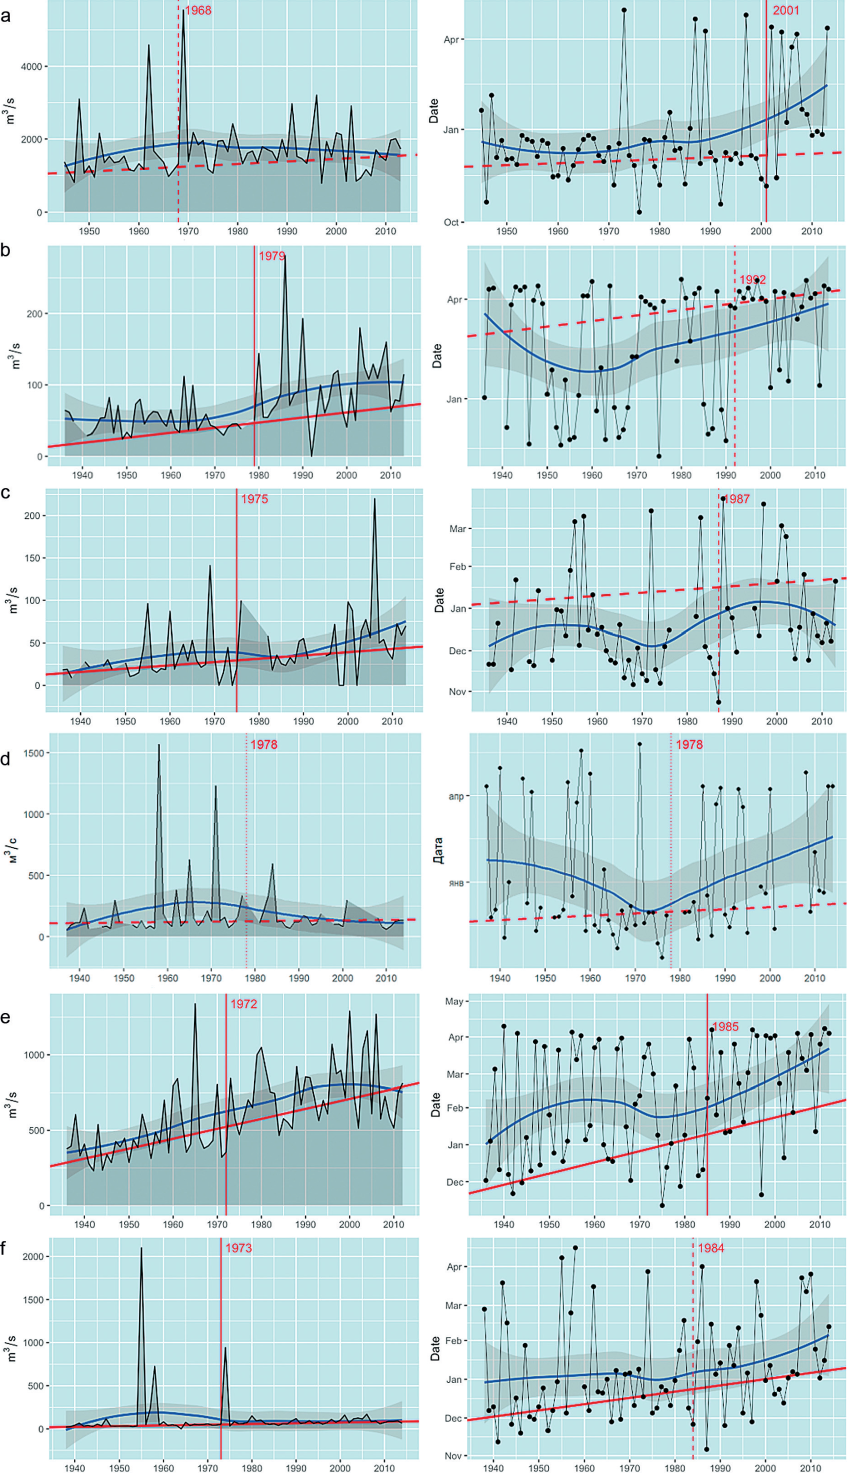
Fig. 5. Change in the maximum discharge rate of thaw floods (left) and its date (right) for : (a) the Severnaya Dvina River - Ust-Pinega village, (b) the Unzha River - Makaryev city, (c) the Moksha River - Temnikov, (d) the Kama River - Gayny village, (e) the Oka River - Murom city, (f) the Hoper River - Besplemyanovsky farm
An increase of the thaw floods number is observed for a few rivers in the ETR; this is most pronounced for the rivers of central Russia, as well as for rivers originating from the slopes of the Southern Urals, Belaya and Dema (Fig. 6). In the South and North Caucasus thaws' number has not changed significantly.
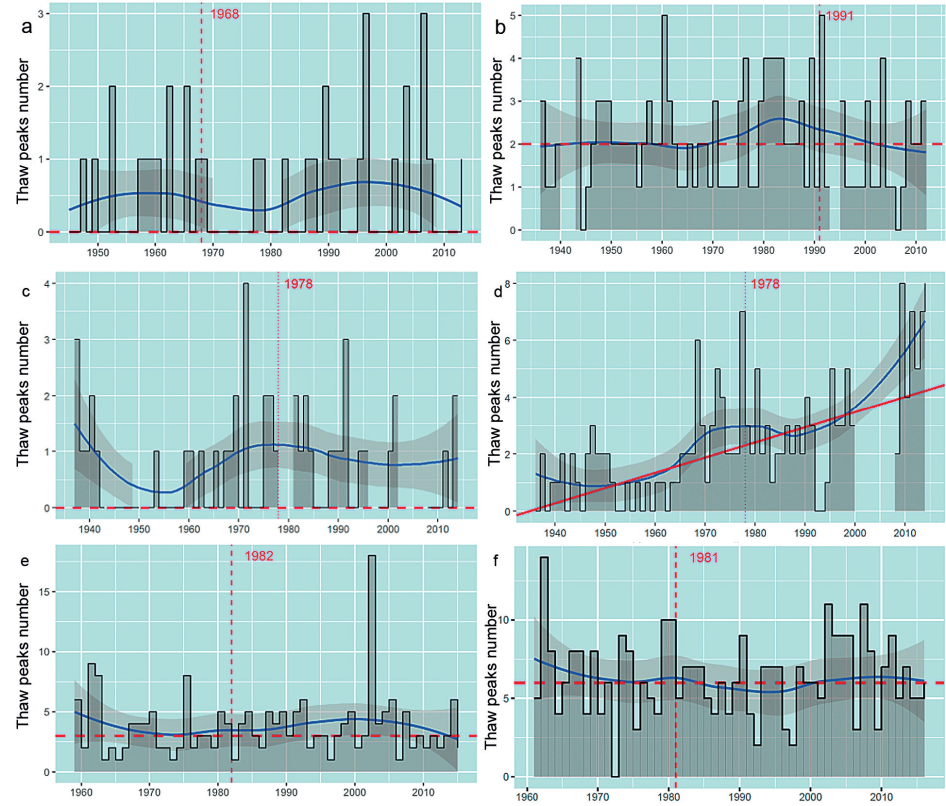
Fig. 6. Change in the number of thaw peaks for: (a) the Mezen River - village Malonisogorskaya, (b) the Oka River - Murom city, (c) the Kama - Gainy village, (d) the Belaya River - Sterlitamak city, (e) the Sosna River - Yelets town, (f) the Urup River - Steblitsky farm
A series of maps of the flood flow characteristics were drawn for the ETR. The maximum specific discharge of rainfall floods is distributed according to geographical zonality. The highest values for lowland rivers - up to 50 L/(s-km2) - are observed in the north of European Russia in the Pechora and Mezen river basins, in the rivers of the Kola Peninsula (Fig. 7).
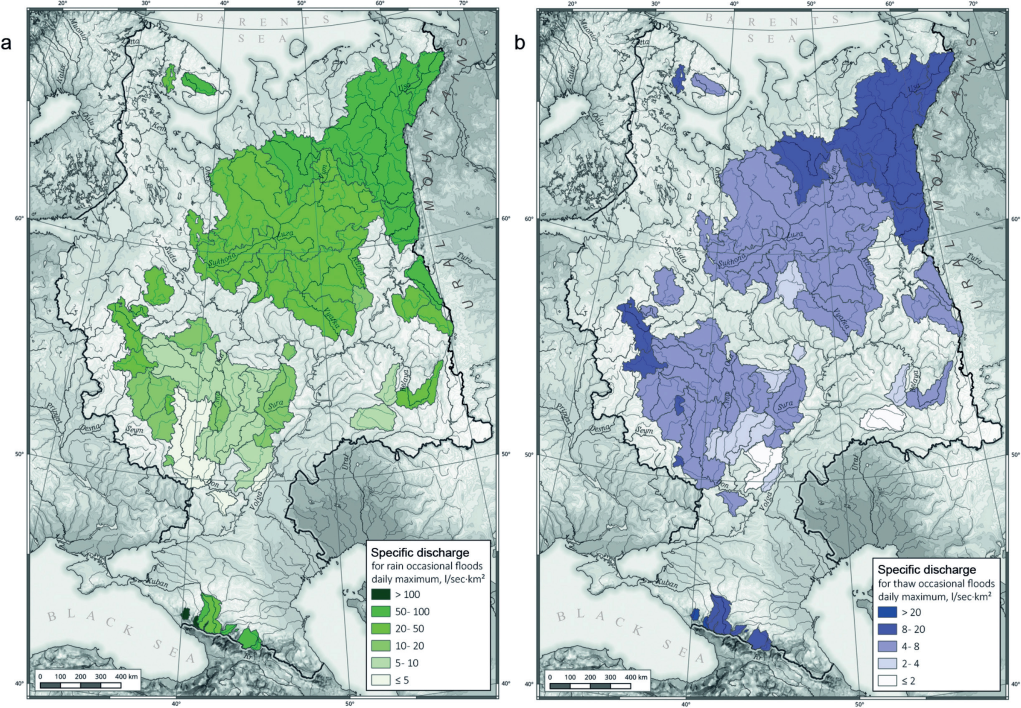
Fig. 7. Maximum daily specific discharge of occasional (a) rain and (b) thaw floods (averaged for 1978-2015)
This maximum corresponds to the climatic ridge of the runoff. The highest values are typical for the Pechora and Kama river basins that originate from the western slopes of the Urals. An interesting feature is the high values (from 20 to 50 L/(s-km2) in the Upper Volga and the Upper Oka. The specific discharge for thaw runoff is an order of magnitude lower than the values for the rain floods runoff; in addition, thaw runoff exhibits a slightly different spatial pattern. The highest values are also typical for the northeast of the region and the Kola Peninsula. The rivers of the Upper Volga basin have a high specific discharge of thaw floods (Fig. 7) of more than 10 L/(s-km2). In the west of the North Caucasus more than 100 L/(s-km2).
The runoff depth of rain and thaw floods varies throughout the territory quite smoothly and almost completely corresponds to changes in the continental climate. Orographic relief forms are distinguished-the Valdai Upland and the slopes of the Urals, where the rain runoff reaches 80 mm and thaw runoff depth is 30 mm (Fig. 8). In the North Caucasus, the runoff depth of rainfall floods is closed to that observed for the rivers of the Russian north, 50-90 mm, while in the catchments of small rivers it can exceeds 130 mm. In recent decades, the thaw runoff depth of rivers of central Russia has markedly increased to 20-30 mm per year.
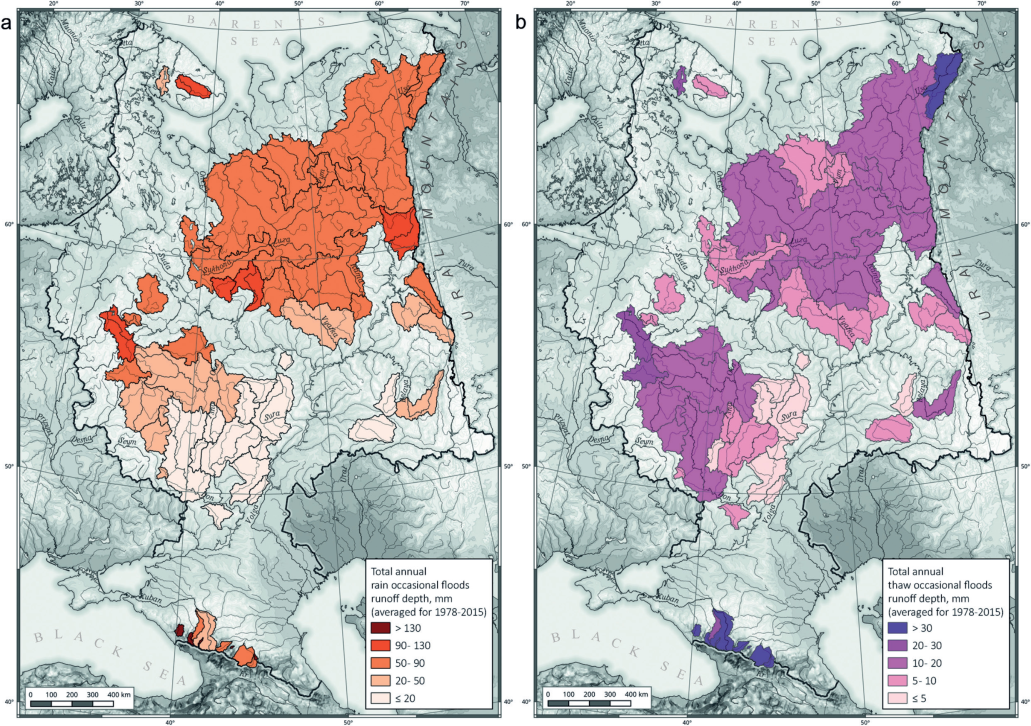
Fig. 8. The runoff depth of occasional (a) rain and (b) thaw floods (averaged for 1978-2015)
An extremely interesting indicator is the average number of occasional floods, observed on the rivers. The number of rain peaks varies from 1 to more than 10, depending on the geographic location of the catchment. The rivers of the western half of the ETR, the left-bank tributaries of the Upper Volga - the Kostroma, Unzha and Vetlug rivers, as well as the rivers of the North Caucasus have the largest number of local rain maximums. The number of thaw occasional floods clearly divides the ETR into the western and eastern half. In the western parts of the Oka basin, the Upper Volga, Don and the North Caucasus it reaches 5-8 or more (Fig. 9), in the eastern part it rarely exceeds 1. Only the left-bank tributaries of the Kama, originating from the slopes of the Southern Urals, are characterized by 2-3 thaw peaks.
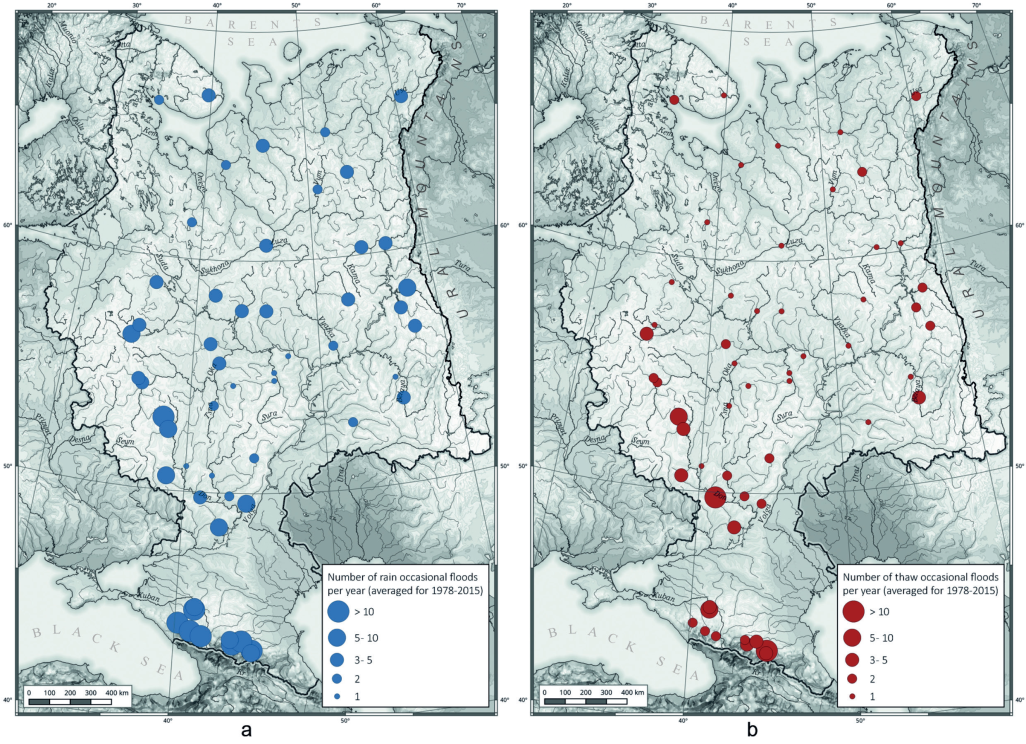
Fig. 9. The number of occasional (a) rain and (b) thaw floods for 1978-2015
An increase in the amount of liquid precipitation in the winter is typical for the modern climate of the ETR (Kireeva 2019). It is closely associated with an increase in the average winter temperature and the number of thaws. The mechanisms of the water regime transformation of the rivers are difficult to interpret due to the lack of direct measurements of all components of the water balance that were previously carried out at water-balance stations (Barabanov et al. 2018). Based on indirect indications (an increase in the level of groundwater, reduction of soil freezing depth, and a decrease of the main seasonal flood volume), it can be concluded that the processes of runoff formation on catchments in the middle latitudes (mixed forest zone) and in the south (forest-steppe zone) of the Russian Plain have begun to occur somewhat differently (Barabanov et al. 2018).
Presumably, this change is due to the influence of warmer air masses, which are increasingly invading from the Atlantic and from the southern latitudes, including the Black Sea. This leads to multiple increases in temperature in the winter, its transition through zero and changes in the phase of precipitation from solid to liquid. In addition, according to recent studies (Kislov et al. 2017), anomalous amounts of precipitation play a significant role in blocking anticyclones. The Euro-Atlantic sector fully covers the ETR and experienced an increase in the frequency of blocking in the northern hemisphere during the 20th - early 21st centuries. Under current conditions, it was hypothesized that a change in the process of runoff formation in the winter period has qualitatively changed the characteristics of seasonal runoff over the past 30 years. By the end of the 1970s, most of the ETR was characterized by relatively cold winters with stable snow cover and a high annual snow- melt maximum in spring. Snow cover moisture-yielding ability was followed by the beginning of surface flow and replenishment of surface and underground water resources and runoff of surplus into the river network (Koronkevich 2018).
Currently, the replenishment of soil and groundwater horizons and the filling of surface depression are associated with thaws and occur several times during the winter. Water flows to the surface of the catchment area throughout the winter. By filtering into soil horizons, it causes increased loss of melt water during the winter low-flow season. At the same time, no pronounced seasonal flood occurs in the spring; the increase in discharge due to surface melt water inflow has changed, presumably, to subsurface inflow with many lower gradients. Such hydrographs are now typical for the rivers of the Don basin and the southern part of the Oka basin as well as Samara, Sura and the Moksha basin. Levelling of the hydrograph led to no «washing» of the riverbed during the flood period; thus, small rivers gradually silt and disappear. The «snowmelt droughts» that stand out on rivers with water peaks during snowmelt season have the same mechanism (Van Loon 2015). All these processes observed while the annual runoff is more or less stable (Frolova 2017).
The formation of thaw floods in winter is especially dependent on the state of the soil surface - its moisture content, freezing depth and the presence of an ice crust on the surface. These three factors determine the possibility of water seepage, that is moisture loss due to infiltration. If the soil freezing depth and its humidity are small, a significant part of the melt water yield will go into the subsurface and ground horizons and the peak flow on the river, most likely, will not form. If there is an ice crust on the surface, it actually turns into a water-repellent and the peak flow most likely will be very high. In the central part of Russia, in the Upper Don and the Oka Basins, significant trends in the minimum soil temperature at a depth of 40 cm have been observed over the past 30-40 years. In the late 1970s and mid-1980s it averaged -4..-6 degrees, reaching -8...-10 degrees in some years; then, in the 2000s, its average value moved toward 0...-1 degrees (average for 2000-2013) (Kireeva et al. 2019). In about half of the measurements the minimum winter soil temperature was positive. Thus, freezing was not already observed at a depth of 40 cm. The minimum temperature of the soil is also influenced by the presence of snow cover - the greater its height, the more noticeable the heat- insulating effect that prevents deep freezing. Therefore, in the more southern regions, for example, in the Lower Don, the tendency to increase the minimum soil temperature is less pronounced. In the northwestern portion of the ETR similar trends are observed; an increase in the minimum soil temperature is less pronounced in the eastern regions of the Kama basin, the Middle and Lower Volga the Urals.
Summing up, we can state that an increase in the minimum soil temperature and, as a consequence, a decrease of the soil freezing depth leads to an increase in subsurface and ground water replenishment. At the same time, melt water losses due to surface retention and evaporation increase during the winter and especially during the spring. The combination of these trends leads to an increase in losses to infiltration and waterlogging of the soil in winter due to the occurrence of frequent thaws and a decrease in surface runoff in spring. As a result, the supply of groundwater increases, in turn leading to an increase in the share of underground river nourishment. The increased discharges of the low-flow period contributes to the formation of occasional floods. Liquid precipitation or a strong and prolonged thaw leads to a sharp increase in water yield. If the soil is already saturated with moisture at this moment the surface runoff begins, superimposed on the previous growth of the river groundwater supply.
In recent years, a significant transformation of the water regime has been taking place on the most rivers of Russian Plain. Occasional floods play an important role in this process. Intensive reduction in the ratio of volumes and maximum discharge of main seasonal flood wave correspond to an increase of the base flow component. This growth is presumably associated with the effect of overlapping occasional floods. Changes in the processes of flow formation in the closing section of the river are associated with increased groundwater supply. A vicious cycle arises: the occurrence of thaws leads to higher water yield to the catchment surface during winter; if the soil is not frozen, this water seeps out, filling the soil horizons; if it is frozen, surface runoff and flash flooding occur. In further thaws, high soil moisture contributes to the formation of flow peaks, since the water has nowhere to be filtered. The calculated results presented in this work confirm a number of previous findings about the change and transformation of the water regime of the ETR Rivers.
1. Barabanov A.T., Dolgov S.V., Koronkevich N.I., Panov V.I., Petelko A.I. (2018). Surface runoff and melt infiltration into the soil on arable land in the forest-steppe and steppe zones of the East European Plain, Soil Science, 1, 62-69.
2. Beurton S. and Thieken A. (2009). Seasonality of floods in Germany, Hydrological Sciences Journal, 54, 1, 129-141.
3. Blöschl G., Hall J., Parajka J., Rui P. A.P., Merz B., Arheimer B., Giuseppe A.T., Bilibashi A., Bonacci O., Borga M., Čanjevac I., Castellarin A., Giovanni C.B., Claps P., Fiala K., Frolova N., Gorbachova L., Gül.A., Hannaford J., Harrigan S., Kireeva M. et al. (2017). Changing climate shifts timing of european floods, Science, 357, 6351, 588-590.
4. Cunderlik J.M. and Burn D.H. (2001). The use of flood regime information in regional flood frequency analysis, Hydrological SciencesJournal-des Sciences Hydrologiques, 47, 1.
5. Eckhardt K. (2005). How to Construct Recursive Digital Filters for Baseflow Separation, Hydrological Processes, 19(2), 507-515.
6. Finch J., Marsh T., McKenzie A. (2007). A preliminary risk assessment of the potential for groundwater flooding during the winter of 2007/8 – an update, Wallingford, NERC/Centre for Ecology and Hydrology-British Geological Survey, 23.
7. Frolova N.L., Agafonova S.A., Kireeva M.B., Povalishnikova E.S., Pakhomova O.M. (2017). Recent changes of annual flow distribution of the Volga basin rivers in Geography, Environment, sustainability. 10(2), 28-39, DOI: 10.24057/2071-9388-2017-10-2-28-39.
8. Hall J. and Blöschl G. (2018). Spatial patterns and characteristics of flood seasonality in Europe, Hydrol. Earth Syst. Sci., 22, 3883-3901, DOI: 10.5194/hess-22-3883-2018.
9. Kireeva M., Frolova N., Rets E., Samsonov T., Entin A., Kharlamov M., Telegina E., Povalishnikova E. (2019. Evaluating climate and water regime transformation in the European part of Russia using observation and reanalysis data for the 1945–2015 period, International Journal of River Basin Management, DOI: 10.1080/15715124.2019.1695258.
10. Kislov A., Sokolikhina N., Semenov E., Tudriy K. (2017). Blocking Anticyclone in the Atlantic Sector of the Arctic as an Example of an Individual Atmospheric Vortex, Atmospheric and Climate Sciences, 7, 323-336, DOI: 10.4236/acs.2017.73024.
11. Koronkevich N.I., Georgiadi A.G., Dolgov S.V., Barabanova E.A., Kashutina E.A., Milyukova I.P. (2018). Change in snow flood flow in the southern macro-slope of the Russian Plain in the period 1930–2014, 58 (4), 498-506 (in Russian), DOI: 10.15356/2076-6734-2018-4-498-506.
12. Marsh T.J. and Hannaford J. (2007). The summer 2007 floods in England and Wales – a hydrological appraisal, Wallingford, Centre for Ecology and Hydrology, 30.
13. Nathan R.J. and McMahon T.A. (1990). Evaluation of Automated Techniques for Baseflow and Recession Analysis, Water Resources Research, 26(7), 1465-1473.
14. Parajka J., Kohnová S., Bálint G., Barbuc M., Borga M., Claps P., Cheval S., Dumitrescu A., Gaume E., Hlavcˇová K., Merz R., Pfaundler M., Stancalie G., Szolgay J., Blöschl G. (2010). Seasonal characteristics of flood regimes across the Alpine–Carpathian range, Journal of Hydrology 394, 78-89.
15. Petrow T. and Merz B. (2009). Trends in flood magnitude, frequency and seasonality in Germany in the period 1951–2002, Journal of Hydrology, 371, 1-4.
16. Shevnina E.V. (2013). Methodology for calculating the characteristics of spring flood according to daily water discharge, Problems of the Arctic and Antarctic, 1(95), 44-50 (in Russian).
17. Van Loon A.F. and Laaha G. (2015). Hydrological drought severity explained by climate and catchment characteristics, Journal of Hydrology, 526, 3-14, DOI:10.1016/j.jhydrol.2014.10.059.
18. Volchek A.A. and Shelest T.A. (2012). Formation of winter floods on the rivers of Belarus, Scientific notes of the Russian State Hydrometeorological University, Rubric: Hydrology, 25, 5-19 (in Russian).
Faculty of Geography
Leninskie Gory, 1, Moscow, 1199911
Faculty of Geography
Leninskie Gory, 1, Moscow, 1199911
Faculty of Geography
Leninskie Gory, 1, Moscow, 1199911
Faculty of Geography
Leninskie Gory, 1, Moscow, 1199911
Faculty of Geography
Leninskie Gory, 1, Moscow, 1199911
Faculty of Geography
Leninskie Gory, 1, Moscow, 1199911
Faculty of Geography
Leninskie Gory, 1, Moscow, 1199911
Kireeva M.B., Rets E.P., Frolova N.L., Samsonov T.E., Povalishnikova E.S., Entin A.L., Durmanov I.N., Ivanov A.M. Occasional Floods On The Rivers Of Russian Plain In The 20Th –21St Centuries. GEOGRAPHY, ENVIRONMENT, SUSTAINABILITY. 2020;13(2):84-95. https://doi.org/10.24057/2071-9388-2020-29

Editor-in-Chief
Kasimov Nikolay S.Lomonosov Moscow State University
Moscow 119991 Russia, Leninskie Gory, Faculty of Geography, 1806a
Phone +7 495 939-15-52
E-mail: ges-journal@geogr.msu.ru


