



Contents
Scroll to:
https://doi.org/10.24057/2071-9388-2026-2423
Scroll to:
The runoff and climatic characteristics averaged over the basins of major rivers of the East European Plain (Northern Dvina, Pechora, Volga, Don, and Dnieper) and Siberia (Ob, Yenisei, and Lena) under global warming were analyzed. This analysis was based on both observational data and estimates obtained from global climate models (GCMs) under a baseline period (1930s–1980), contemporary global warming conditions (1981–2010), and scenario-based anthropogenic global warming projections into the mid-21st century (2040–2069). The main results suggest that long-term averaged annual runoff estimates derived from an ensemble of 18 CMIP6 GCMs do not accurately reproduce the observed runoff during either the contemporary global warming or baseline periods. Nevertheless, these models generally capture the direction of runoff changes between these two periods, though they tend to underestimate the magnitude of these changes. Consequently, multi-model mean projections are useful in estimating the relative changes in runoff under different global warming scenarios. A key finding of this study is that selecting GCMs that can best reproduce the most reliably observed river runoff and climatic characteristics of river basins under contemporary global warming can improve ensemble model estimates of runoff. In addition, it was found that basin-averaged observed and modeled annual atmospheric precipitation over the Northern Dvina basin, obtained from the RIHMI-WDC archive (after applying all relevant corrections) and multi-model mean data, respectively, were closely aligned. This was in contrast to data of reanalysis and data that only included wetting corrections from the CRU archive.
Georgiadi A.G., Barabanova E.A., Milyukova I.P., Morozova P.A., Narykov A.N. Annual Runoff and Climate Characteristics in large River Basins of Northern Eurasia under Global Warming. GEOGRAPHY, ENVIRONMENT, SUSTAINABILITY. 2026;19(1):167-180. https://doi.org/10.24057/2071-9388-2026-2423
The impact of global warming on river flow is a central issue in modern hydrology. Research in this field has developed in two main directions, which differ in the type and source of data used, as well as in their methods.
The first direction focuses on analyzing changes that have occurred during periods for which long-term, regular observational data on runoff characteristics are available, along with climatic and anthropogenic factors that significantly influence river runoff. This branch of research utilizes a wide range of analytical techniques, including time series analysis, regression relationships, balance methods, and, to a much lesser extent, hydrological modeling. This research direction has been active for many years, with studies examining (1) long-term phases of increased/decreased water flow and other components of georunoff (Muraveisky 1960), which represent one of the major components of long-term hydrological variability (Bolgov et al. 2018; Frolova et al. 2022; Georgiadi and Kashutina 2016; Georgiadi et al. 2018; Georgievsky 2021; Sharma and Singh 2017; Shi et al. 2019; Shpakova and Wang 2023) and (2) the impact of contemporary global warming on runoff as well as its contribution to observed changes in runoff (Georgiadi et al. 2014). A key element of this research is the development and application of methods for naturalizing long-term series of natural runoff characteristics (Georgiadi and Milyukova 2023; Shiklomanov et al. 2011).
The second research direction involves the development and application of methods for assessing probable changes in river runoff under future climate scenarios. These methods rely on climate change projections obtained through numerical experiments with global climate models (GCMs). There are two main approaches used to develop models for runoff estimation. The first is the “hydrological” approach, which utilizes hydrological models with varying levels of detail to simulate river runoff formation using climatic data from GCM-based global warming projections as inputs. In contrast, the “climatological” approach estimates river runoff from GCM outputs, either by recording changes in river runoff as calculated directly by GCMs or simulating changes with reference to the water balance equation and model estimates of precipitation and evapotranspiration.
In recent decades, a large number of studies have been conducted using these two approaches to assess potential changes in the flow of Russian rivers under anthropogenic warming scenarios projected for the 21st century (Dobrovolski et al. 2019; Döll et al. 2018; Gelfan et al. 2022; Georgiadi and Milyukova 2002; Georgiadi et al. 2011, 2014; Georgievsky et al. 1996; Guo et al. 2022; Gusev and Nasonova 2010; Kattsov and Govorkova 2013; Kislov et al. 2008; Mokhov et al. 2003; Motovilov and Gelfan 2019; Shiklomanov 2008; Yang and Kane 2021). However, estimates derived from GCM-based simulations exhibit a significant inter-model spread in both present-day climate characteristics (and consequently river runoff) and projected future changes.1 This variability can be attributed to a variety of factors, including differences in the parameterization of processes used in GCMs, differences in major socio-economic and demographic characteristics (e.g., economic growth, technology, population, and management), changes in the optical properties of the atmosphere, and different levels of projected greenhouse gas and aerosol emissions into the atmosphere (Abramowitz et al. 2019; Anisimov and Kokorev 2013; Guo et al. 2022; Lehner et al. 2020; Motovilov and Gelfan 2019).
Consequences, studies on scenario-based changes in hydroclimatic characteristics often rely on averaging the results obtained from an ensemble of GCMs, especially since multi-model ensembles can help reduce the uncertainties associated with the climate system (Abramowitz et al. 2019; Guo et al. 2022; Lehner et al. 2020). Averaged climate characteristics derived from global data archives and electronic atlases2,3 and scenario forecasts based on Coupled Model Intercomparison Project Phase 6 (CMIP6) global models can also be included to obtain higher resolution ensembles4,5. This ensemble-based approach can potentially be extended to the multi-model averaging of river flow estimates. However, researchers must consider whether all GCMs should be included in such ensembles to obtain more reliable runoff projections.
Considerable attention has also been given to the accuracy of observational climate data, which is crucial for addressing issues associated with the use of GCMs both in developing future scenario assessments (i.e., during the 21st century) and in analyzing the hydroclimatic impacts of contemporary global warming, including river runoff. This is particularly true for precipitation data collected in global and regional archives (Bogdanova et al. 2002; Fekete et al. 2004; Georgiadi et al. 2014; Groisman et al. 1996; Harding et al. 2011; Ye et al. 2004), where substantial discrepancies have been observed across different datasets (Harding et al. 2011).
This study provides a comparative analysis of river runoff in large Northern Eurasia River basins (on the East European Plain and in Siberia) as well as basin-averaged climatic characteristics that influence river runoff. This analysis uses observational data as well as GCM-derived outputs under present-day global warming conditions and for mid-21st century anthropogenic warming scenarios (2040–2069). The study utilizes long-term observational data of river runoff, precipitation, and air temperature from global and regional archives, reanalysis data, reconstructed natural runoff characteristics, and CMIP6-derived estimates of current and projected hydroclimatic changes. One of the main objectives of this study is to assess how accurately the averaged characteristics from multi-model ensembles reproduce the annual runoff and climatic characteristics in major Northern Eurasian River basins as observed during the period of contemporary global warming, as well as the preceding baseline interval.
This study focused on large rivers with basins located in the East European Plain and Siberia (Fig. 1). These river basins exhibit noticeably different natural conditions (Table 1), as well as varying combinations and intensities of anthropogenic impacts on river runoff.

(1) Northern Dvina–Ust’-Pinega, (2) Pechora-Oksino, (3) Volga–Volgograd, (4) Dnieper–Lotsmanskaya Kamenka, (5) Don–Razdorskaya, (6) Ob’–Salekhard, (7) Yenisei–Igarka, (8) Lena–Kyusyur.
Fig. 1. Schematic map of the studied river basins
Table 1. Main characteristics of the studied river basins
|
River–gauge |
Basin area*, 10³ km² |
Average elevation of the basin, in meters/proportion of the basin with elevation ≥ 1000 m, % (SRTM 2025) |
Share of main natural zones**, % of the basin area (ArcAtlas 1996) |
Permafrost share (all types), % of the entire basin area (Brown et al. 2002) |
Main reservoirs’ total capacity, km³ (Barabanova 2004) |
|
Northern Dvina–Ust’-Pinega |
348 (357) |
143/0 |
T – 100 |
0 |
0 |
|
Pechora–Oksino |
312 (322) |
164/0.5 |
Tu –35 T – 65 |
44.3 |
0 |
|
Volga–Volgograd |
1360 (1369) |
183/0 |
T – 34 M&BLF – 40 FS – 15 S – 9 |
0 |
168 |
|
Dniepr–Lotsmanskaya Kamenka |
459 (504) |
168/0 |
M&BLF –77 FS – 15 S – 8 |
0 |
44.5 |
|
Don–Razdorskaya |
378 (422) |
153/0 |
M&BLF – 5 FS – 63 S – 32 |
0 |
28 |
|
Ob’–Salekhard |
2450 (2990) |
292/6.4 |
T – 29.7 M&BLF – 7 FS – 11 S – 25 SD&D – 6 I – 21 |
39.2 |
65.4 |
|
Yenisei–Igarka |
2440 (2620) |
753/27.3 |
Tu – 8 T – 58 FS – 17 S – 11 |
84.6 |
393 |
|
Lena–Kyusyur |
2430 (2490) |
594/17 |
Tu – 22 T – 71 I – 7 |
94 |
35.9 |
* In brackets – the entire basin area;
** TU – tundra, T – taiga, M&BLF – zone of mixed and broad-leaved forests, FS – forest-steppe, S – steppe, SD&D – semi-deserts and deserts, I – Intrazonal landscapes (swamps and others).
In the studied river basins, the majority of the annual runoff (45–65%) occurs during the spring–summer flood period due to melting snow cover (Kuzin and Babkin 1979). In the summer-autumn seasons, the main sources of river runoff include precipitation and underground runoff (accounting for 16–30% of annual runoff). The lowest runoff is observed during the winter low-water period, comprising only 10–20% of the annual total.
In recent decades, substantial changes have been observed in both annual runoff and its intra-annual distribution across basins in Northern Eurasia (Frolova et al. 2022; Georgiadi et al. 2014, 2024; Georgievsky 2021; Shiklomanov 2008).
The study used annual hydroclimatic characteristics, including river runoff, total precipitation, and evapotranspiration (calculated based on water balance), as well as air temperature data obtained from global and regional archives. These values were averaged over two key periods: the period of modern global warming (1981–2010) and a baseline period (1930s–1980). The rationale for selecting these time intervals is discussed in the Methods section.
Annual river runoff
Long-term runoff records from the data archives of the Russian Hydrometeorological Service were used for large rivers with water regimes close to natural conditions (e.g., Northern Dvina, Pechora) as well as for rivers with naturalized runoff data. It should be noted that these reconstructions exclude anthropogenic changes caused by reservoirs and consumptive water withdrawal for use in industry. These observations were used as initial data to calculate average long-term annual runoff for the periods indicated above.
The long-term series were naturalized by transforming the annual hydrograph of daily water discharges using the Kalinin–Milyukov technique (Kalinin and Milyukov 1958). This approach yielded reconstructed long-term time series data on daily discharges for the Don, Ob, Yenisei, and Lena rivers (Georgiadi and Milyukova 2023; Yang and Kane 2021). The naturalization of annual and seasonal river flow for the Dnieper at Lotsmanskaya Kamenka and the Volga at Volgograd was based on regression relationships with the flow of tributaries and upper parts of the main rivers, which was not significantly changed by anthropogenic impact (Georgiadi et al. 2014).
Annual climatic characteristics
Long-term average annual precipitation values for the two key periods described above were calculated using data from two archives. Specifically, global gridded atmospheric precipitation and air temperature data (with a spatial resolution of 0.5°) were obtained from the Climatic Research Unit gridded Time Series (CRU TS) archive v. 3.106 prepared by the Climate Research Unit in the University of East Anglia (Norwich, UK; Harris et al. 2013). These gridded data were derived from the interpolation of meteorological measurements taken from a network of stations. In addition, atmospheric precipitation data were obtained from the RIHMI-WDC archive7 for the Roshydromet observation network in Russia. This archive comprises two datasets: the first dataset (the RIHMI-WDC) contains wetting corrections starting from the mid-1960s, while the second dataset (the RIHMI-WDCcor), prepared at the Voeikov State Geophysical Observatory (SGO), incorporates corrections that account for key causes of measurement distortions, including aerodynamic effects (Bogdanova et al. 2002). Data from the first dataset were used in the preparation of the global CRU grid archive.
In addition, the average annual precipitation obtained from the reanalysis data was used to prepare data for the Northern Dvina basin. Specifically, data from the NCEP/NCAR (Kalnay et al. 1996), MERRA2 (Gelaro et al. 2017), and ERA5-Land (Muñoz Sabater 2019) climate reanalysis products were obtained from the Mapping and Data Analysis System for the SESTRA project5, where they were aggregated based on the MERIT-Hydro-river network with a 5-minute spatial resolution (Yamazaki et al. 2019).
Runoff, atmospheric precipitation, evapotranspiration, and air temperature data for the two study periods were obtained by averaging outputs obtained from the CMIP6 GCMs (Eyring et al. 2016; O’Neil et al. 2016). Monthly-resolution data from four experiments were used: historical, SSP 1-2.6, SSP 2-4.5, and SSP 5-8.5.
In the historical experiment, forcings were specified according to observational data for the period 1850–2014. In the scenario experiments (SSP 1-2.6, SSP 2-4.5, and SSP 5-8.5), forcings were specified according to different Shared Socioeconomic Pathways (SSP) for the period 2015–2100. The SSPs represent different levels of anthropogenic load: SSP 1-2.6 assumes a low level of greenhouse gas emissions and a reduction to zero values by 2075 (favorable scenario with insignificant warming expected); SSP 2-4.5 assumes that emissions remain at current levels until 2050 before gradually decreasing (moderate warming); and SSP 5-8.5 represents a high emissions scenario in which emissions double by 2050 (extreme scenario, strong warming). By 2100, the corresponding radiative anthropogenic forcing in these experiments reaches values of 2.6 W/m², 4.5 W/m², and 8.5 W/m², respectively.
Ensemble estimates were based on data obtained from 18 GCMs with relatively high spatial resolution used for scenario-based climate forecasts at the Climate Center of Roshydromet8. The model outputs were averaged annually and bilinearly interpolated to grid points with a resolution of 0.5°. The data were averaged over 1931–1980 (baseline period), 1981–2010 (contemporary global warming), and 2040–2069 (scenario projection period). In addition, all data were spatially averaged over the studied river basins.
This study aimed to address several research problems. First, an assessment of the accuracy of the reproduction of observed annual runoff and annual climatic characteristics of large rivers of the East European Plain and Siberia from the outputs of a multi-model mean (MMM) derived from 18 CMIP6 GCMs. This was evaluated based on comparisons between (1) the model and observed average hydroclimatic characteristics during the periods of contemporary global warming and the baseline period, and (2) the differences between the model and observed data between these two periods.
Second, this study aimed to identify the spatial and temporal features of changes in annual river runoff, precipitation, air temperature, and evapotranspiration during the period of contemporary global warming and in the mid-21st century relative to the baseline period.
Finally, this study aims to compare the projected changes in annual runoff and climate characteristics under the different global warming scenarios for 2040–2069 relative to their model-derived baseline values based on CMIP6 MMM data.
Estimates of runoff and climate characteristics (see Section 3 for more details on data preparation) and their changes under contemporary global warming were obtained by comparing the mean values obtained from two climatically distinct periods: modern global warming and the baseline period (Georgiadi and Kashutina 2016; Georgievsky 2021; Shiklomanov 2008). The modern period of global warming is generally considered to have started in 1981, while the baseline period (1930s–1980) has historically been used to calculate long-term river runoff characteristics in Russia9. For the CMIP6 ensemble and CRU archive data, as well as for river runoff data of the Pechora, Northern Dvina, Volga, Don, and Dnieper the base period 1931–1980 was used to calculate average hydroclimatic characteristics. For river runoff data of the Ob’, Yenisei, and Lena and precipitation data from the RIHMI-WDC archive, the period 1936–1980 was used.
The transition between these two periods is thought to have occurred in the 1970s–1980s, where there is a noticeable increase in air temperature as well as changes to the long-term phases (lasting 10–15 years or more) of decreased/increased runoff in many rivers (Georgiadi and Kashutina 2016; Georgiadi and Milyukova 2023; Georgiadi et al. 2014, 2018; Georgievsky 2021; Shiklomanov 2008). However, it should be noted that the onset of warming was not simultaneous across river basins: based on the analysis of long-term phases in multi-year changes in annual and winter air temperatures averaged over the basins of large rivers (Volga, Don, Pechora, Yenisei, Lena), the transition to increased annual and winter air temperatures occurred gradually throughout the 1970s–1980s (Georgiadi and Kashutina 2016; Georgiadi and Milyukova 2023; Georgiadi et al. 2014). Indeed, in some basins such as the Northern Dvina, Lena and Don, this transition only became evident in the second half of the 1980s, especially for winter air temperatures (Georgiadi and Kashutina 2016; Georgiadi and Milyukova 2023; Georgiadi et al. 2014).
In terms of precipitation, the transition to a long-term phase of increased precipitation can be dated to the 1960s–1970s and even to the 1950s (Georgiadi and Kashutina 2016; Georgiadi and Milyukova 2023; Georgiadi et al. 2014). However, determining the exact onset of this change is complicated by the significant heterogeneity of long-term precipitation time series, especially due to the introduction of wetting corrections in the 1960s (Georgiadi and Kashutina 2016).
Finally, the timing of long-term phase shifts in annual and seasonal runoff varies among individual rivers and regions and often does not coincide with the onset of modern warming or the increase in air temperature (Frolova et al. 2022; Georgiadi and Kashutina 2016; Georgiadi and Milyukova 2023; Georgiadi et al. 2014).
As with the assessment of hydroclimatic changes under contemporary global warming, estimated changes in runoff and climate characteristics were evaluated by comparing the model-averaged values obtained for each projected global warming scenario and the baseline period. Ensemble-averaged data from the CMIP6 GCMs were used.
Annual and seasonal runoff
During the period of contemporary global warming (1981–2010), most rivers flowing into the Arctic Ocean (including the Northern Dvina, Pechora, Yenisei, and Lena rivers), as well as the Volga basin, experienced increases in both annual and seasonal runoff (Fig. 2). In contrast, the annual runoff in the Dnieper increased due to increased summer–autumn and winter runoff, while flood runoff decreased. The annual runoff of the Don is decreasing due to a significant decrease in snowmelt flood runoff, while the runoff of low flow seasons are increasing. Annual and snowmelt flood runoff in the Ob’ River exhibited little change during this period, though there has been a decrease in summer-autumn runoff and an increase in winter runoff.

Fig. 2. Flood runoff (Fl), summer–autumn (SA), winter (W), and annual runoff (A) in (1) the baseline period and (2) the period of contemporary global warming
The differences in runoff between the period of modern global warming and the baseline period are largely expressed in changes to the long-term runoff phases of increased/decreased annual runoff (lasting 10–15 years or more) as well as runoff during the main hydrological seasons. Specifically, these phases differ in terms of their duration, the timing of their phase transitions, and the magnitude of the differences between the average runoff during periods of increased and decreased runoff (Georgiadi et al. 2024).
Climatic characteristics
Based on data from the CRU global archive, an increase in annual runoff was observed during the period of contemporary global warming against the background of rising average annual air temperatures and precipitation (except for the Yenisei basin) (Table 2). The most pronounced increase in precipitation occurred in the Northern Dvina, Pechora, and Volga basins. The rise in mean air temperature averaged across all basins ranged from 0.7 to 1.1°C.
Table 2. Annual runoff of large rivers and annual precipitation and air temperature averaged for their basins according to the CRU archive data
|
River |
Base period |
Period of contemporary global warming |
||||
|
runoff, mm |
precipitation, mm |
air temperature, °C |
runoff, mm |
precipitation, mm |
air temperature, °C |
|
|
Northern Dvinaa |
283 |
584 |
0.9 |
301 |
612 |
1.6 |
|
Pechoraa |
445 |
500 |
-3.4 |
475 |
529 |
-2.8 |
|
Volgab |
181 |
527 |
3.4 |
196 |
556 |
4.4 |
|
Dnieperb |
109 |
559 |
6.9 |
116 |
569 |
7.7 |
|
Donb |
64 |
456 |
7.0 |
59 |
466 |
7.8 |
|
Ob’b |
164 |
426 |
-0.7 |
163 |
429 |
0.4 |
|
Yeniseib |
237 |
438 |
-6.2 |
253 |
431 |
-5.2 |
|
Lenab |
214 |
356 |
-10.5 |
231 |
357 |
-9.5 |
aobserved runoff is close to natural conditions
bnaturalized runoff (excluding anthropogenic changes)
This section compares the annual runoff and climate characteristics obtained from both long-term observational time series and the mean values obtained from the MMMs of 18 CMIP6 GCMs over the period of contemporary global warming and the reference period.
Annual runoff
A comparison of the annual runoff derived from observed (Northern Dvina and Pechora) and naturalized (Volga, Dnieper, Don, Ob’, Yenisei, Lena) time series data and the modeled annual runoff of these rivers obtained from CMIP6 MMM data over the study periods indicates that the modeled runoff underestimates the observed (naturalized) runoff of rivers flowing into the Arctic Ocean (Fig. 3), except for the Northern Dvina, where the modeled runoff slightly overestimates the observed runoff. In contrast, for rivers on the southern macroslope of the East European Plain (the Volga, Dnieper, and Don), the modeled runoff overestimates the observed runoff.

Fig. 3. The percentage difference between CMIP6 MMM data and observed runoff over (1) the baseline period and (2) the period of contemporary global warming
It should be noted that the greatest underestimations occurred in basins where a significant proportion of runoff is generated by mountainous areas or in regions where permafrost occupies a significant portion of the basin, including the Pechora (runoff underestimated by 18–20%), the Yenisei (18–19%), and the Lena (7–10%).
In contrast, the greatest overestimations occurred in basins where forest–steppe and steppe zones account for a significant proportion of the region, such as the Don (runoff overestimated by 76–84%) and the Dnieper (27–33%). The discrepancies between observed and modeled runoff are generally smaller for Siberian rivers, than for rivers in the East European Plain.
Atmospheric precipitation
The differences between the observed (from the CRU archive) and simulated annual precipitation were quite significant, ranging from 20–49% for the period of contemporary global warming and 20–46% for the baseline period (Fig. 4a). The largest discrepancies were observed in the Lena River basin for both periods. In general, river basins of the Russian Plain exhibited smaller differences than river basins in Siberia.
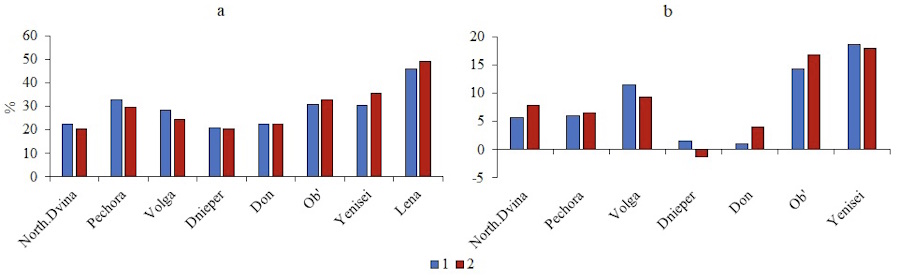
Fig. 4. The difference (%) between the average basin annual precipitation over (1) the baseline period and (2) the period of modern global warming, averaged over the ensemble of CMIP6 GCMs and determined based on data from (a) CRU and (b) RIHMI-WDCcor archives
Similarly, there were differences between the CMIP6-simulated annual precipitation data and the annual precipitation data obtained from the RIHMI-WDCcor archive (see Section 3) (Fig. 4b). In general, the modeled precipitation data overestimated the observed precipitation, though the differences between them were much smaller than when compared with data from the CRU archive (Fig. 4a). Specifically, in the Yenisei, Lena, and Volga basins, CMIP6 precipitation exceeds observations by 12–19% during the baseline period and 9–18% under contemporary global warming. In contrast, model estimates were lower than the corrected observed precipitation only in the Dnieper River basin, though these differences did not exceed 1%.
The long-term average annual precipitation over the Northern Dvina basin obtained from reanalysis data (NCEP, ERA5, and MERRA2) significantly exceeded both the CMIP6 model values as well as observed atmospheric precipitation from the global CRU, regional RIHMI-GDC, and RIHMI-GDCcor archives (Fig. 5). Notably, the CRU-based precipitation values and the RIHMI-GDC precipitation values with wetting corrections were practically identical for the Northern Dvina basin (Fig. 5). This is because the CRU dataset for Russia is primarily derived from data of meteorological station observations that already include wetting corrections.

Fig. 5. Average annual atmospheric precipitation for period of modern global warming over the Northern Dvina River basin based on NCEP, ERA5, MERRA2, CRU, RIHMI-GDC, and RIHMI-WDCcor archives as well as CMIP6 ensemble averages
Annual total evapotranspiration
This section compares annual evapotranspiration during the period of contemporary global warming and the baseline period using several estimation methods (Table 3). Specifically, total evapotranspiration values from CMIP6 ensemble means (CMIP6d) were compared with evapotranspiration calculated from the residual of the average long-term water balance equation for the study periods using annual precipitation and river runoff obtained from observational data. Inputs included annual precipitation from the CRU archive (CRUa), corrected data from the RIHMI-GDCcor (RIHMI-GDCcorb) archive, and using observed annual runoff and precipitation from CMIP6 data (CMIP6c).
Table 3. Total annual evapotranspiration (mm) obtained from ensemble-averaged data from CMIP6 GCMs, as well as average long-term observational data calculated using the water balance equation*
|
River |
Evapotranspiration in the base period |
Evapotranspiration during the modern global warming period |
||||||
|
CRUa |
RIHMI-GDCcorb |
CMIP6c |
CMIP6d |
CRUa |
RIHMI-GDCcorb |
CMIP6c |
CMIP6d |
|
|
Northern Dvina |
301 |
395 |
433 |
401 |
311 |
383 |
437 |
410 |
|
Pechora |
55 |
181 |
219 |
293 |
54 |
169 |
211 |
301 |
|
Volga |
346 |
426 |
496 |
465 |
360 |
437 |
496 |
477 |
|
Dnieper |
450 |
n.d.a. |
567 |
529 |
453 |
n.d.a. |
570 |
537 |
|
Don |
392 |
486 |
467 |
429 |
407 |
519 |
474 |
441 |
|
Ob’ |
262 |
388 |
394 |
398 |
266 |
385 |
407 |
406 |
|
Yenisei |
201 |
263 |
334 |
364 |
178 |
248 |
332 |
371 |
|
Lena |
142 |
216 |
306 |
306 |
126 |
221 |
302 |
312 |
*See the text for explanations of evapotranspiration calculation methods in this Section.
It should be noted that the ensemble-averaged evapotranspiration calculated directly from the GCMs, the evapotranspiration obtained from the water balance equation using CMIP6 precipitation, and the observed runoff for some Siberian rivers, such as the Ob’ and Lena, were quite similar. This similarity can be explained by the small difference between the modeled and observed runoff for these rivers: the smaller the difference between the modeled and observed runoff, the smaller the difference in evapotranspiration. Indeed, the difference in evapotranspiration was more significant for other rivers, such as the Pechora River basin, where modeled evapotranspiration can exceed the observed evapotranspiration by almost 50% due to the underestimation of runoff and precipitation in this basin.
Across all river basins, the lowest evapotranspiration estimates were obtained when using the water balance calculation with CRU precipitation data and observed runoff, primarily due to the underestimated precipitation in the CRU archive. The discrepancy is particularly noticeable for the Arctic rivers as well as the Volga basin. The largest discrepancy occurs in the Pechora basin, where evapotranspiration estimates based on CRU data are up to six times lower than other methods.
In contrast, evapotranspiration calculated using the water balance equation with corrected precipitation data from the RIHMI-GDCcor archive and observed (naturalized) runoff was much closer to the estimated evapotranspiration obtained from CMIP6 MMM data. However, in cases where model runoff or precipitation is significantly underestimated compared to their observed values, these evapotranspiration estimates turn out to be significantly lower than those obtained using the CMIP6 MMM data (e.g., Pechora, Yenisei, and Lena).
Finally, evapotranspiration estimates obtained from the use of atmospheric precipitation derived from reanalysis data and observed runoff in water balance calculations significantly exceeded the evapotranspiration estimates from CMIP6 MMM data (Fig. 6). For example, in the Northern Dvina basin, the evapotranspiration estimates obtained from reanalysis data were 527 mm (MERRA2), 534 mm (NCEP), and 753 mm (ERA5) under contemporary global warming.

Fig. 6. Annual evapotranspiration in the Northern Dvina basin for period of modern global warming, calculated by averaging data from the CMIP6 GCMs ensemble and using the long-term average water balance equation. Further details on the evapotranspiration calculation methods used in this study can be found in Section 5.2.3
Air temperature
The difference between the ensemble-averaged annual air temperature obtained from CMIP6 models and observed values from the CRU archive exhibited consistent signs for both the baseline period and the period of contemporary global warming (Table 2; Fig. 7). The sole exception is the Ob’ river basin, where the sign of the difference between the modeled and observed annual air temperature was different across the two study periods, though the magnitude of the discrepancy was among the smallest across all basins. Model results underestimated the observed air temperature in the Northern Dvina, Pechora, Volga, and Dnieper basins, while temperatures were overestimated in the Yenisei, Lena, and Don basins.

Fig. 7. The difference between the CMIP6 model-derived and CRU archive-derived air temperature data over (1) the baseline period and (2) the period of modern global warming
This section compares the changes in annual hydroclimatic characteristics during the period of contemporary global warming relative to the baseline period based on observational data and CMIP6 MMM data.
Annual runoff
The direction of the relative changes in annual runoff obtained from ensemble-averaged CMIP6 GCMs and observational data under contemporary global warming relative to the baseline period (as a percentage of the annual runoff of the baseline period) was the same for most rivers, with the exception of the Don and Ob’ (Fig. 3, 8, Table 2). For these two rivers, the modeled data indicated an increase in runoff, while the observed data revealed a decrease in runoff; this was particularly pronounced for the Don. The largest discrepancies between the modeled and observed changes in runoff were observed in the Volga, Dnieper, and Lena rivers. It should be noted that the difference in annual runoff between the two study periods did not exceed 10% and 5% for the observed and modeled data, respectively. In general, the ensemble-averaged model tended to underestimate the magnitude of changes in annual runoff compared to observational data.

Fig. 8. Changes in annual runoff (∆, %) during the period of contemporary global warming compared to the annual runoff of the baseline period, calculated using (1) long-term observational data and (2) CMIP6 MMM data
Atmospheric precipitation
The direction of relative changes in annual precipitation according to CMIP6 MMM data and observational data from the CRU archive over the two study periods was the same in most river basins with the exception of the Yenisei basin (Fig. 9). Observed precipitation in the Yenisei basin decreased under contemporary global warming, while the model calculations indicated an increase. Changes in observed precipitation obtained from the CRU archive were significantly larger than the precipitation obtained from CMIP6 MMM data in several river basins of the Russian Plain, including the Northern Dvina, Pechora, and Volga. In contrast, the differences in observed and modeled precipitation were almost identical for the Dnieper and Don basins. Finally, the differences in observed precipitation changes were lower than the model estimates for the Siberian River basins (e.g., Ob’ and Lena).

Fig. 9. Changes in annual precipitation (∆, %) during the period of contemporary global warming compared to the baseline period, calculated using long-term data from the (1) CRU, and (2) RIHMI-GDCcor archives, and (3) CMIP6 MMM data
Precipitation data obtained from the RIHMI-GDCcor archive also exhibits increases during contemporary global warming, except for the Ob’ basin. This increase was greater than the CMIP6 MMM estimates for the Volga, Don, and Lena River basins, but smaller than the model estimates for the Northern Dvina, Pechora, and Yenisei basins. Notably, in the Don basin, RIHMI-GDCcor data indicate an increase in precipitation that substantially exceeds both the CMIP6 ensemble estimate and the CRU observations.
Evapotranspiration
Under contemporary global warming, evapotranspiration increases in all river basins according to the CMIP6 MMM data (Fig. 10). Evapotranspiration also increases in most river basins when calculated using the water balance equation with modeled precipitation and runoff obtained from observational data; however, there are some river basins in which evapotranspiration does not change (the Volga basin), decreases slightly (Yenisei and Lena basins), or decreases significantly (Pechora basin). These differences arise from discrepancies between the modeled and observed runoff during the baseline and contemporary warming periods.

Fig. 10. Changes in annual evapotranspiration (∆, %) during the period of contemporary global warming compared to the baseline period, calculated with the water balance equation using averaged long-term observational runoff and precipitation data from the (1) CRU and (2) RIHMI-GDCcor archives, (3) the water balance equation using observed runoff data and CMIP6 model estimates of atmospheric precipitation, and (4) the result of evapotranspiration calculations obtained from CMIP6 ensembles
Evapotranspiration calculated with the water balance equation using precipitation data from the CRU archive and observed runoff is generally consistent with the estimates obtained from the CMIP6 ensemble; the only exceptions were the Pechora, Yenisei, and Lena basins, where evapotranspiration changes were found to have different signs. In contrast, when using precipitation data from the RIHMI-GDCcor archive and observed runoff, the sign of evapotranspiration changes in Arctic river basins differed from those obtained from the CMIP6 ensemble (except for the Pechora and Lena rivers), while remaining the same in the Don basin. In the Volga basin, direct CMIP6 calculations indicated no change in evapotranspiration.
In general, evapotranspiration changes remained within ±7% of the baseline period, with only the Yenisei and Lena basins exceeding 11% when calculating using CRU precipitation data.
Air temperature
During the period of contemporary global warming, air temperature increased in all basins, both in the observed CRU data and in the CMIP6 GCM ensemble averages (Fig. 11). Observed increases ranged from 0.6°C in the Pechora basin to 1.1°C in the Ob’ basin according to observed data and from 0.7°C in the Dnieper and Yenisei basin to 1°C in the Pechora basin according to ensemble data.

Fig. 11. Changes in annual air temperature (∆, ºC) during the period of modern global warming compared to the baseline period, calculated using (1) the CMIP6 MMM data and (2) long-term data from the CRU global archive
In most basins, the modeled temperature increase is slightly lower than the observed increase, though the opposite is true for the Northern Dvina and Pechora basins. The most noticeable discrepancies were observed in the Pechora, Yenisei, and Ob’ basins.
The results show that estimates of runoff and other climate characteristics derived from the 18 CMIP6 GCM ensemble can differ significantly from their observed values in several river basins. This is consistent with previous studies using CMIP5 data (Georgiadi et al. 2024; Georgievsky and Golovanov 2015, 2019; Guo et al. 2022). Modeled trends in runoff and climate characteristics under modern global warming compared to the baseline period also differed from observed data.
Despite these issues, model estimates of projected global warming scenarios relative to the modeled values of their baseline periods remain of interest to researchers. These estimates can be used to calculate runoff and climate characteristics under different climate change scenarios as projected into the mid-21st century. Here, relative changes in the modeled runoff for each scenario (expressed as a percentage of the baseline runoff) can be used to calculate absolute runoff values for each scenario.
According to the CMIP6 ensemble average, all large rivers flowing into the Arctic Ocean are projected to experience increases in both runoff and climate characteristics under mid-21st-century anthropogenic warming compared to their baseline values (Table 4). The most significant increase in the annual runoff of these rivers is expected in the Pechora, Yenisei, and Lena basins (from 10.4% in the Pechora to 29.1% in the Lena), while the runoff of the Don and Dnieper may be lower than the model runoff for the baseline period by 3.4–17.1% and 4.8–14.7%, respectively depending on scenario. In contrast, the runoff of the Volga River may decrease under the moderate and extreme global warming scenarios by 1.7% and 2.5%, respectively.
Table 4. Modeled changes in the components of the water balance equation ΔR, ΔPr, ΔE (%) and air temperature (ΔT, ºC) in 2040–2069 relative to modeled values for the baseline period under different global warming scenarios
|
River |
ssp1-2.6 |
ssp2-4.5 |
ssp5-8.5 |
|||||||||
|
∆R |
∆Pr |
∆E |
∆T |
∆R |
∆Pr |
∆E |
∆T |
∆R |
∆Pr |
∆E |
∆T |
|
|
Northern Dvina |
7.9 |
10.0 |
14.8 |
3.1 |
5.0 |
9.27 |
13.2 |
3.8 |
6.9 |
11.2 |
16.8 |
4.7 |
|
Pechora |
10.4 |
3.2 |
18.8 |
3.6 |
11.0 |
12.40 |
17.3 |
4.3 |
14.1 |
12.8 |
22.0 |
5.3 |
|
Volga |
2.6 |
7.8 |
11.5 |
3.1 |
-1.7 |
7.24 |
10.6 |
3.7 |
-2.5 |
8.0 |
12.6 |
4.5 |
|
Dnieper |
-4.8 |
6.2 |
9.0 |
2.8 |
-14.0 |
4.66 |
8.2 |
3.4 |
-14.7 |
3.8 |
7.7 |
4.3 |
|
Don |
-3.4 |
1.2 |
9.5 |
3.0 |
-11.8 |
-0.06 |
8.2 |
3.5 |
-17.1 |
-1.0 |
8.4 |
4.4 |
|
Ob |
7.0 |
10.0 |
13.1 |
3.2 |
5.4 |
11.4 |
12.0 |
3.8 |
5.9 |
12.2 |
14.4 |
4.7 |
|
Yenisei |
12.5 |
12.4 |
13.6 |
3.1 |
11.6 |
12.66 |
11.8 |
3.7 |
17.5 |
15.6 |
15.2 |
4.5 |
|
Lena |
18.2 |
13.8 |
15.4 |
3.3 |
18.6 |
14.89 |
12.4 |
4.0 |
29.1 |
19.3 |
16.0 |
4.9 |
Scenario projections indicate that climate characteristics will generally exceed baseline model values, except for slight decreases in annual precipitation in the Don River basin under SSP2-4.5 and SSP5-8.5 scenarios. The average annual air temperature across river basins is expected to increase across all basins, though the magnitude of this increase may differ. Increases in annual precipitation and total evapotranspiration will generally be more noticeable in Arctic river basins.
Percentage deviations in annual runoff for each warming scenario relative to the model runoff for the baseline period are closely linked to deviations in annual precipitation, while deviations in total evapotranspiration are closely linked to deviations in annual air temperature (Fig. 12).

Fig. 12. Regression relationships between changes (%) in hydroclimatic characteristics for large river basins. Changes are shown between the contemporary global warming period, scenario period (2040–2069) under different intensities of global warming relative to the baseline period, calculated using CMIP6 MMM data. (a) annual runoff and precipitation; (b) annual evapotranspiration and air temperature
It should be noted that the lowest correlation coefficients are observed when comparing the deltas between the model values calculated for the period of contemporary global warming and the baseline period. The closeness of the relationship increases with the intensity of global warming.
GCMs have improved significantly over the past decade. In particular, runoff calculation modules have begun to incorporate hydrological models, albeit in a simplified form (Georgievsky and Golovanov 2015, 2019).
This study shows that estimates of the long-term average annual runoff in several regions, including the southern and northern parts of the East European Plain and some basins of the largest Siberian rivers, obtained by averaging results from an ensemble of 18 CMIP6 GCMs, do not adequately represent the average runoff observed under contemporary global warming relative to the baseline period; this is consistent with previous studies (Georgiadi et al. 2024; Georgievsky and Golovanov 2015, 2019; Guo et al. 2022). Nevertheless, these models generally reproduce the sign of the changes between the contemporary and baseline periods. In most rivers, these models underestimate the change in hydroclimatic characteristics between these periods.
A primary reason for this underestimation is that some GCMs runoff schemes do not sufficiently account for regional features of runoff formation. One potential solution is to select specific climate models within CMIP6 that best reproduce observed runoff and its climatic drivers. Similar approaches have been used in climate research (e.g., Anisimov and Kokorev 2013; Georgiadi et al. 2014; Kislov et al. 2008; Menzhulin et al. 2005), though river runoff is generally not included among the characteristics assessed. The results of this study demonstrate that, when selecting global climate models, it is useful to compare not only climate variables but also the observed and GCM-derived river runoff for the modern warming and baseline periods. Comparing long-term trends in reliably determined observed and modeled runoff changes further enhances the reliability of model selection (Motovilov and Gelfan 2019).
Another approach to improving the accuracy of GCM-based calculations involves bias correction of the model’s climate variables using a specialized function, whose parameters are determined from the statistical analysis of long-term models and observed climatic fields (Haerter et al. 2011; Hoseini et al. 2024). Importantly, this method does not utilize observed runoff data for correction.
The further development of hydrological modules within GCMs, combined with improved methods for selecting the most suitable models based on both climatic variables and observed runoff, will enable GCMs to be more widely applied to address a broad spectrum of problems in the near future.
A comparative analysis of changes in the annual runoff, precipitation, total evapotranspiration, and air temperature of major river basins in the East European Plain and Siberia was conducted for both contemporary warming as well as projected global warming scenarios into the mid-21st century, relative to a baseline period. The main findings are as follows.
First, based on a comparison of annual runoff and climate characteristics between the period of contemporary global warming (1981–2010) and a baseline period (1930s–1980), calculated using observational data and the ensemble mean of 18 relatively high-resolution CMIP6 global climate models, it was found that:
– for both the period of contemporary global warming and the baseline period, the modeled annual runoff generally underestimates the observed (naturalized) runoff of rivers flowing into the Arctic Ocean with the exception of the Northern Dvina. In contrast, the modeled runoff overestimates the observed runoff in rivers on the southern macroslope of the East European Plain;
– modeled annual precipitation exceeded observed values from the CRU archive by 19–49% for the studied periods, with the difference being smaller for river basins in the East European Plain compared to river basins in Siberia. Modeled annual precipitation in most basins also exceeds the corrected observed precipitation values from the RIHMI-WDCcor archive, though this difference is much smaller and is hardly noticeable in some basins. Reanalysis-based precipitation data (NCEP, ERA5, MERRA2) for the Northern Dvina basin during 1981–2010 significantly exceed both the model-derived precipitation from CMIP6 and observed values from the CRU and RIHMI-GDC archives. Precipitation from the RIHMI-WDCcor archive (with set of corrections) was higher than the CRU data, lower than reanalysis data, and closely aligned with the CMIP6 model precipitation;
– the difference in annual air temperature calculated using CMIP6 data and observed values from the CRU archive for the two study periods has the same sign for most river basins, with the exception of the Ob’ basin. Model estimates tend to underestimate air temperature in the Northern Dvina, Pechora, Volga, and Dnieper basins, while overestimating it in the Yenisei, Lena, and Don basins;
– for most rivers, both observed and modeled runoff increased during the contemporary warming period compared to the baseline. Exceptions include the Don and Ob’ rivers, where observed runoff decreased, while modeled runoff increased. Differences in modeled runoff between the two study periods were generally smaller than the observed values, especially for the Volga, Dnieper, and Lena. The difference in observed runoff between the two study periods did not exceed 10%, while the differences in modeled runoff remained within 5%;
– similarly, the modeled and observed annual precipitation data (CRU and RIHMI-GDC (with set of corrections) archive) increased under contemporary global warming compared to the baseline period for almost all rivers except for the Yenisei basins (CRU) and the Ob’ basins (RIHMI-GDC). Differences in precipitation between periods are typically smaller in model data than in CRU data for the East European Plain (except the Don basin, which exhibited similar differences), while the opposite is true for Siberian basins. According to the corrected RIHMI-GDC data, precipitation changes between the two periods exceed model values in the Volga, Don, and Lena basins, while remaining lower than the model values in other basins, with a typical range of 3–5%;
– both observed and modeled air temperatures exhibited increases under contemporary global warming compared to the baseline in all river basins. The modeled difference in air temperature between these periods was lower than the observed values in most basins; the only exceptions were the Northern Dvina and Pechora basins.
Second, when comparing projected global warming scenarios of the mid-21st century (2040–2069) with model data for the baseline period (1930s–1980), it was revealed that:
– both the runoff and climate characteristics of rivers flowing into the Arctic Ocean will be higher than the model values of their baseline periods based on CMIP6 ensembles. The only exception is for annual precipitation in the Don basin, which may slightly decrease under the ssp2-4.5 and ssp5-8.5 scenarios. The most pronounced increases in annual runoff are projected for the Pechora, Yenisei, and Lena rivers, ranging from 10.4% on the Pechora to 29.1% on the Lena. In contrast, the runoff of the Don and Dnieper may decrease by 3.4–17.1% and 4.8–14.7% depending on the scenario, respectively, while the Volga runoff may experience only minor decreases of 1.7–2.5% under moderate to maximum warming. The average annual air temperature over all river basins is expected to increase at approximately the same rate, but increases in annual precipitation and total evapotranspiration will generally be more noticeable in Arctic river basins;
– deviations in the annual runoff of the rivers in each global warming scenario relative to the baseline period are closely linked to deviations in annual precipitation, while deviations in total evapotranspiration are closely linked to deviations in annual air temperature. The lowest correlation coefficients are observed when comparing deltas between modeled values for contemporary warming and the baseline period, while correlations strengthen under more intense warming scenarios.
Finally, improving the accuracy of river runoff estimates, including the long-term averaged annual river runoff derived from GCM ensembles, may be achieved by selecting models that best reproduce the observed values of runoff and climatic characteristics of river basins, both during the period of contemporary global warming and the baseline period, as well as the differences in those characteristics between those two periods.
1. AR6 Synthesis Report: Climate Change 2023. [online] Available at: https://www.ipcc.ch/report/sixth-assessment-report-cycle/ [Accessed 2 Oct. 2025]
2. Interactive Atlas: Regional information (Advanced). [online] Available at: https://interactive-atlas.ipcc.ch / [Accessed 2 Oct. 2025]
3. KNMI Climate Change Atlas. [online] Available at: https://climexp.knmi.nl/plot_atlas_form.py?id=someone@somewhere [Accessed 2 Oct. 2025]
4. Roshydromet Climate Center. Official Website. [online] Available at: https://cc.voeikovmgo.ru/ru/klimat/cmip6hr [Accessed 2 Oct. 2025]
5. Mapping and Data Analysis System for SESTRA project [online] Available at: https://sestra.unh.edu [Accessed 2 Oct. 2025]
6. CRU TS [online] Available at: https://crudata.uea.ac.uk/cru/data/hrg/) [Accessed 2 Oct. 2025]
7. The All-Russian Scientific Research Institute of Hydrometeorological Information – World Data Center [online] Available at: http://meteo.ru/, http://meteo.ru/data/ [Accessed 2 Oct. 2025]
8. Roshydromet Climate Center. Official Website. [online] Available at: https://cc.voeikovmgo.ru/ru/ [Accessed 2 Oct. 2025]
9. State Water Cadaster. Surface and Groundwater Resources, Their Use and Quality (1982–2022). Leningrad/St. Petersburg: Rosgidromet. (In Russian)
1. Abramowitz G., Herger N., Gutmann E., Hammerling D., Knutti R., Leduc M., Lorenz R., Pincus R. and Schmidt G. A. (2019). ESD Reviews: Model dependence in multi-model climate ensembles: weighting, sub-selection and out-of-sample testing. Earth Syst. Dynam., 10, 91–105, DOI:10.5194/esd-10-91-2019, 2019.
2. Anisimov O.A. and Kokorev V.A. (2013). The optimal choice of hydrodynamic models to assess the impact of climate change on the cryosphere, Ice and Snow, 53(1), 83-92 (in Russian with English summary), DOI: 10.15356/2076-6734-2013-1-83-92
3. ArcAtlas: Our Earth. Environmental Systems Research Institute (1996). Inc. and DATA+ All Rights Reserved.
4. Barabanova E.A. (2004). Comparison of reservoirs by the complex of their positive and negative impacts on the environment and economy. Izvestiya Rossiiskoi Akademii Nauk. Seriya Geograficheskaya, 2, 72–82. (In Russian with English summary).
5. Bogdanova E. G., Ilyin B. M. and Dragomilova I. V. (2002). Application of a Comprehensive Bias-Correction Model to Precipitation Measured at Russian North Pole Drifting Stations, Meteorology and Hydrology, 3, 700–713. (In Russian).
6. Bolgov M.V., Filippova I.A., Osipova N.V., Korobkina E.A. and Trubetskova M.D. (2018). Modern features of the hydrological regime of the rivers of the Volga basin, Problems of Geography, 145, 206–218. (In Russian).
7. Dobrovolski S.G, Yushkov V.P. and Istomina M.N. (2019). Statistical Modeling of the Global River Runoff Using GCMs: Comparison with the Observational Data and Reanalysis Results // Water Resources, 46 (S2), 17–24, DOI: 10.1134/S0097807819080050
8. Döll P., Trautmann T., Gerten D., Müller Schmied H., Ostberg S., Saaed F. and Schleussner C.F. (2018). Risks for the global freshwater system at 1.5 °C and 2 °C global warming. Environ. Res. Lett., 13, 044038, DOI:10.1088/1748-9326/aab7.
9. Eyring V., Bony S., Meehl G. A., Senior C. A., Stevens B., Stouffer R. J. and Taylor K. E. (2016). Overview of the Coupled Model Intercomparison Project Phase 6 (CMIP6) experimental design and organization. Geosci. Model Dev., 9, 1937–1958, DOI: 10.5194/gmd-9-1937-2016, 2016
10. Fekete B.M., Vörösmarty J.O., Roads J.O. and Willmott C.J. (2004). Uncertainties in Precipitation and Their Impacts on Runoff Estimates. Journal of Climate, 17, 294–304.
11. Frolova N.L., Magritskii D.V., Kireeva M.B., Grigor’ev V.Y., Gelfan A.N., Sazonov A.A. and Shevchenko A.I. (2022). Streamflow of the Russian rivers under current and forecasted climate changes. A review of publications. 1. Assessment of changes in the water regime of Russian rivers by observation data. Water Resour., 49(3), 333-350, DOI: 10.1134/S0097807822030046.
12. Gelaro R, McCarty W, Suárez MJ, Todling R, Molod A, Takacs L, Randles C, Darmenov A, Bosilovich MG, Reichle R, Wargan K, Coy L, Cullather R, Draper C, Akella S, Buchard V, Conaty A, da Silva A, Gu W, Kim GK, Koster R, Lucchesi R, Merkova D, Nielsen JE, Partyka G, Pawson S, Putman W, Rienecker M, Schubert SD, Sienkiewicz M, and Zhao B. (2017). The Modern-Era Retrospective Analysis for Research and Applications, Version 2 (MERRA-2). J Clim. 30(13),5419-5454, DOI: 10.1175/JCLI-D-16-0758.1.
13. Gelfan A.N., Gusev E.M., Kalugin A.S., Krylenko I.N., Motovilov Yu.G., Nasonova O.N., Millionshchikova T.D. and Frolova N.L. (2022). Runoff of Russian Rivers under Current and Projected Climate Change: a Review 2. Climate Change Impact on the Water Regime of Russian Rivers in the XXI Century. Water Resour., 49, 351–365, DOI:10.1134/s0097807822030058
14. Georgiadi A.G., Kashutina E.A. (2016) Long-term changes in the runoff of the largest Siberian rivers. Izvestiya Rossiiskoi Akademii Nauk. Seriya Geograficheskaya, (5), 70–81, DOI: 10.15356/0373-2444-2016-5-70-81(In Russian).
15. Georgiadi A.G. and Milyukova I.P. (2002). The scale of hydrological changes in the Volga River basin under anthropogenic warming, Meteorology and Hydrology, 2, 72–79. (In Russian).
16. Georgiadi A.G. and Milyukova I.P. (2023) Peculiarities of Long-term Phases of the Increased and Decreased Don and Lena Runoff in the 19th–21st Centuries. Russ. Meteorol. Hydrol., 48, 1066–1075, DOI: 10.3103/S1068373923120075
17. Georgiadi A.G., Kashutina E.A. and Milyukova I.P. (2018). Long-term Changes of Water Flow, Water Temperature and Heat Flux of the Largest Siberian Rivers. Polarforschung, 87 (2), 167–176, DOI:10.2312/polarforschung.87.2.167
18. Georgiadi A.G., Milyukova I.P., Borodin O.O. and Barabanova E.A. (2024). Water Flow of the Largest Russian Rivers in Modern and Scenario Global Warming. Izvestiya Rossiiskoi Akademii Nauk. Seriya Geograficheskaya, 88(6), 855-866, DOI: 10.31857/S2587556624060011. (in Russian with English summary).
19. Georgiadi A.G., Koronkevich N.I., Milyukova I.P., Kashutina E.A. and Barabanova E.A. (2014). Contemporary and Scenario Changes in River Runoff in the Basins of the Largest Russian Rivers. Part 2. Basins of the Volga and Don. Moscow: Maks Press Publ. (In Russian).
20. Georgievsky M.V. and Golovanov O.F. (2015). Assessment of probable changes in runoff in the Amur River basin for the period up to 2020 and 2050 based on data from atmospheric and ocean general circulation models. In: Georgievsky, V.Yu., ed., Extreme Floods in the Amur Basin: Hydrological Aspects. St. Petersburg: OOO EsPeKha Publ., 153–179. (in Russian).
21. Georgievsky M.V. and Golovanov O.F. (2019). Forecasting changes in river water resources of Russian Federation based on CMIP5 runooff data. Vestnik of Saint Petersburg University. Earth Sciences, 64 (2), 206–218, DOI: 10.21638/spbu07.2019.203 (In Russian with English summary)
22. Georgievsky V.Yu., Yezhov A.V., Shalygin A.L., Shiklomanov I.A. and Shiklomanov A.I. (1996). Assessment of the effect of possible climate changes on hydrological regime and water resources of rivers in the former USSR, Meteorology and Hydrology, 11, 89–99. (in Russian).
23. Georgievsky V.Yu. ed. (2021). Scientific and applied reference book: Long-term fluctuations and variability of water resources and the main characteristics of river flow in the Russian Federation. Saint-Petersburg: OOO «RIAL» Publ. (in Russian).
24. Groisman P. Ya., Easterling D. R., Quayle R. G. and Golubev V. S. (1996). Reducing biases in estimates of precipitation over the United States: Phase 3 adjustments. J. Geophys. Res., 101 (D3), 7185–7195.
25. Guo H., Zhan C., Ning L., Li X., Hu S. (2022). Evaluation and comparison of CMIP6 and CMIP5 model performance in simulating the runoff. Theor. Appl. Climatol., 149, 1451–1470, DOI: 10.1007/s00704-022-04118-0
26. Gusev E.M. and Nasonova O.N. (2010). Modelirovanie teplo- i vlagoobmena poverkhnosti sushi s atmosferoi [Modeling of Heat and Moisture Exchange Between the Land Surface and the Atmosphere. Moscow: Nauka Publ. (In Russian).
27. Haerter O.J., Hagemann S., Moseley C.and Piani C. (2011) Climate model bias correction and the role of timescales. Hydrol. Earth Syst. Sci., 15, 1065–1079.
28. Harding R., Best M., Blyth E., Hagemann S., Kabat P., Tallaksen L.M., Warnaars T., Wiberg D., Weedon G.P., van Lanen H.A. I., Ludwig F. and Haddeland I. (2011) WATCH: Current knowledge of the Terrestrial global water cycle. J. Hydrometeorol., 12, 1149–1156, DOI: 10.1175/JHM–D-11–024.1
29. Harris I., Jones P.D., Osborna T.J. and Listera D.H. (2013). Updated high-resolution grids of monthly climatic observations – the CRU TS3.10 Dataset I. Int. J. Climatol. [published online in Wiley Online Library (wileyonlinelibrary.com)] DOI: 10.1002/joc.3711
30. Hoseini S.M., Soltanpour M. and Zolfaghari M. R. (2024). Projected changes in precipitation and air temperature over the Volga River Basin from bias-corrected CMIP6 outputs. Numerical Methods in Civil Engineering, 8(2), 36-47, DOI: 10.61186/NMCE.2303.1034
31. Kalinin G.P. and Milyukov P.I. (1958). Approximate Calculation of Unsteady Motion of Water Masses. Proceedings of the Central Institute of Forecasts. Issue 66. Leningrad: Gidrometeoizdat, 72 (In Russian).
32. Kalnay et al. (1996). The NCEP/NCAR 40-year reanalysis project. Bull. Amer. Meteor. Soc., 77, 437–470.
33. Kattsov V.M. and Govorkova V.A. (2013). Expected surface air temperature, precipitation and annual runoff changes over the territory of Russia: projections with an ensemble of global climate models (cmip5), Trudy GGO, (569), 75–97. (In Russian).
34. Kislov A.V., Evstigneev V.M., Malkhazova S.M., et al. (2008). Forecast of Climatic Resource Availability of the East European Plain in the Conditions of Warming of the 21st Century. Moscow: Max Press. (In Russian).
35. Kuzin P.S. and Babkin V.I. (1979). Geographical Regularities of the Hydrological Regime of Rivers. Leningrad: Gidrometeoizdat. (In Russian).
36. Lehner F., Deser C., Maher N., Marotzke J., Fischer E. M., Brunner L., Knutti R. and Hawkins E. (2020). Partitioning climate projection uncertainty with multiple large ensembles and CMIP5/6. Earth Syst. Dynam., 11, 491–508, DOI:10.5194/esd-11-491-2020, 2020.
37. Menzhulin G.V., Shamshurin V.I., and Savvateev S.P. (2005). On the assessment of the accuracy of model climate change scenarios recommended by the IPCC commission for calculating the consequences of global warming. In: Modern Problems of Environmental Meteorology and Climatology. St. Petersburg: Nauka Publ., 55–85. (In Russian)
38. Mokhov I.I., Semenov V.A. and Khon V.K. (2003). Estimates of possible regional hydrologic regime changes in the 21st century based on global climate models, Izvestiya Rossiiskoi Akademii Nauk. Seriya Atmospheric and Oceanic Physics, (39), 130–144. (In Russian).
39. Motovilov Yu.G. and Gelfan A.N. (2019). Runoff Formation Models in Challengers of River Basin Hydrology. Moscow: Izdatel’stvo Rossiiskoi Akademii Nauk (In Russian)
40. Muñoz Sabater J. (2019). ERA5-Land monthly averaged data from 1981 to present. Copernicus Climate Change Service (C3S) Climate Data Store (CDS). DOI: 10.24381/cds.68d2bb30
41. Muraveisky S.D. (1960). Rivers and Lakes, Hydrobiology, Runoff. Moscow: Geografgiz Publ. (In Russian)
42. O’Neill B. C., Tebaldi C., van Vuuren D. P., Eyring V., Friedlingstein P., Hurtt G., Knutti R., Kriegler E., Lamarque J.-F., Lowe J., Meehl G. A., Moss R., Riahi K., and Sanderson B. M. (2016). The Scenario Model Intercomparison Project (ScenarioMIP) for CMIP6. Geosci. Model Dev., [online] 9, 3461–3482. Available at: https://doi.org/10.5194/gmd-9-3461-2016 [Accessed 2 Oct. 2025]
43. Sharma S. and Singh P.K. (2017). Long Term Spatiotemporal Variability in Rainfall Trends over the State of Jharkhand, India. Climate, 5, 2–18, DOI:10.3390/cli5010018.Shi X., Qin T., Nie H., Weng B. and He S. (2019). Changes in major global river discharges directed into the ocean. Int. J. Environ. Res. Public Health, 16, 1469.
44. Shiklomanov A.I., Golovanov O., Lammers R.B., Tretjyakov M. and Yang D. (2011). Dam/Reservoir-Induced Hydrological Changes in Large Siberian Rivers. Amer. Geophys. Union, Fall Meeting 2011. Abstract C31B-06
45. Shiklomanov I.A. (Ed.) (2008). Water Resources of Russia and Their Use. Saint-Petersburg: State Hydrological Institute Publ. (in Russian).
46. Shpakova R.N., and Wang P. (2023). Change in Perennial Runoff Fluctuations of the Rivers in South Yakutia in the Context of Global Warming. Russian Arctic, 5(1), 33-44, DOI: 10.24412/2658-4255-2023-1-33-44 (In Russian)
47. Yamazaki D., Ikeshima D., Sosa J., Bates P.D., Allen G.H., Pavelsky T.M. (2019). MERIT Hydro: A high-resolution global hydrography map based on latest topography datasets. Water Resources Research, 55, 5053–5073, DOI: 10.1029/2019WR024873
48. Yang D. and Kane D.L. (Еds.) (2021). Arctic Hydrology, Permafrost and Ecosystems. Cham: Springer, DOI: 10.1007/978-3-030-50930-9
49. Ye B. Aisheng, Daqing Yang D., Yongjian Ding Y., Tianding Han T., Toshio Koike T. (2004). A Bias-Corrected Precipitation Climatology for China. J. Hydrometeorol., 5, 1147-1160.
Staromonetny lane, Moscow, 119017
Staromonetny lane, Moscow, 119017
Staromonetny lane, Moscow, 119017
Staromonetny lane, Moscow, 119017
Staromonetny lane, Moscow, 119017
Georgiadi A.G., Barabanova E.A., Milyukova I.P., Morozova P.A., Narykov A.N. Annual Runoff and Climate Characteristics in large River Basins of Northern Eurasia under Global Warming. GEOGRAPHY, ENVIRONMENT, SUSTAINABILITY. 2026;19(1):167-180. https://doi.org/10.24057/2071-9388-2026-2423
 Email this article (Login required)
Email the author (Login required)
Email this article (Login required)
Email the author (Login required) 
Editor-in-Chief
Kasimov Nikolay S.Lomonosov Moscow State University
Moscow 119991 Russia, Leninskie Gory, Faculty of Geography, 1806a
Phone +7 495 939-15-52
E-mail: ges-journal@geogr.msu.ru





