



Contents
Scroll to:
https://doi.org/10.24057/2071-9388-2026-3811
Scroll to:
Coral reef ecosystems are vital for marine biodiversity, coastal protection, and local livelihoods, yet environmental and anthropogenic stressors increasingly threaten them. Accurate and timely mapping of these habitats is essential for effective management and conservation planning. This study aims to evaluate and compare the spatial distribution and extent of coral reef habitats around Liang and Rakit Islands, as well as to assess the classification accuracy of Sentinel-2 Level-2A and the SPOT-7 satellite imagery for the years 2016 and 2021. Both datasets were pre-processed through atmospheric and sun-glint corrections, with SPOT-7 imagery further enhanced by water column correction using the Lyzenga algorithm. Supervised classification in ENVI was used to map four shallow-water habitat classes (coral reef, seagrass, sand, and rubble), and classification accuracy was assessed using confusion matrices to compute Producer Accuracy (PA), User Accuracy (UA), and Overall Accuracy (OA). Across both islands, coral reef and seagrass each occupied roughly one quarter of the mapped shallow-water area, while sand and rubble together accounted for about half of the area, indicating a heterogeneous mosaic of fringing reefs and seagrass meadows interspersed with sandy and rubbly substrates. Maps derived from SPOT-7 imagery produced higher overall accuracies (84% for Liang and 82% for Rakit) than those derived from Sentinel-2A imagery (76% and 70%, respectively). SPOT-7-based classifications consistently delineated larger and more detailed extents of coral reef and seagrass habitats, demonstrating the value of higher-resolution imagery for representing fine-scale features in optically complex coastal environments, whereas Sentinel-2A imagery was more suitable for broad-scale habitat discrimination but tended to underestimate narrow or fragmented patches.
Agus S.B., Maulana A.S., Arifin T., Yulius , Putra A., Ramdhan M., Heriati A., Rahmania R., Prihantono J., Sufyan A., Mustikasari E., Asaf R., Athirah A., Fihrin H. Mapping of Coral Reef Habitats Using Spot-7 And Sentinel-2 Satellite Imagery in Liang and Rakit Islands, Saleh Bay, Indonesia. GEOGRAPHY, ENVIRONMENT, SUSTAINABILITY. 2026;19(1):6-16. https://doi.org/10.24057/2071-9388-2026-3811
Saleh Bay, located in West Nusa Tenggara Province, is a marine body situated between the Sumbawa and Dompu Regencies (Kusumawati et al. 2019). Liang and Rakit Islands are among several small islands within Saleh Bay. Mapping coral reef habitats provides essential data to guide regional development and ensure sustainable exploitation of these resources. However, studies on these specific islands remain limited. Saleh Bay’s waters host a diverse array of marine and coastal organisms and feature favorable environmental parameters such as cool water temperatures, high salinity, strong currents, high light penetration, neutral pH levels, and elevated concentrations of nutrients notably phosphorus (PO₄) and nitrogen (NO₃) (Yulius et al. 2019; Rahman et al. 2025). Liang and Rakit Islands were selected as study sites due to the lack of comprehensive studies on their coral reef ecosystems, which are vital for maintaining marine biodiversity and ecological sustainability.
Conducting field assessments and analyzing coral reef conditions in these areas can generate scientifically grounded recommendations not only for sustainable marine tourism development but also to support local community empowerment and inform national coastal management policies. For instance, coral reef habitat assessments in Raja Ampat, West Papua, have contributed to the establishment of community-based marine protected areas that balance ecological conservation and tourism (Atmodjo et al. 2020). Similarly, integrated reef monitoring in Bunaken National Park, located north of Manado City, North Sulawesi has informed adaptive management strategies that align with both biodiversity objectives and socioeconomic benefits for local communities (Farhum et al. 2021). These examples underscore how site-specific ecological research, such as that conducted in Saleh Bay, can provide evidence-based inputs for multi-level governance and long-term sustainability planning.
Marine study and exploitation activities are ongoing in Saleh Bay (Azzahra et al. 2025). However, due to coral reef degradation in some areas, including the waters surrounding Moyo, Medang, Rakit, and Ganteng Islands, Saleh Bay is increasingly recognized as a priority area for habitat restoration and ecological enrichment. In light of the long-term consequences of ecologically harmful fishing techniques, reassessing the condition of coral reef environments has become a pressing concern. One of the key goals of this study is to provide a comprehensive inventory of coral reef resources in the area (Edrus et al. 2017), which includes geo-referenced habitat maps, species composition data, live coral cover percentage, substrate types, and reef health indicators such as bleaching level and presence of macroalgae.
The presence of 28 ornamental coral genera in Saleh Bay, including Euphyllia glabrescens, Euphyllia cristata, Echinopora sp., Goniopora sp., and Lobophyllia sp., all of which are commercially valuable species, demonstrates a more even distribution in the mid-shore zones compared to other locations (Herdianti et al. 2025). Overall, the condition of coral reefs in Saleh Bay is considered good, with average live coral cover measured at 53.4%, based on in-situ benthic surveys using Line Intercept Transect (LIT) methods across 12 sampling stations. Better reef health tends to be observed further offshore, likely due to reduced sedimentation. Nevertheless, destructive fishing methods, such as blast fishing and chemical poisons, are still reported in certain locations and continue to compromise coral resilience and recovery (Johan et al. 2018). Accordingly, satellite remote sensing has become an indispensable tool for large-scale and repeated assessment of coral reef conditions, enabling objective detection of spatial and temporal ecological changes. Satellite imagery offers the advantage of wide spatial coverage and frequent revisit times, enabling efficient monitoring and timely detection of changes in reef conditions. Moreover, this method is more cost-effective than extensive field surveys, particularly in large or remote marine areas, making it an effective tool for sustainable coral reef management (Ji et al. 2024). It also facilitates habitat classification and change detection with improved precision, supporting early warnings, restoration planning, and marine spatial management in ecologically sensitive areas.
Computer-based image processing plays a critical role in satellite-based coral reef habitat mapping. Both pixel-based and object-based approaches are commonly applied in remote sensing data analysis. Pixel-based analysis involves classifying each pixel based on spectral values (e.g., color or intensity) without considering spatial relationships among neighboring pixels. This method is widely used for various remote sensing applications, including land use classification and coral reef identification. Its main advantage lies in its simplicity and suitability for high-resolution imagery. However, a key limitation is the lack of contextual spatial information, which can reduce classification accuracy compared to object-based methods that consider pixel groupings and spatial patterns (Agus et al. 2024). One algorithm commonly employed in pixel-based classification is the Lyzenga algorithm (Pratomo et al. 2024).
The Lyzenga algorithm is a well-established technique in satellite image analysis for estimating water depth in shallow marine environments, particularly for seafloor mapping, including coral reef habitats (Borfecchia et al. 2018). Originally developed by Donald Lyzenga in the 1980s, this method is frequently utilized in coral reef mapping based on optical satellite data (Irawan et al. 2017; Tanis & Lyzenga 1981). However, the primary motivation of the present study is not the algorithm itself but the need to better characterize coral reef habitats that are undergoing rapid ecological change in Saleh Bay, an under-studied region with high conservation value. In this context, the objective of this study is to evaluate and compare the spatial distribution and extent of coral reef habitats around Liang and Rakit Islands, as well as to assess the classification accuracy of Sentinel-2 Level-2A and SPOT-7 satellite imagery for mapping shallow-water benthic habitats in this area.
This study offers a novelty by providing the first quantitative comparison of coral reef habitat classification accuracy between SPOT-7 and Sentinel-2A imagery in Saleh Bay, an underexplored region with high ecological potential. This finding advances coral reef mapping practices in turbid and spatially heterogeneous coastal environments and supports the integration of multi-resolution remote sensing for targeted reef conservation planning. It is important to note that the available imagery consists of a 2016 scene for Liang Island and a 2021 scene for Rakit Island. Therefore, this study does not perform a formal change-detection analysis at the same site but rather compares coral reef habitat mapping and classification accuracy between two representative islands and dates.
The study was conducted in the Saleh Bay region of West Nusa Tenggara, specifically on Rakit Island, located at 118.0°E, 8.4°S, and Liang Island, located at 117.4°E, 8.3°S. These islands were selected as the study sites due to limited existing research on coral reef habitats in this region, which are critical to the sustainability of marine ecosystems. Additionally, the region has been identified as a potential site for coral reef ecosystem restoration. According to Arifin et al. (2025), temperature, salinity, and pH in Saleh Bay are interconnected parameters that reflect ecosystem stability, while nitrate (NO₃) and ammonia (NH₃) concentrations serve as indicators of elevated anthropogenic influence, all of which directly affect coral reef health by controlling growth, calcification, and susceptibility to bleaching in the bay. These environmental factors can significantly affect the distribution and extent of coral reef habitats, as well as marine biological productivity, both of which are essential for supporting socio-economic activities such as fisheries and coral restoration. For more details, see the map in Fig. 1 below.
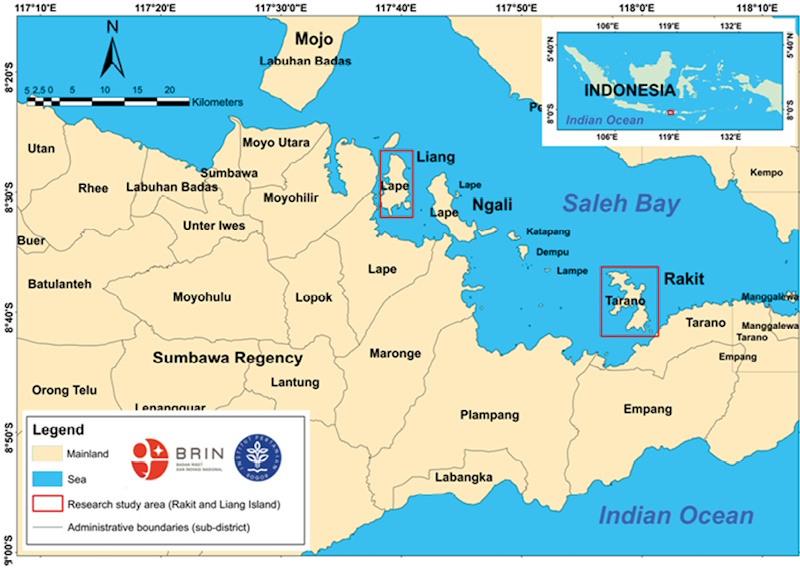
Fig. 1. Map of the study area in Liang and Rakit Islands, Saleh Bay, Indonesia
SPOT-7 Satellite Imagery
This study utilized SPOT-7 satellite imagery due to its high spatial resolution of 1.5 m in the panchromatic band and 6 m in the multispectral bands. However, the SPOT-7 imagery obtained for this study was not fully pre-processed, particularly with regard to sun glint and atmospheric correction. SPOT-7 imagery is typically available in several processing levels, including Level 1A, Level 1B, and Level 2A (Xie et al. 2008; Turker & Ozdarici 2011). At Level 1A, the imagery undergoes only basic radiometric correction, with no geometric or atmospheric adjustments. In contrast, Level 1B and Level 1C imagery includes geometric corrections but still lacks atmospheric correction, leaving elements such as haze or clouds unaddressed (Amran 2024). For advanced analytical purposes, particularly those requiring accurate surface reflectance data, further corrections must be performed manually. A commonly used method is Dark Object Subtraction (DOS), a straightforward atmospheric correction technique designed to mitigate the effects of atmospheric scattering in imagery. This correction process was performed using the Environment for Visualizing Images (ENVI) 5.3 software.
The workflow of this study began with downloading the satellite imagery, followed by image mosaicking using ArcMap. Subsequently, atmospheric and sun glint corrections were applied using ENVI. The DOS was employed for atmospheric correction, and the Band Math tool was used to implement the sun glint correction equation. Next, the Lyzenga algorithm was applied in ENVI to correct for the water column, enhancing the spectral differentiation of benthic features. The corrected images were then classified using the classification workflow tool.
Following the classification process, the extent of coral reef habitat distribution was quantified using polygon area calculations within ArcMap, with the measurements extracted from the attribute table (Poursanidis et al. 2018). This study also utilized Sentinel-2A Level-2A satellite imagery, which has a coarser spatial resolution than SPOT-7. Sentinel-2 provides 13 spectral bands with spatial resolutions of 10 m for the visible and near-infrared bands, 20 m for the red-edge and short-wave infrared bands, and 60 m for the coastal aerosol, water-vapor, and cirrus bands. The Level-2A product has undergone systematic atmospheric correction, producing surface reflectance data that are suitable for direct analytical applications. Sentinel-2 imagery is available in several processing levels, such as Level-1C, which is geometrically and radiometrically corrected but still expressed as top-of-atmosphere reflectance, and Level-2A, which includes full atmospheric correction using surface-reflectance algorithms. The Level-2A product corrects for haze, aerosols, and other atmospheric interferences, significantly enhancing data quality and reliability (Flament et al. 2021). As a result, Sentinel-2A Level-2A imagery is widely used for detailed environmental assessments, including mapping coral reef habitat distribution. For more details, see Fig. 2 below.
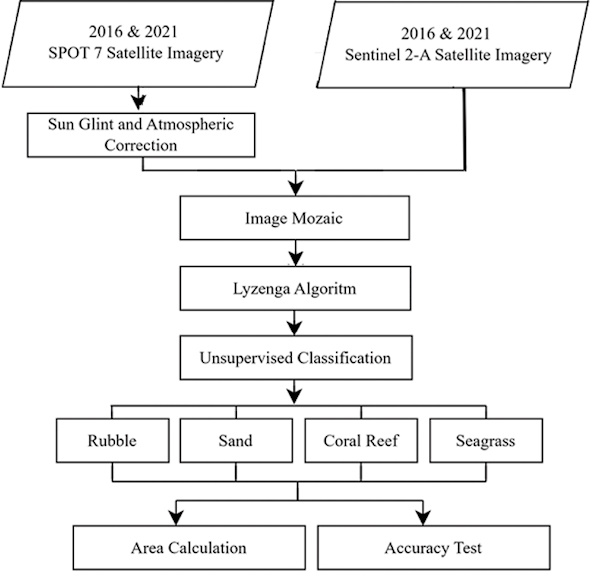
Fig. 2. Workflow of coral reef mapping using SPOT-7 and Sentinel-2A imagery
Atmospheric and Sun Glint Correction
Atmospheric correction was applied using the Dark Object Subtraction (DOS) method implemented in ENVI (Darweesh et al., 2021). Sun-glint was corrected using an empirical line-of-sight correction (ELSC) based on a linear regression between the near-infrared (NIR) band and the visible bands (Hedley et al., 2005; Bernardo et al., 2017; Simarmata et al., 2024), as , as expressed in Eq. (1) (Hedley et al. 2005; Bernardo et al. 2017):
 (1)
(1)
where R΄i is the deglinted (corrected) pixel value in band i; Ri is the original reflectance value in visible band i; bi is the slope of the linear regression between band i and the NIR band; RNIR is the NIR band reflectance for the same pixel; and MinNIR is the minimum NIR value within the selected deep-water sample used to estimate sun glint.
Image Mosaic
Image mosaicking is a key image processing technique used to merge multiple satellite images into a composite image, offering a more comprehensive spatial view of the study area (Febriandi et al. 2025). Prior to mosaicking, images must be geometrically corrected to ensure spatial accuracy within the same coordinate system. Radiometric adjustments are performed to harmonize color and brightness across tiles, avoiding visible seams (Putra et al. 2026). This process was conducted using Esri ArcGIS Desktop software (ArcMap), which provides a dedicated toolbox for mosaicking and raster processing.
Lyzenga Algorithm
The purpose of water column correction is to enhance satellite imagery by reducing optical interference caused by varying water depths, thereby making submerged objects more distinguishable (Panjaitan et al. 2025). This correction uses the Depth Invariant Index (DII), formulated through the Lyzenga algorithm (Tanis & Lyzenga 1981), expressed as Eq. (2):
 (2)
(2)
where Li is the reflectance value of spectral band i; Lj is the reflectance value of spectral band j; ki and kj are the attenuation coefficients for bands i and j, respectively.
The attenuation ratio (ki/kj) is derived from Eqs. (3) and (4):
 (3)
(3)
 (4)
(4)
where σii is variance or variant of channel i; σjj is variance or variance of channel j; σij is the covariance between bands i and j.
Supervised Classification
Supervised classification is an image-processing technique in which pixels are assigned to classes based on spectral signatures derived from training samples with known labels (Indey et al. 2024). In this study, a supervised classification approach was implemented using the Classification Workflow tool in ENVI to map four benthic habitat classes, namely coral reef, seagrass, sand, and rubble. This approach has been widely applied for coral reef habitat mapping in recent remote-sensing studies (Suasti et al. 2020; Rahmaddeni et al. 2024). Regions of interest representing each class were delineated using field information and visual interpretation of the corrected imagery, and these regions were used to derive class signatures (Putra et al. 2023). The resulting supervised classifier was then applied to the atmospherically and water-column-corrected SPOT-7 and Sentinel-2A images to produce the final habitat maps.
Accuracy Test
An accuracy assessment was conducted to evaluate the effectiveness of the classification results in mapping shallow marine habitats. The confusion matrix (or error matrix) is a standard tool for assessing classification performance by comparing the predicted classes with reference data (Ilyas et al. 2020). The following accuracy metrics were computed, namely 1) Producer Accuracy (PA): the proportion of correctly classified reference pixels; 2) User Accuracy (UA): the reliability of the classified map from the user’s perspective; and 3) Overall Accuracy (OA): the total proportion of correctly classified pixels as expressed in Eqs. (5) to (7).
 (5)
(5)
 (6)
(6)
 (7)
(7)
where k is the number of classes in the confusion matrix, n is the total number of reference samples, nii is the number of correctly classified samples for class i (the i–th diagonal element); ni+ is the marginal row total for class i (reference samples of class i); and ni+ is the marginal column total for class i (samples classified as class i).
To evaluate the classification performance of coral reef habitat mapping, an accuracy assessment was conducted using satellite imagery from Sentinel-2A Level-2A and SPOT-7 for Liang Island in 2016. The assessment was based on a confusion matrix that compares the classified satellite image with reference data from Google Earth. Three key metrics were used to measure classification performance: UA, PA, and OA. These metrics indicate how well each habitat class was identified by the classification algorithm. For more details, see Tables 1 and 2 below.
Table 1. Sentinel Level 2-A classification accuracy test at Liang Island in 2016
|
Sentinel-2A Level-2A 2016 Liang Island |
|||||||
|
Rubble |
Sand |
Coral Reef |
Seagrass |
Total |
UA (%) |
||
|
Google earth reference |
Rubble |
9 |
2 |
2 |
0 |
13 |
69.23 |
|
Sand |
1 |
9 |
0 |
1 |
11 |
81.81 |
|
|
Coral Reef |
1 |
0 |
12 |
1 |
14 |
85.71 |
|
|
Seagrass |
0 |
2 |
2 |
8 |
12 |
66.66 |
|
|
Total |
11 |
13 |
16 |
10 |
50 |
||
|
PA (%) |
81.81 |
69.23 |
75 |
80 |
|||
|
OA (%) |
76 |
||||||
Table 2. SPOT-7 classification accuracy test at Liang Island in 2016
|
SPOT-7 2016 Liang Island |
|||||||
|
Rubble |
Sand |
Coral Reef |
Seagrass |
Total |
UA (%) |
||
|
Google earth reference |
Rubble |
10 |
1 |
1 |
0 |
12 |
83.33 |
|
Sand |
1 |
11 |
0 |
0 |
12 |
91.66 |
|
|
Coral Reef |
1 |
0 |
12 |
1 |
14 |
85.71 |
|
|
Seagrass |
0 |
2 |
1 |
9 |
12 |
75 |
|
|
Total |
12 |
14 |
14 |
10 |
50 |
||
|
PA (%) |
83.33 |
78.57 |
85.71 |
90 |
|||
|
OA (%) |
84 |
||||||
Based on Table 1 above, the Sentinel-2A Level-2A classification for Liang Island achieved an OA of 76%. The Coral Reef class recorded the highest UA of 85.71%, indicating strong agreement between the classified and reference data. The Sand class had the highest PA of 81.81%, suggesting the classifier successfully captured the actual sand features on the ground. However, the Seagrass class showed a relatively low UA of 66.66%, indicating higher misclassification in that class. In contrast, Table 2 shows the classification accuracy results from SPOT-7 imagery. This classification achieved a higher OA of 84%. The Sand class recorded the highest UA of 91.66%, while the Seagrass class achieved the highest PA of 90%. These results highlight SPOT-7’s superior performance in detecting sand and seagrass features. The comparative analysis of both tables above indicates that SPOT-7 imagery outperformed Sentinel-2A Level-2A in terms of classification accuracy for coral reef-related habitats on Liang Island. The higher spatial resolution of SPOT-7 (up to 1.5 meters) enhances its capability to capture detailed habitat boundaries, leading to improved accuracy especially in detecting sand and seagrass areas, which often require finer spatial differentiation. While both datasets performed well in identifying coral reef habitats, Sentinel-2A Level-2A showed limitations in discriminating seagrass, likely due to lower resolution (10–20 m) and mixed pixel effects. The lower user accuracy for seagrass in Sentinel imagery suggests that pixels classified as seagrass often included other substrates like sand or rubble. Therefore, SPOT-7 imagery is more suitable for detailed habitat classification, especially when precision is critical for marine resource management and conservation planning. Similar accuracy assessment was performed for Rakit Island in 2021, using both Sentinel-2A Level-2A and SPOT-7 imagery. For more details, see Tables 3 and 4 below.
Table 3. Sentinel-2A Level-2A classification accuracy test on Rakit Island in 2021
|
Sentinel-2A Level-2A 2021 Rakit Island |
|||||||
|
Rubble |
Sand |
Coral Reef |
Seagrass |
Total |
UA (%) |
||
|
Google earth reference |
Rubble |
9 |
2 |
1 |
0 |
12 |
75 |
|
Sand |
1 |
7 |
0 |
2 |
10 |
70 |
|
|
Coral Reef |
1 |
2 |
10 |
1 |
14 |
71.42 |
|
|
Seagrass |
1 |
3 |
1 |
9 |
14 |
64.28 |
|
|
Total |
12 |
14 |
12 |
12 |
50 |
||
|
PA (%) |
81.81 |
75 |
50 |
83.33 |
75 |
||
|
OA (%) |
76 |
70 |
|||||
Table 4. SPOT-7 classification accuracy test on Rakit Island in 2021
|
Sentinel-2A Level-2A 2021 Rakit Island |
|||||||
|
Rubble |
Sand |
Coral Reef |
Seagrass |
Total |
UA (%) |
||
|
Google earth reference |
Rubble |
11 |
1 |
1 |
0 |
13 |
84.61 |
|
Sand |
1 |
10 |
1 |
0 |
12 |
83.33 |
|
|
Coral Reef |
1 |
0 |
12 |
1 |
14 |
85.71 |
|
|
Seagrass |
0 |
2 |
1 |
8 |
11 |
72.72 |
|
|
Total |
13 |
13 |
15 |
9 |
50 |
||
|
PA (%) |
81.81 |
84.61 |
76.92 |
80 |
88.88 |
||
|
OA (%) |
76 |
82 |
|||||
Based on Table 3 above, the Sentinel-2A Level-2A classification for Rakit Island achieved an OA of 70%. The highest UA was found in the rubble class of 75%, while the highest PA was recorded in the coral reef class at 83.33%. However, the seagrass class showed a notably low UA of 64.28%, indicating classification difficulty in this category. In contrast, Table 4 shows that SPOT-7 imagery again demonstrated superior classification performance, achieving an overall accuracy of 82%. The rubble class maintained the highest UA of 84.61%, and the seagrass class achieved the highest PA of 88.88%, reflecting strong detection consistency for both benthic habitats. The comparative results from Tables 1 to 4 clearly show the consistent superiority of SPOT-7 imagery over Sentinel-2A Level-2A in classifying benthic habitats, particularly sand, seagrass, and coral reef areas. In both spatial contexts, Liang Island (2016) and Rakit Island (2021), SPOT-7 yielded higher OA (84% and 82%, respectively), compared to Sentinel-2A Level-2A (76% and 70%). SPOT-7’s enhanced accuracy is largely attributable to its higher spatial resolution (1.5–6 m), which enables better separation of narrow or spectrally similar benthic features. This was evident in its ability to classify seagrass beds and coral reefs more effectively, as indicated by its consistently higher PA and UA values across both sites. Meanwhile, Sentinel-2A Level-2A, with its coarser resolution (10–20 m), struggled especially with the seagrass category, where spectral confusion with adjacent sandy or rubble substrates led to lower classification reliability. Despite offering broad coverage and corrected reflectance data, its utility appears to be more appropriate for larger-scale or generalized habitat mapping rather than fine-scale coastal ecosystem assessments. In conclusion, the combined accuracy assessment from all four tables confirms that SPOT-7 is a more reliable source for detailed mapping of coastal and shallow marine habitats, making it the preferred option for conservation planning, habitat monitoring, and environmental management in spatially heterogeneous reef environments (Agus et al. 2018).
To provide a clear spatial understanding of benthic ecosystem conditions around Liang Island, a comparative analysis of coral reef habitat distribution was conducted using two satellite imagery sources from 2016, namely Sentinel-2A and SPOT-7. These products were selected to evaluate the effectiveness of each in detecting the extent and diversity of shallow marine habitats, particularly coral reefs, seagrass beds, sand, and rubble. This comparison also serves to assess the influence of image resolution and correction techniques on classification accuracy in complex coastal environments. For more details, see the map in Fig. 3 below.
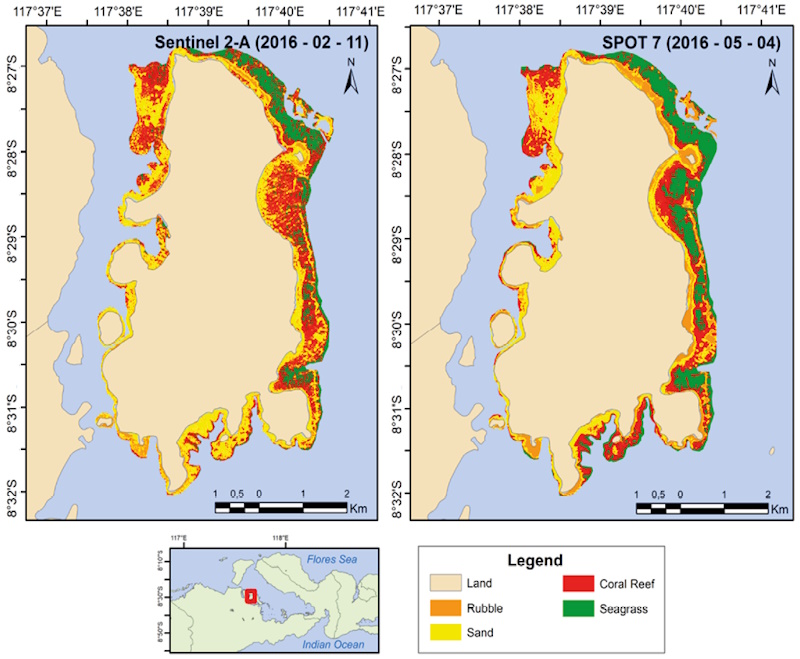
Fig. 3. Spatial distribution of coral reef habitats in Liang Island in 2016 based on Sentinel-2A (left panel) and SPOT-7 (right panel) satellite imagery
Based on the map in Fig. 3 above, a comparison of benthic habitat distribution around Liang Island in 2016, derived from Sentinel-2A imagery (left panel) and SPOT-7 imagery (right panel), shows classification accuracy and habitat detail across coral reef, seagrass, sand, and rubble zones. Both images reveal similar coastal ecosystem patterns, indicating general agreement in habitat identification. However, key differences in spatial precision are evident. The Sentinel-2A image shows broader coral reef coverage, especially along the northern and eastern shores, possibly due to its spectral sensitivity to large-area reflectance. In contrast, SPOT-7’s sharper resolution allows for more detailed mapping in complex habitats, as seen in the clearer depiction of seagrass beds along the southern and eastern coasts, which are less visible in Sentinel-2A. SPOT-7’s ability to capture smaller and patchier features makes it more effective for mapping fine-scale ecosystems, such as narrow seagrass corridors or fragmented beds. Rubble zones, typically linked to reef degradation, are more concentrated and clearly defined in SPOT-7, supporting accurate identification of disturbed areas. Such detail is vital for restoration planning and reef health monitoring. These findings are consistent with the work of Fakan et al. (2025), who demonstrated that high-resolution satellite imagery, such as SPOT-7, significantly improves the detection of degraded reef structures and enhances the delineation of coastal habitat transitions. While Sentinel-2A is suited for broader regional assessments, SPOT-7 performs better for local-scale analyses where habitat complexity and degradation are management priorities. The datasets are thus complementary: Sentinel-2A for regional trends and SPOT-7 for detailed habitat mapping and conservation planning.
This contrast is further evident in the 2021 classification results over Rakit Island (Fig. 4). Sentinel-2A offers wide regional coverage but lacks spatial detail, while SPOT-7 delivers clearer delineation of reef, seagrass, and rubble features, highlighting its utility for fine-scale habitat monitoring and degradation detection. For more details, see the map in Fig. 4 below.
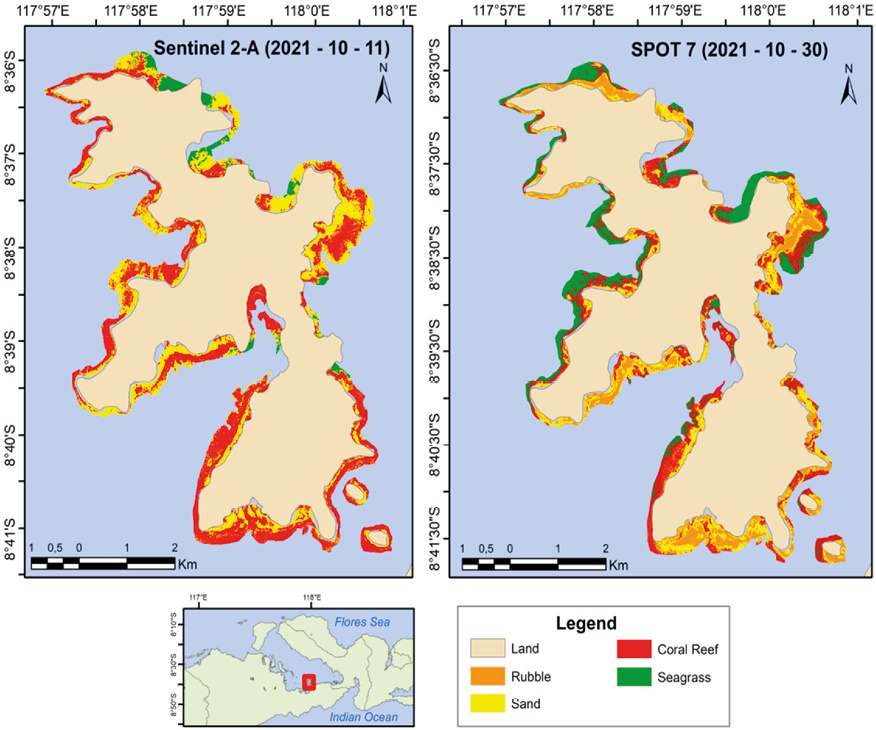
Fig. 4. Spatial distribution of coral reef habitats in Rakit Island in 2021 based on Sentinel-2A (left panel) and SPOT-7 (right panel) satellite imagery
Based on the map in Fig. 4 above, a comparison of benthic habitat distribution around Rakit Island in 2016, derived from Sentinel-2A imagery (left panel) and SPOT-7 imagery (right panel), is presented. Similar to Fig. 3, both maps delineate four habitat types, namely coral reef, seagrass, sand, and rubble, enabling a visual evaluation of classification accuracy and habitat detail between the two satellite datasets. Both images reveal similar coastal ecosystem patterns, indicating general agreement in identifying habitat zones. In the Sentinel-2A image, the distribution of benthic habitats appears more fragmented and diffusely scattered along the coastline. Although the image provides broad regional coverage and captures seagrass and sand areas relatively well, the delineation of coral reefs in several locations is less distinct, particularly in areas with complex substrate transitions or narrow reef formations. This limitation reflects the moderate spatial resolution of Sentinel-2A, which may not fully capture fine-scale ecosystem variability. By contrast, SPOT-7 imagery offers a more precise and detailed depiction of coastal habitats. Coral reefs and seagrass beds appear more clearly defined and spatially concentrated in certain sections of the coastline, particularly along the eastern and southern fringes. The higher spatial resolution of SPOT-7 allows for enhanced detection of smaller and more heterogeneous features, such as fragmented seagrass patches or narrow reef corridors, which are often overlooked in coarser imagery. Additionally, rubble zones, often associated with coral degradation or disturbance, are more distinct and localized in the SPOT-7 image. This enhanced detectability is important for identifying areas impacted by natural changes or anthropogenic activities, such as coastal development, destructive fishing, or sedimentation (Putra et al. 2023). The ability to capture such subtle topographic and ecological variations highlights the value of high-resolution imagery for targeted reef monitoring and restoration.
The comparison between Sentinel-2A and SPOT-7 in this context clearly illustrates how differences in resolution and image acquisition techniques can significantly influence habitat mapping outcomes. While Sentinel-2A remains useful for regional-scale monitoring, it may lack the spatial detail required for precise habitat delineation. SPOT-7, on the other hand, offers sharper imagery that enhances accuracy in detecting ecosystem boundaries and degradation zones. These findings support the study by Cruz et al. (2024), who emphasized that combining medium- and high-resolution satellite imagery improves the accuracy and reliability of coastal habitat assessments. This approach is particularly relevant for conservation planning and monitoring ecosystem responses to climate change and human pressures. The integration of Sentinel-2A and SPOT-7 datasets provides complementary benefits, balancing regional coverage and spatial detail to enhance the effectiveness of coastal ecosystem monitoring and management.
To support the visual interpretations of habitat distribution presented in the previous figures (Figs. 3 and 4), Table 5 and Table 6 provide a detailed quantitative assessment of the classified benthic habitat areas derived from Sentinel-2A Level-2A and SPOT-7 satellite imagery. These tables represent the area (in hectares/ha) and percentage coverage of four dominant coastal ecosystem classes, namely rubble, sand, coral reef, and seagrass, as mapped in two different years and locations. Table 5 shows data from Liang Island in 2016, while Table 6 shows similar classification results for Rakit Island in 2021.
Table 5. Area of classification class in Liang Island Sentinel-2A Level-2A and SPOT-7 2016
|
No |
Class |
Level-2A Sentinel Area (ha) |
Percentage Sentinel-2A Level-2A (%) |
SPOT-7 area (ha) |
Percentage SPOT-7 (%) |
|
1 |
Rubble |
1.14 |
24.8 |
1.19 |
25.1 |
|
2 |
Sand |
1.12 |
24.3 |
1.16 |
24.5 |
|
3 |
Coral Reef |
1.21 |
26.3 |
1.19 |
25.1 |
|
4 |
Seagrass |
1.13 |
24.6 |
1.2 |
25.3 |
Table 6. Area of classification class on Rakit Island Sentinel-2A Level-2A and SPOT-7 2021
|
No |
Class |
Level-2A Sentinel Area (ha) |
Percentage Sentinel-2A Level-2A (%) |
SPOT-7 area (ha) |
Percentage SPOT-7 (%) |
|
1 |
Rubble |
1.13 |
25.6 |
1.192 |
25.2 |
|
2 |
Sand |
1.19 |
27.0 |
1.193 |
25.2 |
|
3 |
Coral Reef |
1.18 |
26.8 |
1.197 |
25.3 |
|
4 |
Seagrass |
0.91 |
20.6 |
1.15 |
24.3 |
By comparing the area values derived from Sentinel-2A and SPOT-7, these tables highlight the degree of agreement and difference between medium- and high-resolution satellite imagery in mapping the spatial extent of each habitat class. The data also reveal consistent patterns, with coral reef and seagrass generally occupying the largest proportion, followed by rubble and sand. These two tables allow a cross-site comparison of habitat classification accuracy between Liang Island (2016) and Rakit Island (2021), thus strengthening the evaluation of satellite image performance in varying ecological and geomorphological settings. For more details, see Tables 5 and 6 below.
These classification results from Liang Island in 2016 (Table 5) are further complemented by similar analyses conducted for Rakit Island in 2021, as shown in Table 6 below, allowing spatial comparisons between two different coral reef ecosystems within Saleh Bay that were observed in different years.
Based on Tables 5 and 6 (also Fig. 5) above, a comparison was made between habitat classifications for Liang Island (2016) and Rakit Island (2021) using Sentinel-2A Level-2A and SPOT-7 imagery. Each dataset reflects the spatial extent (in hectares/ha and percentages) of four key benthic habitat types: rubble, sand, coral reefs, and seagrass. This comparison offers insight into how spatial resolution affects habitat delineation outcomes across both locations. In the case of Liang Island, Sentinel-2A estimated rubble at 1.14 ha (24.8%), sand at 1.12 ha (24.3%), coral reefs at 1.21 ha (26.3%), and seagrass at 1.13 ha (24.6%). Meanwhile, SPOT-7 recorded slightly higher values for rubble (1.19 ha), sand (1.16 ha), and seagrass (1.20 ha), with coral reefs slightly lower at 1.19 ha. These marginal differences suggest that SPOT-7’s finer resolution enables better discrimination of habitat boundaries, especially for features that are spatially limited or irregular in shape. In the Rakit Island 2021 dataset, discrepancies became more distinct. Sentinel-2A identified seagrass at only 0.91 ha (20.6%), compared to 1.15 ha (24.3%) in the SPOT-7 image. Coral reef, sand, and rubble classes also showed minor differences, but the most pronounced gap remained in seagrass detection. This suggests that Sentinel-2A’s resolution may be insufficient to accurately capture narrow, fragmented, or submerged vegetation, particularly in optically complex coastal environments.
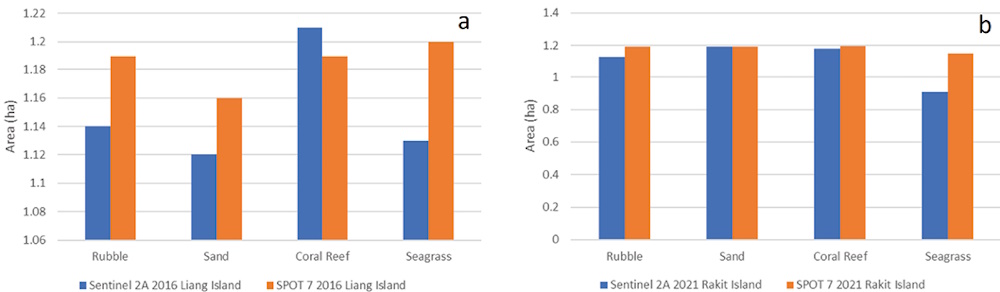
Fig. 5. Class area differences between Sentinel-2A and SPOT-7 habitat classifications for Liang Island (2016, panel a) and Rakit Island (2021, panel b)
Fig. 5 visually supports these findings through side-by-side bar graphs, reinforcing that SPOT-7 consistently maps larger areas of seagrass and coral reefs at both sites. These results point to the superior ability of high-resolution imagery to detect fine-scale spatial patterns and benthic complexity, which are often underestimated by medium-resolution sensors. This outcome aligns with the findings of Eugenio et al. (2017), who emphasized the advantages of high-resolution data for improving benthic ecosystem classification. Further supporting this, Caras et al. (2017) highlighted the importance of fine spatial resolution in capturing narrow reef features that are frequently missed by coarser sensors. Similarly, Purkis et al. (2018) noted that SPOT-7 is more effective at identifying transitional substrates and degraded reef zones, which are crucial indicators of ecological condition. The integration of multiple spatial resolutions has also been shown to enhance classification performance. For example, Hedley et al. (2018) demonstrated that combining Sentinel-2A with higher-resolution imagery improves mapping accuracy in heterogeneous benthic environments. DeVries et al. (2017) further reported that medium-resolution sensors tend to underestimate submerged vegetation in turbid or shallow waters. Meanwhile, Lyons et al. (2014) concluded that classification error rates significantly decrease when imagery resolution is below 5 meters, a condition satisfied by SPOT-7. These results affirm the value of SPOT-7 for detailed, site-specific habitat mapping, particularly in areas where precision is essential for coastal management, reef restoration, and conservation zoning. When used in tandem with broader-coverage platforms like Sentinel-2A, high-resolution imagery becomes a vital component of a multi-scale remote sensing strategy, yielding more comprehensive and reliable information for benthic habitat monitoring and spatial planning.
This study confirms that SPOT-7 satellite imagery offers significant advantages over Sentinel-2A in the classification and spatial delineation of coral reef habitats, particularly in capturing seagrass beds, coral structures, and rubble zones with greater clarity. The comparative analysis conducted for Liang Island (2016) and Rakit Island (2021) revealed consistent patterns in which SPOT-7 detected larger and more fragmented habitat patches, reflecting its ability to resolve fine-scale ecological features often missed by coarser-resolution sensors. Although Sentinel-2A provided broader regional coverage and slightly higher estimates for sand areas, it tended to underrepresent seagrass and coral reef extents, especially in areas with complex benthic configurations. In contrast, SPOT-7 consistently produced more accurate and spatially detailed classifications, with overall classification accuracies of 84% for Liang Island and 82% for Rakit Island, underscoring its superiority in habitat boundary detection and degradation assessment. These results highlight the essential role of high-resolution satellite imagery in supporting ecosystem-based management, particularly for the monitoring, restoration, and spatial planning of coral reef environments. The integration of high-resolution data such as SPOT-7 into routine monitoring frameworks can substantially enhance the quality of information available to decision-makers, enabling more effective conservation interventions and adaptive coastal governance.
1. Agus F, Jatiwibowo R, Kamil ZA and Gifari OI. (2024). Prediksi luas vegetasi Kota Samarinda-Kalimantan Timur menggunakan metode NDVI dan klasifikasi terbimbing. Journal of Tropical Forests, 12(1), 31–39. DOI: 10.20527/jht.v12i1.19021
2. Agus SB, Aziizah NN, Subarno T and Sunudin A. (2018). The utilization of Spot-7 imagery for mapping seagrass distribution on intertidal zone and water depth estimation in Wawonii Island. Journal of Tropical Marine Science and Technology, 10(1), 197–207. DOI: 10.29244/jitkt.v10i1.19119
3. Amran MA. (2024). Dasar-dasar penginderaan jauh satelit. Nas Media Library.
4. Arifin T, Yulius, Ramdhan M, Johan O, Gunawan DP, Heriati A, Mustikasari E, Rahmania R, Purbani D, Dillenia I, Agus SB, Asaf R, Hatta M, Marzuki I, Akhwady R, Sufyan A and Fihrin H. (2025). Mariculture site selection based on water quality, cultivation and ecological condition. Global Journal of Environmental Science and Management, 11(1), 1–18. DOI: 10.22034/gjesm.2025.01
5. Atmodjo E, Lamers M and Mol APJ. (2020). Governing dynamics in marine conservation tourism in Raja Ampat, Indonesia. Tourism Planning & Development, 17(6), 655–673. DOI: 10.1080/21568316.2019.1686652
6. Azzahra RY, Yulius, Agus SB, Aditama FA, Arifin T, Putra A, Heriati A, Purbani D, Prihantono J, Salim HL, Ramdhan M, Rahmania R, Wahyono A, Ningsih A, Saad S and Asyiri A. (2025). Advancing mangrove carbon stock monitoring with drone and Pleiades imagery on Gilibakau Island–Saleh Bay, Indonesia. Journal of Marine and Island Cultures, 14(1), 88–101. DOI: 10.21463/jmic.2025.14.1.06
7. Bernardo N, Watanabe F, Rodrigues T and Alcântara E. (2017). Atmospheric correction issues for retrieving total suspended matter concentrations in inland waters using OLI/Landsat-8 image. Advances in Space Research, 59(9), 2335–2348. DOI: 10.1016/j.asr.2017.02.017
8. Borfecchia F, Consalvi N, Micheli C, Carli FM, Cognetti De Martiis S, Gnisci V, Piermattei V, Belmonte A, De Cecco L, Bonamano S and Marcelli M. (2018). Landsat 8 OLI satellite data for mapping of the Posidonia oceanica and benthic habitats of coastal ecosystems. International Journal of Remote Sensing, 39(20), 6715–6732. DOI: 10.1080/01431161.2018.1528020
9. Caras T, Hedley J and Karnieli A. (2017). Implications of sensor design for coral reef detection: Upscaling ground hyperspectral imagery in spatial and spectral scales. International Journal of Applied Earth Observation and Geoinformation, 63, 68–77. DOI: 10.1016/j.jag.2017.07.009
10. Cruz C, Perrin PM and Martin JR. (2024). Mapping of temperate upland habitats using high-resolution satellite imagery and machine learning. Environmental Monitoring and Assessment, 196, Article 869. DOI: 10.1007/s10661-024-12998-0
11. Darweesh KF, Hellal AM, Saber SA, EL-Kafrawy SB, Abdelsalam AA and EL-Naggar HA. (2021). Three decades of remote sensing habitat mapping, along the Egyptian coast of Aqaba Gulf, Red Sea. Egyptian Journal of Aquatic Biology & Fisheries, 25(6), 467 – 487
12. DeVries B, Huang C, Lang MW, Jones JW, Huang W, Creed IF and Carroll ML. (2017). Automated quantification of surface water inundation in wetlands using optical satellite imagery. Remote Sensing, 9(8), 807. DOI: 10.3390/rs9080807
13. Edrus IN, Arief S and Setyawan E. (2017). Kondisi kesehatan terumbu karang Teluk Saleh, Sumbawa: Tinjauan aspek substrat dasar terumbu dan keanekaragaman ikan karang. Indonesian Fisheries Research Journal, 16(2), 147–161. DOI: 10.15578/jppi.16.2.2010.147-161
14. Eugenio F, Marcello J, Martín J and Rodríguez-Esparragón D. (2017). Benthic habitat mapping using multispectral high-resolution imagery: Evaluation of shallow water atmospheric correction techniques. Sensors, 17(11), 2639. DOI: 10.3390/s17112639
15. Farhum MF, Jompa J, Restu M and Salman D. (2021). Management effectiveness of the Bunaken National Park, Indonesia. AACL Bioflux, 14(2), 1089-1097.
16. Fakan EP, Dubuc A, Hemingson CR, McCormick MI and Hoey AS. (2025). Habitat degradation has species-specific effects on the stress response of coral reef fishes. Journal of Experimental Marine Biology and Ecology, 582, 152070. DOI: 10.1016/j.jembe.2024.152070
17. Febriandi, Fatimah S, Triyatno, Hermon D, Putra A, Mutmainah H, Arifin T and Akhwady R. (2025). Predicting of land cover changes until 2030 and assessing sustainability status in the Mandeh region, Indonesia. Geographia Technica, 20(1), 263–280. DOI: 10.21163/GT_2025.201.18
18. Flament T, Trapon D, Lacour A, Dabas A, Ehlers F, Huber D and et al. (2021). Aeolus L2A aerosol optical properties product: Standard correct algorithm and Mie correct algorithm. Atmospheric Measurement Techniques, 14(12), 7851–7871. DOI: 10.5194/amt-14-7851-2021
19. Herdianti TP, Yulius, Agus SB, Arifin T, Putra A, Prihantono J, Heriati A, Hartati ST, Akhwady R, Suryono DD, Rahmania R, Ramdhan M, Hilmawan A, Ningsih A, Saad S, Mudjiono M and Asyiri A. (2025). Habitat assessment of whale sharks (Rhincodon typus) in Saleh Bay, Indonesia: Linking chlorophyll-a and sea surface temperature using Aqua MODIS data. Geographia Technica, 20(2), 52–64. DOI: 10.21163/GT_2025.202.04
20. Hedley J D, Harborne A R and Mumby P J. (2005). Technical note: Simple and robust removal of sun glint for mapping shallow-water benthos. International Journal of Remote Sensing, 26(10), 2107–2112. DOI: 10.1080/01431160500034086.
21. Hedley JD, Roelfsema C, Brando V, Giardino C, Kutser T, Phinn S, Mumby PJ, Barrilero O, Laporte J and Koetz B. (2018). Coral reef applications of Sentinel-2: Coverage, characteristics, bathymetry and benthic mapping with comparison to Landsat 8. Remote Sensing of Environment, 216, 598–614. DOI: 10.1016/j.rse.2018.07.014
22. Ilyas TP, Nababan B, Maduppa H and Kushardono D. (2020). Seagrass ecosystem mapping with and without water column correction in Pajenekang Island Waters, South Sulawesi. Jurnal Ilmu dan Teknologi Kelautan Tropis, 12(1), 9–23. DOI: 10.29244/jitkt.v12i1.26598
23. Indey JFI and Supangat S. (2024). Implementasi algoritma Naïve Bayes dalam sistem pengarsipan surat berbasis AI di GPI Papua Klasis Mimika Papua Tengah. Jurnal Ilmiah Informatika, 12(02), 102–113. DOI: 10.33884/jif.v12i02.9087
24. Irawan J, Sasmito B and Suprayogi A. (2017). Pemetaan sebaran terumbu karang dengan metode algoritma Lyzenga secara temporal menggunakan citra Landsat 5 7 dan 8 (Studi Kasus: Pulau Karimunjawa). Jurnal Geodesi Undip, 6(2), 56–61. DOI: 10.14710/jgundip.2017.16256
25. Ji X, Yang B, Wei Z, Wang M, Tang Q, Xu W, Wang Y, Zhang J and Zhang L. (2024). Benthic habitat sediments mapping in coral reef area using amalgamation of multi-source and multi-modal remote sensing data. Remote Sensing of Environment, 304, 114032. DOI: 10.1016/j.rse.2024.114032
26. Johan O, Yulius, Salim HL, Ardi I, Abrar M and Daulat A. (2019). The existence of ornamental coral in different live coral coverage conditions in Saleh Bay, West Nusa Tenggara. Segara Journal, 15(2), 99–108. DOI: 10.15578/segara.v15i2.6592
27. Kusumawati E, Susilo SB, Agus SB, Arifin T and Yulius. (2019). Analisis penentuan sebaran konsentrasi klorofil-a dan produktivitas primer di perairan Teluk Saleh menggunakan citra satelit Landsat OLI 8. Jurnal Pengelolaan Sumberdaya Alam dan Lingkungan, 9(3), 671–679. DOI: 10.29244/jpsl.9.3.671-679
28. Lyons MB, Murray NJ, Kennedy EV, Kovacs EM, Castro-Sanguino C, Phinn SR, Borrego Acevedo R, Ordóñez Alvarez A, Say C, Tudman P, Markey K, Roe M, Canto RF, Fox HE, Bambic B, Lieb Z, Asner GP, Martin PM, Knapp DE, Li J, Skone M, Goldenberg E, Larsen K and Roelfsema CM. (2024). New global area estimates for coral reefs from high-resolution mapping. Cell Reports Sustainability, 1(2), 100015. DOI: 10.1016/j.crsus.2024.100015
29. Panjaitan JP, Mahendratama G and Siregar V. (2025). Benthic habitats mapping in Pari Island, Kepulauan Seribu, Indonesia using drone and Sentinel-2B imagery with object based image analysis method. BIO Web of Conferences, 168, 05004. DOI: 10.1051/bioconf/202516805004
30. Poursanidis D, Topouzelis K and Chrysoulakis N. (2018). Mapping coastal marine habitats and delineating the deep limits of the Neptune’s seagrass meadows using very high resolution Earth observation data. International Journal of Remote Sensing, 39(23), 8670–8687. DOI: 10.1080/01431161.2018.1490974
31. Pratomo DG, Cahyadi MN, Hariyanto IH, Syariz MA and Putri SA. (2024). Lyzenga algorithm for shallow water mapping using multispectral Sentinel-2 imageries in Gili Noko waters. BIO Web of Conferences, 89, 07006. DOI: 10.1051/bioconf/20248907006
32. Purkis SJ. (2018). Remote sensing tropical coral reefs: The view from above. Annual Review of Marine Science, 10, 149–168. DOI: 10.1146/annurev-marine-121916-063249
33. Putra A, Triyatno, Darwis R, Dewata I, Tanto TA, Mustapha MA, Razi P and Zainul R. (2023). Suitability of mangrove ecosystems as a protected zone based on land-use changes. Physical Oceanography, 30(6), 866–881.
34. Putra A, Faristyawan R, Triyatno T, Putra BG, Prasetyo A, Yulius, Ameliya Z, Arifin T, Razi P and Triarjunet R. (2026). Land cover changes (2002–2022) using Landsat imagery and pixel-based classification: Supporting coastal conservation strategies in Tanjung Mutiara. Springer Proceedings in Earth and Environmental Sciences, Part F1158, 751–763. DOI: 10.1007/978-981-95-3075-5_57
35. Rahman AM, Purbani D, Agus SB, Arifin T, Yulius, Putra A, Heriati A, Prihantono J, Akhwady R, Sufyan A, Mustikasari E, Purnamaningtyas SE, Rahmania R, Saad S and Tjahjo DWH. (2025). Hydrodynamic modeling of pollutant distributions from the Bera watershed and its impact to the coastal area of Saleh Bay, West Nusa Tenggara, Indonesia. Geographia Technica, 20(2), 31–51. DOI: 10.21163/GT_2025.202.03
36. Rahmaddeni R, Wulandari D, Renova M, Ramadhan G and Sari R. (2024). Machine learning. Padang: Serasi Media.
37. Simarmata N, Wikantika K, Tarigan TA, Aldyansyah M, Tohir RK and Putra A. (2024). Comparative analysis of reflectance values on Sentinel-2A image with field spectroradiometer in mangrove forest on East Coast Lampung. AIP Conference Proceedings, 3001(1), 090001. DOI: 10.1063/5.0184159
38. Suasti Y, Prarikeslan W, Syah N, Triyatno and Putra A. (2020). A mapping of changes in coral reefs condition based on development the marine ecotourism in the southern part coast of Padang City – Indonesia. International Journal of GEOMATE, 19(76), 157–164. DOI: 10.21660/2020.76.ICGeo4
39. Tanis FJ and Lyzenga DR. (1981). Development of Great Lakes algorithms for the Nimbus-G Coastal Zone Color Scanner: Phase I – Final technical report (NASA-CR-173511). NASA/Lewis Research Center and Environmental Research Institute of Michigan.
40. Turker M and Ozdarici A. (2011). Field-based crop classification using SPOT4, SPOT5, IKONOS and QuickBird imagery for agricultural areas: A comparison study. International Journal of Remote Sensing, 32(24), 9735–9768. DOI: 10.1080/01431161.2011.576710
41. Xie Y, Sha Z and Yu M. (2008). Remote sensing imagery in vegetation mapping: A review. Journal of Plant Ecology, 1(1), 9–23. DOI: 10.1093/jpe/rtm005
42. Yulius, Ramdhan M, Prihantono J, Priyambodo DG, Saepuloh D, Salim HL, Rizaki I and Zahara RI. (2019). Budidaya rumput laut dan pengelolaannya di pesisir Kabupaten Dompu, Provinsi Nusa Tenggara Barat berdasarkan analisa kesesuaian lahan dan daya dukung lingkungan. Jurnal Segara, 15(1), 19–30. DOI: 10.15578/segara.v15i1.7429
Department of Marine Science and Technology, Faculty of Fisheries and Marine Sciences.
Jl. Agatis No 1, Bogor 16680
Department of Marine Science and Technology, Faculty of Fisheries and Marine Sciences.
Jl. Agatis No 1, Bogor 16680
Jl. Raya Jakarta–Bogor Km 46, Cibinong, Bogor 16911
Jl. Raya Jakarta–Bogor Km 46, Cibinong, Bogor 16911
Jl. Raya Jakarta–Bogor Km 46, Cibinong, Bogor 16911
Jl. Sangkuriang, Bandung 40135
Jl. Raya Jakarta–Bogor Km 46, Cibinong, Bogor 16911
Jl. Raya Jakarta–Bogor Km 46, Cibinong, Bogor 16911
Jl. Raya Jakarta–Bogor Km 46, Cibinong, Bogor 16911
Jl. Raya Jakarta–Bogor Km 46, Cibinong, Bogor 16911
Jl. Raya Jakarta–Bogor Km 46, Cibinong, Bogor 16911
Jl. Raya Jakarta–Bogor Km 46, Cibinong, Bogor 16911
Jl. Raya Jakarta–Bogor Km 46, Cibinong, Bogor 16911
Department of Marine Science and Technology, Faculty of Fisheries and Marine Sciences.
Jl. Agatis No 1, Bogor 16680
Agus S.B., Maulana A.S., Arifin T., Yulius , Putra A., Ramdhan M., Heriati A., Rahmania R., Prihantono J., Sufyan A., Mustikasari E., Asaf R., Athirah A., Fihrin H. Mapping of Coral Reef Habitats Using Spot-7 And Sentinel-2 Satellite Imagery in Liang and Rakit Islands, Saleh Bay, Indonesia. GEOGRAPHY, ENVIRONMENT, SUSTAINABILITY. 2026;19(1):6-16. https://doi.org/10.24057/2071-9388-2026-3811
 Email this article (Login required)
Email the author (Login required)
Email this article (Login required)
Email the author (Login required) 
Editor-in-Chief
Kasimov Nikolay S.Lomonosov Moscow State University
Moscow 119991 Russia, Leninskie Gory, Faculty of Geography, 1806a
Phone +7 495 939-15-52
E-mail: ges-journal@geogr.msu.ru





