


Contents
Scroll to:
https://doi.org/10.24057/2071-9388-2020-24
Scroll to:
Community adaptation to the negative impacts of climate change benefits from an analysis of both the trends in climate variables and people’s perception of climate change. This paper contends that members of the local community have observed changes in temperature and rainfall patterns and that these perceptions can be positively correlated with meteorological records. This is particularly useful for remote regions like Lamu whereby access to weather data is spatially and temporally challenged. Linear trend analysis is employed to describe the change in temperature and rainfall in Lamu using monthly data obtained from the Kenya Meteorological Department (KMD) for the period 1974–2014. To determine local perceptions and understanding of the trends, results from a household survey are presented. Significant warming trends have been observed in the study area over the period 1974–2014. This warming is attributed to a rise in maximum temperatures. In contrast to temperature, a clear picture of the rainfall trend has not emerged. Perceptions of the local community closely match the findings on temperature, with majority of the community identifying a rise in temperature over the same period. The findings suggest that the process of validating community perceptions of trends with historical meteorological data analysis can promote adaptation planning that is inclusive and responsive to local experiences.
Yvonne M., Ouma G., Olago D., Opondo M. Trends In Climate Variables (Temperature And Rainfall) And Local Perceptions Of Climate Change In Lamu, Kenya. GEOGRAPHY, ENVIRONMENT, SUSTAINABILITY. 2020;13(3):102-109. https://doi.org/10.24057/2071-9388-2020-24
It is possible that climate change is the biggest threat to developing economies (Adger et al. 2003). Depending on where they live and their ability to cope with different climate hazards, projected climate change will alter the lives of the most vulnerable populations (Devkota 2014; Adger et al. 2003; Dubenu & Obeng 2016; Raheem & Olarunfemi 2013; Olanrewaju et al. 2017; Mohammed & Fallah 2019). Temperature is on the rise in Africa (Niang et al. 2014). The Intergovernmental Panel on Climate Change (IPCC) predicts higher temperature increases in the region than the global mean temperature increase (Niang et al. 2014). This would mean an increase in hot nights, as well as longer and more frequent heat waves. The western Sahel region will experience the strongest drying, with a significant increase in the maximum length of dry spells (Niang et al. 2014). The impacts of climate change are expected to worsen existing vulnerabilities in Africa. Particularly as the region already endures high temperatures and low precipitation, frequent droughts, food insecurity and water scarcity (Kabubo-Mariara 2008; Kotir 2011; Ozor et al. 2012).
Kenya is highly vulnerable to the impacts of climate change. By the year 2100, it is predicted that climate change will increase temperatures in Kenya by about 4°C and cause variability of rainfall by up to 20% (Kabubo-Mariara 2008; Awuor et al. 2008; Bryan et al. 2013; Niang et al. 2014). This will have significant effects on agricultural productivity, water availability and access. The focus of this study is Lamu, one of the six coastal counties in Kenya located in the country's northern coast. Arguably, coastal communities are even more vulnerable to climate change, particularly in relation to water (Dolan and Walker 2003; Kundzewicz et al. 2008; 2009). As climate becomes warmer and the sea level rises, coastal communities are at risk of salt-water intrusion into aquifers. They are also faced with flooding of coastal wetlands and marshes, lower oxygen levels in wetlands, ocean acidification due to higher concentrations of carbon dioxide in the atmosphere and the associated impacts of more severe coastal storms (Kundzewicz et al. 2008; 2009; Ballinger 2015; Herron et al. 2015). These have significant implications on coastal water systems and as such, impact on water availability and quality. These impacts may occur in tandem with other existing stressors such as infrastructural development and coastal population growth, presenting new and different challenges to coastal communities.
Examining the trends in rainfall and temperature over a period of at least thirty years is vital to assess climate-induced changes and suggest feasible adaptation strategies. However, this becomes difficult in extremely remote areas where meteorological stations were established in the last twenty or thirty years. In such cases, the perceptions and experiences of the community can be used to provide some indication of weather patterns in the absence of sufficient meteorological data. Furthermore, the perceptions and experiences of the local community are significant in aiding overall adaptation planning. It is important to understand local stakeholders attitudes and perceptions regarding climate change as they must first perceive and have knowledge of climate change in order to effectively adapt and have the motivation to do so (Muzari et al. 2014; Martinez et al. 2018). When the localised impacts of climate change (including societal, economic and developmental) are considered, adaptation is more likely to be sustainable (Adger 1999; Cutter et al. 2009).
Lamu is one of the 47 counties in Kenya and it is located in the northeastern coast of Kenya (Fig. 1). It consists of the mainland and the Lamu Archipelago. It covers a total land surface area of 6273.1 sq. km, bordering Garissa County to the North, the Indian Ocean to the South and South East, and Tana River to the South West and West. Based on the Koppen-Geiger climate classification, Lamu County can be classified as being between a Tropical Monsoon and Arid Steppe hot climate (Kulima Report 2014). The area is characterized by a bimodal rainfall distribution pattern with approximately 540mm annual rainfall and a mean temperature of 28°C. The range of temperature is from 23°C to 32°C throughout the county. The coldest months are May to July while the hottest months are December to April.
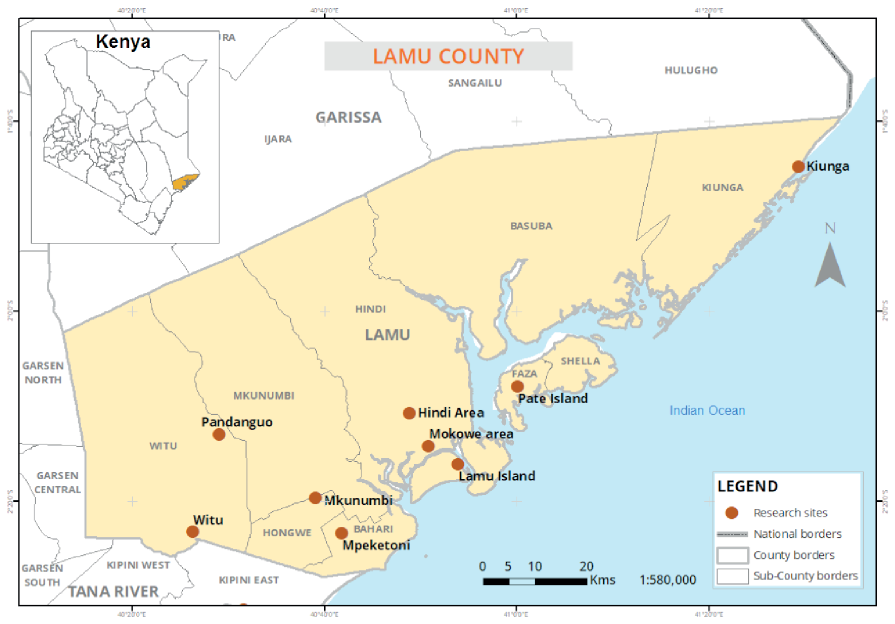
Fig. 1. Map of Lamu County
The tides are semidiurnal, with a mean range of 2.5 - 3m and a maximum range of around 4m (Kulima Report 2014; Church & Palin 2003). The climate and weather patterns on the Kenyan coastline are dominated by large-scale pressure systems of the western Indian Ocean (El Nino, Indian Ocean Dipole and the Madden Julian Oscillation) and two distinct monsoon seasons. During March and April, the wind blows in east to southerly direction with strong incursions of maritime air from the Indian Ocean bringing heavy rains (the so-called «long rains») from mid-April to the end of June. In the months of May to August, the South-Easterly Monsoon (SEM) influence sets in and the weather becomes stable with cooler temperatures. Between September and December, the northeast monsoon, dominates again, bringing «short rains» from November to December.
Temperature and rainfall data was obtained from the Kenya Meteorological Department (KMD) for the Lamu Meteorological Station (Station ID: 9240001) for the period 1974-2014. This is the only meteorological station in Lamu and the time frame represents the total period that the Lamu Meteorological Station has been operational. Rainfall data was in the form of average daily totals, monthly average precipitation and total amount of rainfall received annually. While temperature data was in the form of monthly maximum and minimum average, annual maximum and minimum average. For the missing data sets, 4 data points on either side of the missing values were taken and their average used to fill in the data gaps. The data was run through SPSS chart builder to create line graphs and depict the trends. A linear regression model was used to analyse the trends to determine if the independent variable (time) was a significant predictor of the dependent variables (rainfall/temperature). The independent sample t-test was used to compare whether there was a significant difference in mean rainfall between the short and long rains period.
To gain an understanding of the people's perceptions on temperature and rainfall, a household survey was conducted with 552 households in Lamu County, through random sampling. According to the Lamu County Integrated Development Plan (2013), the projected population of Lamu County comprised 112,551 persons in 2017. The study sample size (number of participants in the study) was determined by the Yamane (1967) equation:
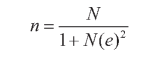
Where n is the sample size, N is the population size and e is the allowable error (5%). For this study:
A sample size of 399 individuals was generated for a statistically significant representation of the population. The Yamane equation was used to avoid bias in interpreting the results. If too few participants were included in the study, the results could not be generalised to the population, as the sample would not represent the size of the target population. The study targeted a total of 552 respondents to ensure a confidence level of 99% and confidence interval of 5.76. Due to the low and scattered nature of population in Lamu County, the household survey was administered in the more densely populated parts of Lamu (i.e. Lamu Island, Mpeketoni, Pate Island, Pandanguo, Mkunumbi, Hindi Area, Mokowe Area and Witu (Fig. 1). A structured questionnaire using the KoboToolBox (an android enabled platform) was used to gather detailed information on the respondents' observations of temperature and rainfall over a ten-year period (1996-2016). Both open-ended and closeended questions were included in the questionnaire. Descriptive and inferential statistical analysis was utilised to examine the differences and relationships among the population.
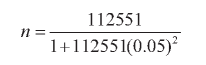
During the forty-year period (1974-2014), a maximum and a minimum annual average temperature of 30.9∞C and 24.0∞C was observed in Lamu respectively. A nearly stable monthly average of 27.4∞C was recorded over the same period. The coolest year was 1990, with an annual average temperature of 25.1∞C, while the hottest year was 1988, with an annual average of 29.5∞C. Results show that there is a notable increasing trend of the maximum temperature over Lamu annually (Fig. 2). The significance of the trend is 74% (R2=0.74). From the regression analysis time (in years) was a significant predictor of mean maximum temperature (p = 0.000). This was noted specifically during the months of March to August. At the same time, the model showed a non-significant decreasing trend for the minimum temperature over Lamu annually (Fig. 3). The significance of the trend is 8% (R2=0.08). Time (in years) was not a significant predictor of mean minimum temperature (p = 0.359).
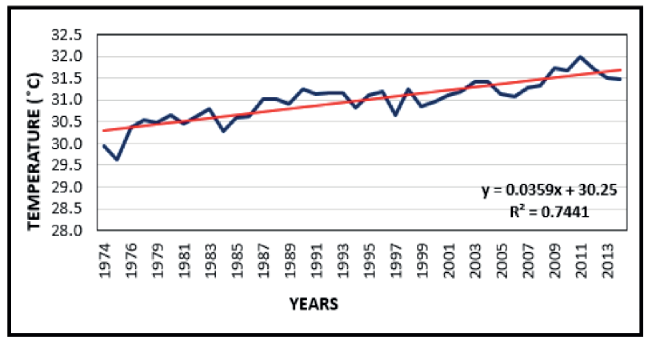
Fig. 2. Trend in Maximum Temperatures in Lamu (1974-2014)
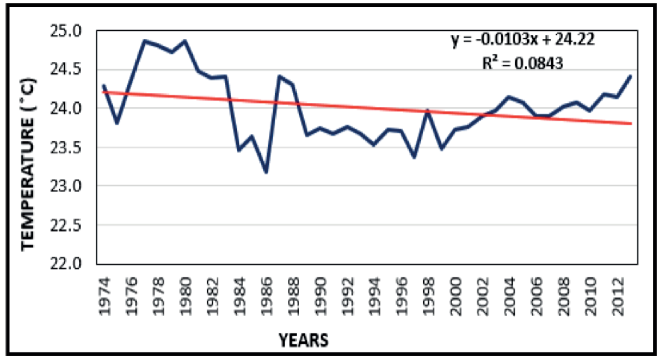
Fig. 3. Trend in Minimum Temperatures in Lamu (1974-2014)
Table 1. Summary of Questions in the Household Survey
What is your source of livelihood? Do you know what climate change is? What do you understand by the term climate change? Temperature change: Have you noticed any changes in the temperature over the past ten years (1996-2016)? If yes, how has the temperature changed (it has become cooler over the years or it has become warmer over the years) Rainfall change: Have you noticed any changes in rainfall over the past ten years (1996-2016)? If yes, how has it changed (rainfall received has increased over the years, rainfall received has reduced over the years) Are you able to predict the start and the end of the rainy season? When were you last able to predict the start and end of the rainy season? Do you receive the same amount of rainfall every year? How have these changes in rainfall affected water resources? |
Lamu County received an average of 1022 mm of rainfall annually. The lowest amount of rainfall was observed in 1980 while the highest was in 1997. It is worth noting that significant spikes in the amount of rainfall received are most likely associated with the El Nino and La Nina events that occurred between 1980 and 1999. The sharp spike in rainfall received in 1997 could be attributed to the El Nino phenomena. The years 1988 and 1989 were relatively dry compared to the annual average and this could be explained by the La Nina phenomenon that occurred during that time. In addition, the years 1980 and 1992 (538 mm and 561 mm, respectively) were extremely dry relative to the annual average of 1022 mm of rainfall. It was during this time that the most severe, continental droughts were reported, affecting 1.5 million people in the arid and semi-arid districts of Kenya including the coastal regions (Verschuren and Laird 2000).
A linear regression analysis was conducted to fit the data with the right model:
Y = β + β1 X1 + ξi,
Where:
Y = Average annual rainfall (mm)
X1 = Time in years
βj =The coefficient for the independent variable to the jth power ξi = random errors.
In Table 2, the regression equation is:
Y = 891.719 + 4.882 X1
Table 2. Regression Coefficients of Annual Rainfall Lamu
Model | Unstandardised Coefficients | Standardised Coefficients | t. | Sig. | |
|---|---|---|---|---|---|
| B | Std. Error | Beta |
|
|
(Constant) | 891,719 | 102,345 |
| 8.713 | 0.000 |
Year | 4.882 | 4.246 | 0.181 | 1.150 | 0.257 |
Results from the annual rainfall analysis show a fluctuating trend over Lamu, with rainfall increasing and decreasing over time (Fig. 4). The significance of the trend observed is 3% (R2=0.03). From the findings, p > 0.05 hence time (in years) was not a significant predictor of rainfall.
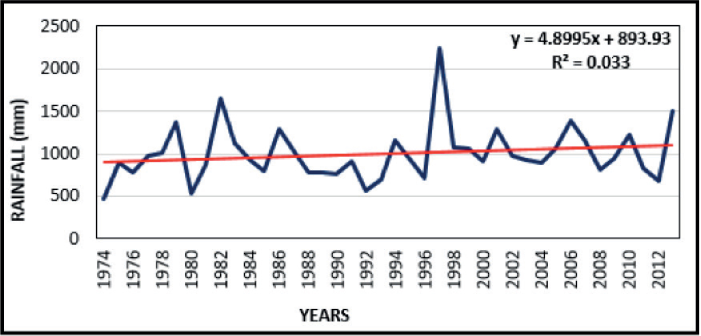
Fig. 4. Trend in Rainfall (1974-2014) in Lamu
An examination of the trend over the seasons, indicates a fluctuating trend during the long (Fig. 5) and short rains (Fig. 6). For the long rains, time was not a significant predictor of rainfall (p > 0.05). While, there is an increasing trend displayed for the short rains. The significance of the trend is 19% (R2=0.19). The result revealed that time (in years) was a significant predictor of the short rains (p < 0.05).
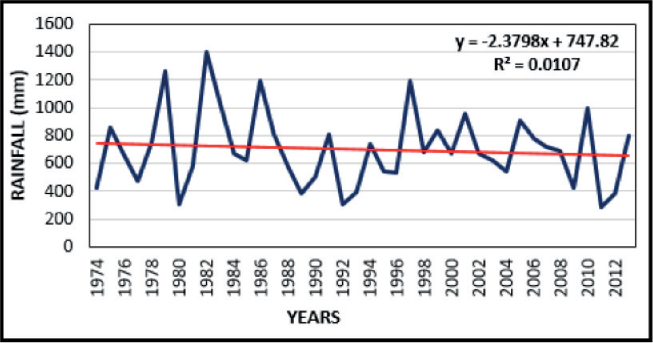
Fig. 5. Trend in Rainfall over the Long Rains (March to May) (1974-2014)
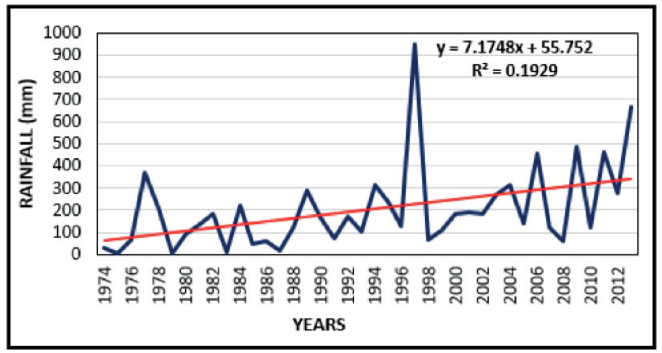
Fig. 6. Trend in Rainfall over the Short Rains (October to December) (1974-2014)
This study sought to determine whether there was a significant difference in the mean rainfall for the long and short rains over time. The results (Table 3) show the Levene's Test for Equality of Variance to be 0.037; hence the variances for the two groups are not the same. Therefore, information was selected from the second line of the t-test table - equal variances not assumed. The findings revealed that there was no significant difference in the mean rainfall for the short rains and long rains periods (p = 0.436) over time. Thus there is a non-discernible trend in rainfall over Lamu during the period 1974-2014. This is also the case for rainfall received during the long and short rain season.
Table 3. Independent Samples Test
| Levene's Test for Equality of Variances | t-test for Equality of Means | ||||||||
|---|---|---|---|---|---|---|---|---|---|---|
F | Sig. | t | df | Sig. (2-tailed) | Mean Diff. | Std. Error Diff. | 95% Confidence Interval of the Difference | |||
Lower | Upper | |||||||||
Rainfall | Equal variances assumed | 9.394 | 0.037 | 0.967 | 4 | 0.388 | 84,4100 | 87,3197 | -158,0283 | 326,8483 |
Equal variances not assumed |
|
| 0.967 | 2.001 | 0.436 | 84,4100 | 87,3197 | -291,1028 | 459,9228 | |
Majority of the respondents (96%) reported having observed changes in temperature over the last ten years (2006 to 2016). Out of those who observed changes, 60.2% reported that temperatures have risen, 17.3% observed that it has become cooler over the same time and 22.5% reported that even though temperatures have changed in Lamu County, they could not quantify the change. The respondents who observed that temperatures have risen include farmers, watchmen fishermen/women and pastoralists. The data was disaggregated by livelihood to see if certain livelihoods were more sensitive to changes in temperature than others. Of all the livelihoods sampled, a higher percentage of fishermen/women, farmers and pastoralists (over 70%) noted a rise in temperature as compared to the unemployed and general office workers.
Nearly all of the respondents (96%) reported having observed changes in the amount of annual rainfall in the last ten years (2006-2016). Out of the respondents who observed changes in rainfall, 89.4% were of the opinion that rainfall had reduced during this period while 5.9% opined that rainfall had increased over the same duration. Whereas, the remaining 4.7% who observed changes in rainfall could not say whether rainfall had increased or reduced. Similarly, the changes observed in rainfall were examined by livelihood to see if certain livelihoods were more perceptive to changes in rainfall than others. The study showed that on average, a large majority 95.2% of the respondents who noted changes in rainfall were from rainfall dependent sectors - this included miners, fishermen, pastoralists, farmers, ranchers and mangrove harvesters. In addition, more than half (54.5%) of the respondents noted that the amount of rainfall received over the years was insufficient to meet their required water needs. Further, they stated that the rains they received during the rainy season did not provide enough water to last them until the next season.
The results indicate that the local community in Lamu detect changes in climate variables (temperature and rainfall) over time. The results also indicate that their observations postively corelate to meteorological records. This was especially the case for observations on temperature. The maximum temperature in Lamu showed an inreasing trend, this is consistent with other studies done in Kenya. For example, Collins (2011) indicated that rapid warming from 1979 onwards was witnessed in Kenya. It is also consistent with other studies done in Africa. On a regional level, Issahaku et al. (2016) and Safari (2012) recorded similar results (i.e. significant warming) of temperature trends in Ghana and Rwanda respectively. Also King'uyu et al. (2000) found evidence of significant warming in the East Africa region. Furthermore, the results also show consistency with IPCC (Watson et al. 1997) projections for the African continent, whereby land areas in equatorial countries such as Kenya, may experience significant warming (of up to 1.4∞C) by 2050. This projection represents a rate of warming of about 0.2∞C per decade. While the minimum temperatures showed a non-significant decreasing trend for Lamu, it is important to note that this has been observed in other parts of Africa and attributed to the recurrence of extreme values. For example King'uyu et al. (2000) found that there were large geographical and temporal variations in observed trends, with some neighbouring locations at times indicating opposite trends. This was particularly the case for many coastal locations and those near large water bodies. They (2000) argued that the temperature variability observed is actually a result of the recurrence of extreme values, as it significantly correlated with patterns of convective activities (especially ENSO, cloudiness, and above/below normal rainfall). This could also explain the difference between maximum and minimum temperature trends in Lamu. As shown in figure 4, a sharp spike in rainfall was recorded in 1997, while the years 1988-1989 were relatively dry compared to the annual average. This could explain the decreasing trend in minimum temperature values. The overall increase in annual temperature observed in the study area is therefore attributed to an increase in the maximum temperature. The rate of warming determined in the study could have dire consequences for the people of Lamu. More than half of the population live below the poverty line (less than 1$ a day), making them exceptionally vulnerable to the negative impacts associated with climate change. The findings dictate immediate action towards adaptation, as the local community will need to cope with the negative implications of continuous warming.
Observations on the trends in rainfall in Lamu are less definite. Generally, rainfall trends in Kenya show varying results. From the 1970s up to 2008, Githui et al. (2009) noted increasing amounts of annual rainfall within the range of 2.4% to 23.2% in the Western part of Kenya. While another study (Rao et al. 2011) found no discernible increasing or decreasing trend either in annual or seasonal rainfall in the Eastern region of Kenya. An earlier report by the IPCC (Watson et al. 1997) projected that equatorial Africa could experience a small increase (of about 5%) in rainfall by the end of the 21st century. However, the same report (Watson et al. 1997) also recognised that rainfall results around the region are not consistent. Despite models predicting increased rainfall in East Africa with climate change, the region is frequently experiencing droughts. This has come to be referred to as the 'East African paradox'. It is argued (Lyon and Vigaud 2017) that the models may be accurate but extreme weather events such as El Nino could cloud the overall picture. Researchers (Lyon and Vigaud 2017; Giannini et al. 2008) have offered a number of explanations for the 'East African paradox' ranging from natural variability of climate that models struggle to capture, to patchy observational data due to poor infrastructure and meteorological records in the region. Alternatively it is also possible that the underlying wet trend has not yet emerged and is yet to be observed in future trend analysis (Giannini et al. 2008).
Understanding the trends is complex and variable phenomena such as rainfall are not straightforward (Rao et al. 2011). This points to the importance of stakeholder observations and perspectives on changes observed over time. For example, in a study by Rao et al. (2011) researchers looked at farmers' perceptions of short and long-term variability in climate and their ability to discern trends in climate. They compared the perceived trends with actual weather observations by the Kenya Meteorological Department (KMD). They found this method of analysis useful where the climate showed high intra- and interannual variability. Similarly, the present study sought to compare the results of the trend analysis with the stakeholders' observations. Majority of the respondents reported having observed changes in temperature over the last ten years (2006 to 2016). Majority (60.2%) of those who observed these changes indicated that temperatures had risen. These respondents predominantly engaged in 'climate-sensitive' livelihoods such farming, fishing and pastoralism. The respondents' perceptions of temperature largely agree with data from KMD, showing an increasing trend in temperature over time. The results give some understanding of the annual changes in temperature at a local level and confirm that global warming is taking place even at local scales. If the current trends in temperature continue in the future, increased warming in Lamu could have a range of negative implications for the region, including impacting water availability in the area. The findings suggest that the process of validating community perceptions of trends with historical meteorological data analysis can promote adaptation planning that is inclusive and responsive to local experiences. Including the community (through their observations and perceptions) in the analysis of these implications will promote a holistic, participatory approach to adaptation that is arguably more sustainable.
Similarly, stakeholder observations on rainfall were not as conclusive as those on temperature. While majority of the respondents deduced that rainfall was decreasing, the community observations did not necessarily agree or disagree with the trend analysis. This is because there was no discernible trend identified from the dataset (with the exception of the short rains season, whereby there was an increasing trend in rainfall). There are two possible explanations worth discussing. For one, it is possible that respondents were influenced to a greater degree by variability in rainfall rather than long-term trends. The frequency and intensity of rain are expected to change due to global warming and they are also indications that they change over shorter timescales (Trenberth 1999). Secondly, it is possible that the findings point to a problem of storage capacities rather than inadequate rainfall. The community could be receiving sufficient rainfall but due to poor and outdated storage facilities (which is common in Lamu), they are unable to hold the extra water. As a result, they perceived that rainfall is insufficient and declining. Both lines of reasoning are supported by the discussions on rainfall in East Africa by the IPCC (Watson et al. 1997). Regardless, there is an opportunity to include the community in designing and implementing better systems of water management that will help them adapt to the negative impacts of climate change.
The study findings also suggest that the value of indigenous knowledge in climate trend analysis should be further explored. Part of the respondents (11.6%) noted that in the past they were able to predict when the rains will come but now they are not able to. While 8.3% of the total sample observed that it is still easy for them to tell when the rains will come. Majority of the respondents (80.1%) indicated that they have never been able to predict the rainy seasons. This is probably due to the age of the respondents, as 45.3% of the total sample is below 30 years. Rain forecasting has traditionally been a skill exercised by very few members of the community, and is usually passed on from the elder members of the community to the next generation. In the study, only 21% of the total sample was above the age of 55. In many cases across Africa, rain forecasting and predicting is evident in communities through indigenous knowledge systems. This knowledge is passed down to just a few members of the community and sustained through the generations, usually by word of mouth and cultural rituals. Indigenous local knowledge has been the basis of agriculture, conservation, education and a wide range of other activities that sustain a society and its environment (Senanayake 2006). Moving forward, it would be valuable to see how to integrate the knowledge of the older generation into adaptation planning and management in Lamu.
The trend analysis for temperature and rainfall used in this study demonstrated the use of linear trend as a semieffective method for studying variations of temperature and rainfall data. While it identified strong trends in temperature that concurred with stakeholder observations, trends in rainfall were not as perceptible and as such, inconclusive. Natural rainfall variation is so great that it could take a human lifetime for significant climate change signals to appear in regional or global rainfall models. As such, studies in the East African region can benefit from integrating community perceptions of short and longterm variability in climate and assessing how the perceived trends converge with actual weather observations from meteorological records. More observational data would be necessary in strengthening the trend analysis, particularly for rainfall. Further investigations using global climate models (GCMs) would benefit from integrating local and traditional knowledge in order to enhance adaptation planning and decision-making at the local level.
1. Adger W.N. (1999). Social vulnerability to climate change and extremes in coastal Vietnam. World development, 27(2), 249-269.
2. Awuor C.B., Orindi V.A. & Ochieng Adwera A. (2008). Climate change and coastal cities: the case of Mombasa, Kenya. Environment and urbanization, 20(1), 231-242.
3. Ballinger R. (2015). On the edge: Coastal governance and risk. In Risk Governance. Springer, Dordrecht, 373-394.
4. Bryan E., Ringler C., Okoba B., Koo J., Herrero M. & Silvestri S. (2013). Can agriculture support climate change adaptation, greenhouse gas mitigation and rural livelihoods? Insights from Kenya. Climatic Change, 118(2), 151-165.
5. Bryan E., Ringler C., Okoba B., Roncoli C., Silvestri S. & Herrero M. (2013). Adapting agriculture to climate change in Kenya: Household strategies and determinants. Journal of environmental management, 114, 26-35.
6. Church J., & Palin O. (2003). The Sea Turtle Conservation Initiative in Kiunga Marine National Reserve, Lamu Kenya, from February 1997 to June 2003. Report, WWF-EARPO, Nairobi.
7. Collins J.M. (2011). Temperature variability over Africa. Journal of climate, 24(14), 3649-3666.
8. Cutter S.L., Emrich C.T., Webb J.J. & Morath D. (2009). Social vulnerability to climate variability hazards: A review of the literature. Final Report to Oxfam America, 5, 1-44.
9. Devkota R.P. (2014). Climate change: trends and people’s perception in Nepal. Journal of Environmental Protection, 2014.
10. Dolan A.H. & Walker I.J. (2006). Understanding vulnerability of coastal communities to climate change related risks. Journal of CoastalResearch, 1316-1323.
11. Dumenu W.K. & Obeng E.A. (2016). Climate change and rural communities in Ghana: Social vulnerability, impacts, adaptations and policy implications. Environmental Science & Policy, 55, 208-217.
12. Giannini A., Biasutti M., Held I. M. & Sobel A.H. (2008). A global perspective on African climate. Climatic Change, 90(4), 359-383.
13. Githui F., Gitau W., Mutua F. & Bauwens W. (2009). Climate change impact on SWAT simulated streamflow in western Kenya. International Journal of Climatology: A Journal of the Royal Meteorological Society, 29(12), 1823-1834.
14. Herron M., Roos P.B., Donley C. & Jones D. (2015). Geographic information systems and coastal planning in Australia. Geography, environment, sustainability, 8(1), 79-108.
15. Issahaku A.R., Campion B.B. & Edziyie R. (2016). Rainfall and temperature changes and variability in the Upper East Region of Ghana. Earth and Space Science, 3(8), 284-294.
16. Kabubo-Mariara J. (2008). Climate change adaptation and livestock activity choices in Kenya: An economic analysis. In Natural ResourcesForum, 32(1), 131-141. Oxford, UK: Blackwell Publishing Ltd.
17. King’uyu S.M., Ogallo L.A. & Anyamba E.K. (2000). Recent trends of minimum and maximum surface temperatures over Eastern Africa. Journal of Climate, 13(16), 2876-2886.
18. Kotir J.H. (2011). Climate change and variability in Sub-Saharan Africa: a review of current and future trends and impacts on agriculture and food security. Environment, Development and Sustainability, 13(3), 587-605.
19. Kundzewicz Z.W., Mata L.J., Arnell N.W., Döll P., Jimenez B., Miller K. ... & Shiklomanov I. (2008). The implications of projected climate change for freshwater resources and their management. Hydrological sciences journal, 53(1), 3-10.
20. Kundzewicz Z.W. & Doell P. (2009). Will groundwater ease freshwater stress under climate change? Hydrological Sciences Journal, 54(4), 665-675.
21. Kulima Integrated Development Solutions (2014). Climate Vulnerability and Capacity Analysis of the Lamu Land/Seascape. [online] Available at: http://kulima.com/wp-content/uploads/2011/03/Climate-Vulnerability-and-Capacity-Analysis-of-the-Lamu-Sea-Landscape.pdf [Accessed 27 January 2017].
22. Lyon B. & Vigaud N. (2017). Unraveling East Africa’s climate paradox. Climate Extremes: Patterns and Mechanisms. John Wiley & Sons, Inc, 265-81.
23. Martínez C.I.P., Piña W.H.A. & Moreno S.F. (2018). Prevention, mitigation and adaptation to climate change from perspectives of urban population in an emerging economy. Journal of cleaner production, 178, 314-324.
24. Mohammed S.A. & Fallah R.Q. (2019). Climate Change Indicators In Alsheikh-Badr Basin (Syria). GEOGRAPHY, ENVIRONMENT, SUSTAINABILITY, 12(2), 87-96.
25. Muzari W., Muvhunzi S., Soropa G., & Kupika O. L. (2014). Impacts of climate variability and change and farmers’ responsiveness in the agricultural sector in Zimbabwe. Jour. International Journal of Science and Research, 1726-1731.
26. Niang I., Ruppel O.C., Abdrabo M.A., Essel A., Lennard C., Padgham J. and Urquhart P. (2014). Africa. In: Climate Change 2014: Impacts, Adaptation, and Vulnerability. Part B: Regional Aspects. Contribution of Working Group II to the Fifth Assessment Report of the Intergovernmental Panel on Climate Change [Barros, V.R., C.B. Field, D.J. Dokken, M.D. Mastrandrea, K.J. Mach, T.E. Bilir, M. Chatterjee, K.L. Ebi, Y.O. Estrada, R.C. Genova, B. Girma, E.S. Kissel, A.N. Levy, S. MacCracken, P.R. Mastrandrea, and L.L. White (eds.)]. Cambridge University Press, Cambridge, United Kingdom and New York, NY, USA, 1199-1265.
27. Olanrewaju R., Ekiotuasinghan B. & Akpan G. (2017). Analysis of rainfall pattern and flood incidences in Warri Metropolis, Nigeria. Geography, Environment, Sustainability, 10(4), 83-97.
28. Ozor N., Urama K. & Mwangi W. (2012). Climate change vulnerability and the Use of Indigenous technologies for adaptation among smallholder farming communities in sub saharan Africa. Journal of Agricultural Extension, 16(2), 161-182.
29. Raheem U. & Olorunfemi F. (2013). Urban Vulnerability and Adaptation to Extreme Weather Events: A Case Study of Rainstorm Victims in Ilorin, Nigeria. Geography, Environment, Sustainability, 6(2), 80-93.
30. Rao K.P.C., Ndegwa W.G., Kizito K. & Oyoo A. (2011). Climate variability and change: Farmer perceptions and understanding of intra- seasonal variability in rainfall and associated risk in semi-arid Kenya. Experimental Agriculture, 47(2), 267-291.
31. Safari B. (2012). Trend analysis of the mean annual temperature in Rwanda during the last fifty two years. Journal of Environmental Protection, 3(6), 538.
32. Senanayake S.G.J.N. (2006). Indigenous knowledge as a key to sustainable development. Journal of Agricultural Sciences–Sri Lanka, 2(1).
33. Trenberth K.E. (1999). Atmospheric moisture recycling: Role of advection and local evaporation. Journal of Climate, 12(5), 1368-1381.
34. Vincent K. (2004). Creating an index of social vulnerability to climate change for Africa. Tyndall Center for Climate Change Research.Working Paper, 56(41), 1-50.
35. Watson R.T., Zinyowera M.C., Moss R.H. & Dokken D.J. (2001). IPCC special report on the regional impacts of climate change: An assessment of vulnerability. IPCC Secretariat.
Institute for Climate Change and Adaptation
P O Box 30197-00100, Nairobi
Institute for Climate Change and Adaptation
P O Box 30197-00100, Nairobi
Institute for Climate Change and Adaptation
P O Box 30197-00100, Nairobi
Institute for Climate Change and Adaptation
P O Box 30197-00100, Nairobi
Yvonne M., Ouma G., Olago D., Opondo M. Trends In Climate Variables (Temperature And Rainfall) And Local Perceptions Of Climate Change In Lamu, Kenya. GEOGRAPHY, ENVIRONMENT, SUSTAINABILITY. 2020;13(3):102-109. https://doi.org/10.24057/2071-9388-2020-24

Editor-in-Chief
Kasimov Nikolay S.Lomonosov Moscow State University
Moscow 119991 Russia, Leninskie Gory, Faculty of Geography, 1806a
Phone +7 495 939-15-52
E-mail: ges-journal@geogr.msu.ru


