


Contents
Scroll to:
https://doi.org/10.24057/2071-9388-2019-148
Scroll to:
In Mediterranean climate areas, wildfires are one of the most critical problems bringing about several negative impacts (loss of human life, infrastructure damages, landscape transformation, natural environment deterioration, etc.). Fires pose great dangers not only for rural areas, but also for suburban or even urban areas. The aim of the research is to detect areas vulnerable to wildfire in Attica Region and then to examine the critical factors affecting the risk degree in macro and microscale. In the first step we examine the wider study area, which is close to vulnerable areas in a zone at least 1km wide. This examination includes the factor of vegetation along with other factors such as road network, aspect, slope etc, aiming to detect the exact area vulnerable to fire. The second step focuses on a vulnerable study area individually, for identifying and measuring the factors that affect the risk degree in microscale. The most notable factors are: a) population density, b) connectivity of the road network, c) geometric features of the streets, c) location of fire stations and police departments, d) existence of open spaces, e) parking conditions and f ) existence of vulnerable facilities. The wider study area (macroscale) is the Regional Unit of Eastern Attica and the main study area (microscale) is the settlement of Saronida. The findings indicate that several rural and peri-urban areas inEastern Atticaare vulnerable to wildfire. Particularly, crucial issues regarding microscale are the low roadway width values and the inadequate connectivity of the network structure.
Kourmpa E., Tsigdinos S. Detection Of Fire-Prone Areas In Attica Region Integrating Urban And Transport Aspect. GEOGRAPHY, ENVIRONMENT, SUSTAINABILITY. 2020;13(3):84-89. https://doi.org/10.24057/2071-9388-2019-148
Contemporary cities are being threatened by various natural hazards; the most usual ones are floods, earthquakes, hurricanes and wildfires (Montz et al. 2017). Focusing on fires, it should be noted that this particular type of hazard constitutes a major environmental issue (Gerdzheva 2014), bringing about several serious impact on the environment (Darques 2015) such as loss of human life, infrastructure damages, landscape transformation, natural environment deterioration, etc. (Hernandez-Leal et al. 2006; Lampin-Maillet et al. 2009; Diakakis et al. 2016). In addition, wildfires are a considerable source of greenhouse gas emissions (Williams et al. 2007). According to Carroll et al. (2007), wildfires are the result of a 'complex mix of physical, ecological, economic and social developments. Apart from natural reasons, the vast majority of wildfires is started by human activities either on purpose either by mistake (Martinez et al. 2009; Stefanovic et al. 2015).
The possibility of a wildfire to occur as well as the severity of its impacts increases at regions where residential structures and fire-prone wildlands intermix (Fried et al. 1999; Radeloff et al. 2005). These areas are called wildland-urban interface (WUI) and constitute a direct outcome of urban sprawl which appeared mainly due to car use rising after the 20th century (Brueckner 2000). The main characteristic of WUIs is their high level of vulnerability to wildfires (Badia et al. 2011), meaning that the system is susceptible to be harmed and exposed to great danger (Neil Adger 2006). Therefore, it is urgent for cities to seek for efficient strategies and solutions in order to decrease vulnerability and simultaneously enhance their level of resilience (Ramirez et al. 2011; Newman et al. 2017). Resilience is defined as 'the amount of change a system can undergo before it crosses a threshold and flips to an alternate stability regime of that system' (McDonald and Walker 2007) and is usually used in association with several threatening events (Reggiani et al. 2015).
Important components of resilience are mitigation and adaptation (Badia et al. 2011), which are critical parts of a planning procedure, aiming at an adequate protection of urban areas from natural hazards. In these actions, it is rather essential to integrate tools that monitor and evaluate the urban environment in a usual basis. Moreover, Radke (1995) states that monitoring urban change in hazardous areas is a critical input into the emergency management process. Hence, it is necessary to investigate and analyze elements of cities that affect vulnerability or resilience level, thus detecting the risk for a fire incident to occur (Gerdzheva 2014; Viegas et al. 2009). Among many elements, two of the most important are urban and transport features such as road network structure (Karmas et al. 2014), open spaces existence, natural or artificial barriers, land uses etc. The proper and adequate detection of these specific features can undoubtedly contribute to the creation of an integrated planning strategy which will strengthen resilience and sustainability.
Focusing on Mediterranean and especially in Greece, where a considerable number of wildfires takes place annually, it should be noted that wildfires have caused major problems over time regarding its residents and its environment (either urban or natural) (Viegas et al. 2009). The example of the catastrophic wildfire occurred in the settlement Mati of Eastern Attica in 2018 and especially the role of the urban and road network structure (numerous dead ends, and inaccessible seafront) in the spread of fire, indicates the seriousness of the situation. It is therefore an urgent need to build an efficient protection strategy. However, the most fundamental part preceded by the strategy, is the analysis phase which identifies high-risk zones.
In this context, the present research aims primarily at detecting vulnerable areas to wildfire in Attica Region in Greece and secondly at examining the critical factors affecting the risk degree of the aforementioned areas. Specifically, the research investigates the vulnerability to wildfire in macro and microscale level highlighting at the same time potential deficiencies regarding public safety, in case of a wildfire incident. The research focuses on the coastal zone between Vari and Sounio in the eastern part of Attica Region, as it constitutes an area with inadequate urban characteristics generated by urban sprawl and arbitrary building, showing increased possibilities for a wildfire incident to occur.
The structure of the paper is the following; the next section includes the presentation of the methodological framework of the research, the third section describes the study area briefly and illustrates the results of the methodology application and the final section summarizes the findings, highlights the importance of the research and suggests further research opportunities.
The methodological framework of this paper is concerns two spatial levels, the macroscale and microscale. It is considered as a hierarchical approach in which the results of one step, constitute the inputs of the next. These steps are described in the following Fig. 1.
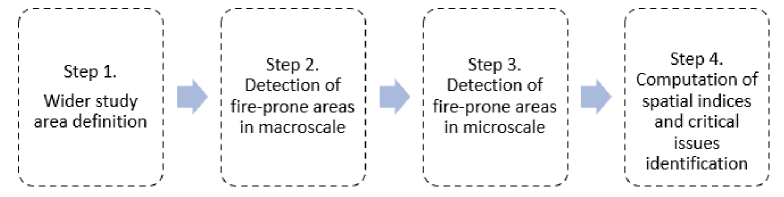
Fig. 1. General scheme of the detection of fire-prone areas
Each step of the methodological framework is described in detail below:
Step 1. Wider study area definition
This step identifies the wider study area which consists of several built clusters with the following characteristics:
Step 2. Detection of fire-prone areas in macroscale
The detection of fire-prone areas in macroscale is achieved through the following procedure:
Firstly, we detect the dense vegetation of the area since it is considered one of the most basic vulnerability factors. For this reason, the Normalized Difference Vegetation Index (NDVI) is calculated from a Landsat-5 image. The period of the image should be between April and May, where the vegetation has blossomed and therefore it is possible to identify the most vulnerable areas. Also, this satellite image is corrected for atmospheric effects (in a GIS environment). The values of NDVI ranges from -0.1 to -0.5 for water surface to 0.7 to 0.85 for continuous healthy vegetation (Karmas et al. 2014). Especially, values close to zero represent barren areas of rock, sand and snow, low, positive values scrub and grassland and high values indicate temperate and tropical rainforests (Gerdzheva 2014). According to Caceres (2011), rangeland (scrub/shrubs) has the highest fire risk, even though the value of NDVI index is low (approximately 0.2 to 0.4). The formula for calculating the index is NDVI = (NIR - ReD)/ (Nir + RED) where NIR is the near infrared band and RED the red band (Crippen 1990).
Next, we create a vulnerability map that is based on the implementation of a combined indicator. This indicator contains the following factors: i) Normalized Difference Moisture Index (NDMI), ii) the slope that affects the fire spread, iii) the aspect, iv) the elevation, and v) the distance of roads and settlements (Gerdzheva 2014). A short description of these variables is given below:
Table 1. Weights assigned to variables and categories for calculating fire risk
Variables | Categories | Ratings of hazard | Fire sensitivity |
|---|---|---|---|
NDMI | >0.36, 0.26 - 0.36, 0.16 - 0.26, 0.16-0 <0 | 1,2,3,4,5 | Very Low, Low, Moderate, High, Very High |
Elevation | >2000 m, 1000 - 2000 m, 500 - 1000 m, 200 - 500 m, <200 m | 1,2,3,4,5 | Very Low, Low, Moderate, High, Very High |
Slope | < 5 %, 10 - 5 %, 25 - 10 %, 35- 25 %, >35 % | 1,2,3,4,5 | Very Low, Low, Moderate, High, Very High |
Aspect | North (>315o and <45o), East (>45o and <135o), South (>135o and <225o), West (>225o and <315o) | 2,3,4,5 | Low, Moderate, High, Very High |
Distance from roads | >400 m, 300 - 400 m, 200 - 300 m, 100 - 200 m, <100 m | 1,2,3,4,5 | Very Low, Low, Moderate, High, Very High |
Distance from settlements | >2000 m, 1500 - 2000 m, 1000-1500 m,500 - 1500 m, <500 m | 1,2,3,4,5 | Very Low, Low, Moderate, High, Very High |
Source: Adab et al. (2011)
Taking all these parameters into account, Adab et al. (2011), proposed a fire risk model where input values are determined from the column «Ratings of hazard», therefore 1 to 5. The equation of this model is (100*NDMI + 50*slope + 25*aspect + 10*(roads + settlements) + 5*elevation)/10. The output values are between 20 and 100 (very low risk and very high risk respectively).
Finally, we combine the results of the NDVI index (Fig. 2a) and the vulnerability map (Fig. 2b), aiming to identify possible vulnerable areas.
Step 3. Detection of fire-prone areas in microscale The present step includes the procedure that examines the existing conditions in a fire-prone area regarding microscale features. With regard to this aim, the data collection includes the characteristics, affecting the vulnerability of the area and playing significant role in the detection process. These data are:
Step 4. Computation of spatial indices and critical issues identification
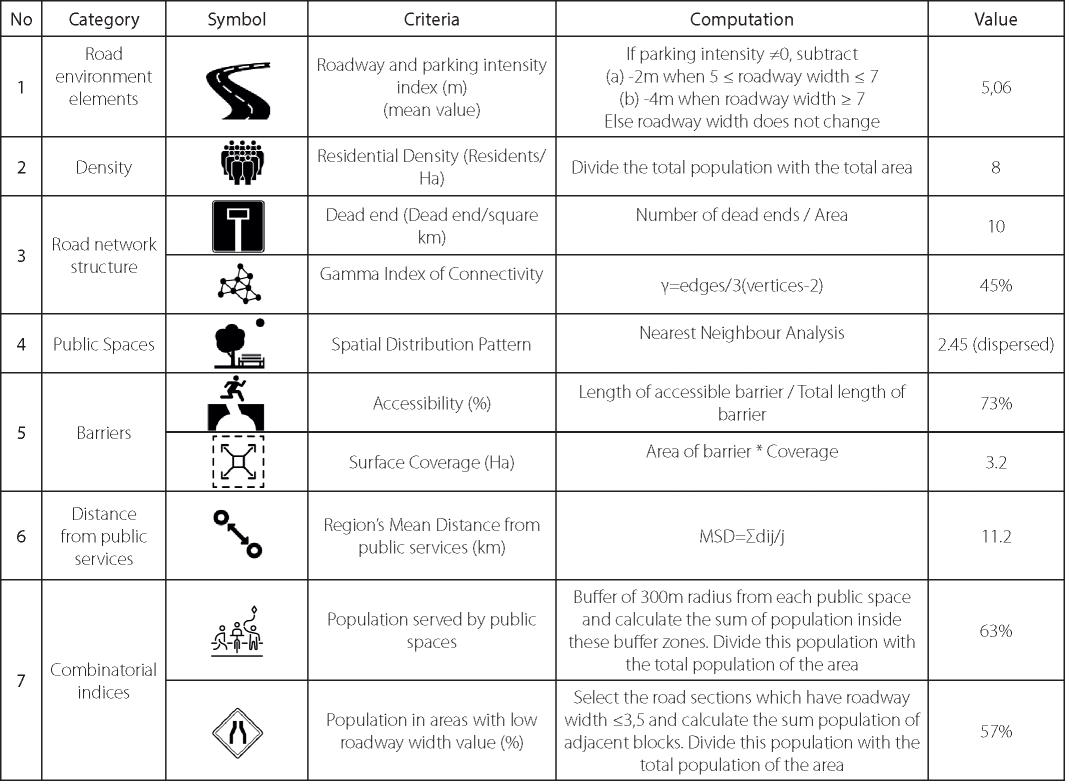
The final step analyzes the characteristics that are collected and to compute suitable spatial indicators that will lead to the identification of crucial issues. The (table 2) below illustrates the categories of these criteria, a brief description, the computation technique used and the values.
Table 2. Spatial indices calculated for the settlement of Saronida
As we have mentioned above, the region of Attica is one of the most vulnerable areas to fires because of the natural landscape and the great number of residents that live in the periurban areas of Attica Region. In this context, we decided to examine the area from Vari to Sounio belonging to the Regional Unit of Eastern Attica, and more specifically an area within a radius of 1 km from the coastline. The main reasons behind this decision were i) the proximity to areas vulnerable to fire such as the National Park of Sounio and numerous scrubs or grassland areas, ii) the existence of several scattered and periurban settlements and iii) the absence of a contemporary and functional formal urban planning that will protect the area efficiently from various dangers (fires, arbitrary building and other non-compatible activities).
Next, we compute the NDVI for the wider study area. The indicator was calculated for a Landsat -5 image obtained at 09 April 2011 (https://earthexplorer.usgs.gov/). Moreover, the satellite image has been corrected for atmospheric effects via model DOS in QGIS. The calculated NDVI index ranges from -0.35 to 0.68 as the wide area consists of seafront, low mounts with relatively dense vegetation and scattered settlements. The existence of low positive values indicates that the vegetation consists of rangeland and as a consequence the wider area is considered as a very high fire risk degree zone (Fig. 2a).

Fig. 2. a) NDVI in wider study area (left) and b) Assessment of the wildfire susceptibility at a macroscale area (right) (on the example of Eastern Attica) (Kourmpa et al. 2019, https://greekvoyager.com/en/home/, own elaboration)
Regarding the algorithm for the detection of vulnerable areas, it is important to mention that, in this study, the factor of settlements is already fixed (1km from the coastline). For this reason, it is not taken into account in the model of vulnerability. The risk of fire is classified into six categories namely; Very Low, Low, Moderate, High, Very High and Extreme. The same result was achieved by the computation of the algorithm according to which the coastline front of the study area is assessed as a high-risked area in case of wildfire. Especially, there are settlements that have very high-risk degree of fire as it is seen into the relevant black boxes (Fig. 2b).
Through the observations of the above maps, it can be seen that a particular vulnerable area is the settlement of Saronida. It is located in Southeast Attica and was developed as a holiday resort. However, in recent years, this area has evolved into a permanent residential place and as a result the population of residents has increased rapidly. In addition, it has a tourist character during the summer months, as it is surrounded by the Saronic Gulf in the west. It is bordered with the Mount Olympus in the north, the settlement of Anavyssos in the south and northwest with Lagonissi, which is an important tourist attraction (Saronida is illustrated in detail in Fig. 3).
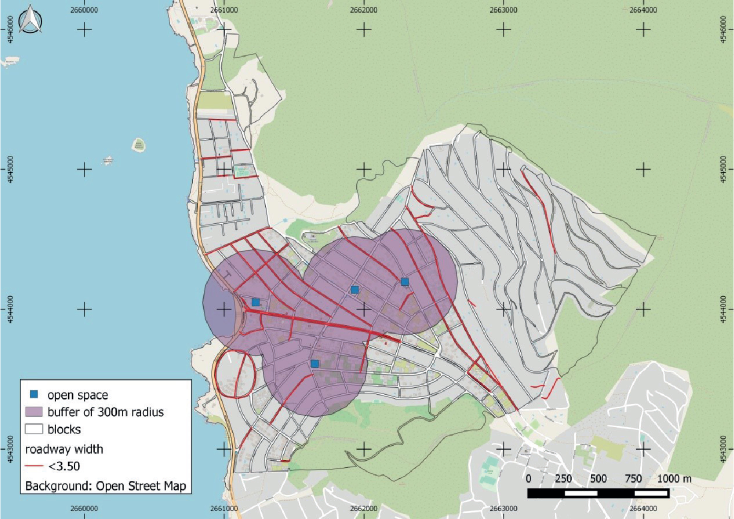
Fig. 3. Public spaces and roadway width in Saronida
Continuing to the third step, the spatial indices were calculated via Geographical Information Systems (GIS). The research used both primary and secondary data. Specifically, the primary data were collected via on site observation and refer to road characteristics, barriers and public spaces. In that context, roadway width, parking intensity, length of barriers and location of public spaces was measured and recorded. Regarding secondary data, we retrieved some of them from the QpenStreetmap platform, which is an open dataset with a great variety of spatial data. Dead ends, connectivity of road network and distance from public services belong to this category of data. Finally, the location of the municipality's settlements and population density were derived from Hellenic Statistical Authority.
According to Table 2, the area of Saronida faces significant issues regarding the structure and geometry of the road network. More specifically, the average roadway width, taken into consideration the parking intensity, is 5.06m, which is particularly low in proportion to the width of a common fire truck. Combined with the gamma connectivity index, which is below 50%, and the large number of dead ends of the study area, the difficulty of escaping and the probability of trapping in the road sections is quite high. Another important index is the combined index, depicting that the majority of the total population has access to roads with roadway width fewer than 3.5m. Qn the other hand, despite population growth, the population density is low (mainly due to the peri-urban identity of the area). Regarding the obstacles, the coastline is accessible, taken into consideration the relief of the surface, while the public spaces, according to Nearest Neighbour Analysis, follow a uniform distribution (2.45>2), meaning that they serve a considerable part of the area. Precisely, public spaces cover more than half of the population (63%). At the same time, supplementary indices were calculated where the coverage rate of the pools equals to 68% of the total area and 16% of the road network consists of dirt roads. Finally, the position of public spaces and the segments with roadway width greater than 3.50 are presented in Fig. 3, providing a more comprehensive understanding to the reader. It can be seen that the most inappropriate segments in case of a fire incident are encountered in the central and western part of the settlement.
This study addresses a vital problem for the wider Mediterranean area and especially for the country of Greece, which every year faces increased danger. Particularly, if we consider climate change and the global increase of temperature, we should note that these conditions may cause severe changes concerning the spread of wildfires. Moreover, this particular methodology consists of two separate stages with a hierarchical relationship with each other. The first stage shows a general overview of the wider study area through using Remote Sensing and Geographical Information Systems (GIS), while the second stage focuses on the needs of the microscale.
The findings of this research may actively contribute to the protection of small settlements which suffer from wildfires and also, they could develop a considerable background for the urban and rural planning procedure in order to take proper prevention measures. Specifically, according to the findings, a crucial issue in the area of Saronida is the fact that the population served by roads with low roadway width value is 57% and the most of them belong to the buffer zone of public spaces. On the other side, the percentage of coastline's accessibility is very high. A major advantage of this particular methodology is the fact that could be applied to other areas as well, giving a total overview of the surroundings as much as of the settlement and revealing the need for interventions in line with the current situation.
The basic objective of this paper is the development of a particular methodology via the calculation of spatial indices that could be used globally. However, further research is definitely necessary. More specifically, new studies may invest in the enrichment of these spatial indicators, concerning the factors which cause the occurrence and the spread of wildfires. Moreover, these factors could be further combined, thus creating new indicators that could be used to extract valuable results concerning the structure and the function of the entire area. The fundamental stage in order to improve the results of the methodology proposed, is the macroscale analysis where Remote Sensing techniques capable of detecting vulnerable areas, can be applied. Finally, with a similar way, an extension of this particular methodology can be examined, aiming to influence the existing planning procedure regarding the protection of periurban areas from wildfires.
1. Adab H., Kanniah K. and Solaimani K. (2011). GIS-based Probability Assessment of Fire Risk in Grassland and Forested Landscapes of Golestan Province. IPCBEE, 19.
2. Badia A., Serra P. and Modugno S. (2011). Identifying dynamics of fire ignition probabilities in two representative Mediterranean wildland- urban interface areas. Applied Geography, 31(3), 930-940.
3. Brueckner J. (2000). Urban Sprawl: Diagnosis and Remedies. International Regional Science Review, 23(2), 160-171.
4. Caceres C.F. (2011). Using GIS in Hotspots Analysis and for Forest Fire Fisk Zones Mapping in the Yeguare Region, Southeastern Honduras, Papers in Resource Analysis. Saint Mary’s University of Minnesota University Central Services Press. Winona, MN, 13, 14.
5. Carroll M., Blatner K., Cohn P. and Morgan T. (2007). Managing fire danger in the forests of the US inland northwest: a classic «wicked problem» in Public Land Policy. Journal of Forestry, 105, 239-244.
6. Crippen R.E. (1990). Calculating the vegetation index faster. Remote sensing of Environment, 34(1), 71-73.
7. Darques R. (2015). Mediterranean cities under fire. A critical approach to the wildland-urban interface. Applied Geography, 59, 20-21.
8. Diakakis M., Xanthopoulos G. and Gregos L. (2016). Analysis of forest fire fatalities in Greece: 1977–2013. International Journal of Wildland Fire, 25, 797-809.
9. Dong X., Li Y., Pan Y., Huang Y. and Cheng X. (2018). Study on Urban Fire Station Planning based on Fire Risk Assessment and GIS Technology, 8th International Conference on Fire Science and Fire Protection Engineering (on the Development of Performance-based Fire Code), 211, 124-130.
10. Fried J.S., Winter G.J. and Gilless J.K. (1999). Assessing the benefits of reducing fire risk in the wildland-urban interface: A contingent valuation approach. International Journal of Wildland Fire, 9, 9-20.
11. Gerdzheva A. (2014). A comparative analysis of different wildfire risk assessment models (A case study for Smolyan district, Bulgaria). European Journal of Geography, 5(3), 22-36.
12. Hernandez-Leal P.A., Arbelo M. and Gonzalez-Calvo A. (2006). Fire Risk assessment using satellite data, Advances in Space research, 37(4), 741-746.
13. Jaiswal R.K, Mukherjee S., Raju K.D, Saxena R. (2002). Forest Fire Risk Zone Mapping through Satellite Imagery & Geographical Information System. International Journal of Applied Earth Observation and Geoinformation, Elsevier Publications, 4(1), 10.
14. Karmas A., Karantzalos K. and Athanasiou S. (2014). Online analysis of remote sensing data for agricultural applications. Proceedings of OSGeo’s European Conference on Free and Open Source Software for Geospatial, Bermen, Germany.
15. Kourmpa E., Markou I., Mouratidou E., Tsafourou N. and Filippa E. (2019). Vulnerable settlements to fire: Forecasting and Protection, Interdisciplinary Program of Postgraduate Studies «Environment and Development», National Technical University of Athens (In Greek).
16. Lampin-Maillet C., Jappiot M., Long, M., Morge D. and Ferrier J.P. (2009). Characterization and Mapping of Dwelling Types for Forest Fire Prevention. Computers, Environment and Urban Systems, 33, 224-232.
17. Martinez J., Vega-García C. and Chuvieco E. (2009). Human-caused wildfire risk rating for prevention planning in Spain. Journal of Environmental Management, 90, 1241-1252.
18. McDonald T., Walker B. (2007). Resilience Thinking: Interview with Brian Walker. Ecological Management and Restoration, 8 (2), 85–91.
19. Montz B., Tobin G. and Hagelman R. (2017). Natural Hazards. Explanation and Integration. 2nd ed. The Guilford Press, New York.
20. Neil Adger W. (2006). Vulnerability. Global Environmental Change, 16 (3), 268-281.
21. Newman P., Beatley T. and Boyer H. (2017). Resilient Cities. Island Press, Washington.
22. Noon, E.K. (2003). A Coupled Model Approach for Assessing Fire Hazard at Point Reyes National Seashore: Flam Map and GIS, Proceedings of the 2nd International Wildland Fire Ecology and Fire Management Congress, Springs Resort.
23. Radeloff V.C., Hammer R., Stewart S.I., Fried J.S., Holcomb S.S. and Mckeefry J.F. (2005). The wildland urban interface in the United States. Ecological Applications, 15(3), 799-805.
24. Radke J. (1995). Modeling urban/wildland interface fire hazards within a geographic information system, Geographic Information Sciences, 1(1), 9-21.
25. Ramirez J., Monedero S. and Buckley D. (2011). New approaches in fire simulations analysis with Wildfire Analyst. The 5th International Wildland Fire Conference. Sun City, South Africa.
26. Reggiani A., Nijkamp P. and Lanzi D. (2015). Transport resilience and vulnerability: The role of connectivity. Transportation Research Part A: Policy and Practice, 81, 4-15.
27. Rothermel R.C. (1983). How to predict the spread and intensity of forest and range fires. Gen. Tech. Rep. INT-143. Ogden, UT: U.S. Department of Agriculture, Forest Service, Intermountain Forest and Range Experiment Station, 161
28. Siachalou S., Doxani, G. and Tsakiri-Strati M. (2009). Integrating Remote Sensing Processing and GIS to Fire Risk Zone Mapping: A case study for the Seih-Sou Forest of Thessaloniki. Proceedings of the 24th International Cartographic Conference (ICC)
29. Stefanovic B., Stojnic D. and Danilovic M. (2015). Multi-criteria forest road network planning in fire-prone environment: a case study in Serbia. Journal of Environmental Planning and Management, 59(5), 911-926.
30. Viegas D.X., Ribeiro L.M., Viegas M.T., Pita P. and Rossa C. (2009). Impacts of fire on society: extreme fire propagation issues. In E. Chuvieco (Ed.), Earth observation of wildland fires in Mediterranean ecosystems, 97-109.
31. Williams C., Hanan N., Neff J., Scholes R., Berry J., Denning A. and Baker D. (2007). Africa and the global carbon cycle. Carbon Balance and Management BioMed Central, 2, 1-13.
Kourmpa E., Tsigdinos S. Detection Of Fire-Prone Areas In Attica Region Integrating Urban And Transport Aspect. GEOGRAPHY, ENVIRONMENT, SUSTAINABILITY. 2020;13(3):84-89. https://doi.org/10.24057/2071-9388-2019-148

Editor-in-Chief
Kasimov Nikolay S.Lomonosov Moscow State University
Moscow 119991 Russia, Leninskie Gory, Faculty of Geography, 1806a
Phone +7 495 939-15-52
E-mail: ges-journal@geogr.msu.ru


