


Contents
Scroll to:
https://doi.org/10.24057/2071-9388-2019-116
Scroll to:
Samonova O.A., Aseyeva E.N. Particle size partitioning of metals in humus horizons of two small erosional landforms in the middle Protva basin – a comparative study. GEOGRAPHY, ENVIRONMENT, SUSTAINABILITY. 2020;13(1):260-271. https://doi.org/10.24057/2071-9388-2019-116
Geochemical analysis of small erosional landforms has been in the focus of the recent studies because gullies play a vital role in the sediment transfer within river basins and sediment-associated redistribution of potentially hazardous elements such as heavy metals (Golosov 2006). During the transport of solid material, various physical, physico-chemical, chemical and biochemical processes occur and cause changes in distribution of elements within the mineral assemblages and among particle size fractions. The topsoil represents the most active layer, where such changes are more evident in comparison with deeper soil horizons (Samonova and Aseeva 2006). Most studies dealing with geochemical analysis of soil-geochemical systems have concentrated on total levels or mobile phases of trace elements (Semenkov and Koroleva 2019) with very little emphasis on their partitioning among soil particle size fractions. However, this type of analysis contributes to better understanding of size distribution functions of potentially hazardous substances and serves as the basis for accurate risk assessment, soil remediation and estimation of metal fluxes in basin-type landscape-geochemical systems.
The studies that have been conducted to determine heavy metals in different particle size fractions mainly focus on urban or roadside soil, road/urban dust and sediment (Sutherland 2003; Ljung et al. 2006; Ajmone-Marsan et al. 2008; Acosta et al. 2009; Vlasov et al. 2015; Khademi et al. 2019; Zhang et al. 2019), while very little data are available on the distribution of heavy metals in various particle size fractions from agricultural (Qian et al. 1996; Gong et al. 2014) and natural (Acosta et al. 2011; Hardy and Cornu 2006; Samonova and Aseeva 2008; Samonova and Aseyeva 2013) soil.
The majority of the studies have shown that fine soil particles tend to concentrate and retain higher amounts of metals and have a stronger ability to carry potentially hazardous substances due to their high specific area, more organic matter and Fe/Mn/Al oxides content (Forstner 1982; Hardy and Cornu 2006; Gong et al. 2014; Liu et al. 2018). In coarser particle size fractions, with a lower sorption capacity, the concentrations of metals fully depend on the mineralogical composition, in particular the proportion of heavy minerals and neoformations (Protasova 2003). Consequently, the association of metals with various particle sizes is determined by parent material, weathering and soil formation pathway (Pobedintseva 1975; Dobrovolskii 1983; Protasova 2003; Hardy and Cornu 2006; Acosta et al. 2011; Ka- bata-Pendias 2011). The effect of different parent materials and their mineralogical assemblages was studied in the detail by Acosta et al. (2011) for the soils located in the Betic Cordilleras (SE Spain). The results showed that the distribution of metals in particle size fractions separated from humus horizons and derived from igneous, metamorphic and sedimentary rocks significantly depended on parent rock. No distinct trends of accumulation in specific fractions were observed for Fe and Ti, while for trace elements two trends were revealed. Some elements, such as Pb, Zn and Cu, accumulated preferentially in the clay fraction regardless of parent rock, however some metals, such as Ni, Co, and Cr, were enriched either in the clay or sand fractions depending on rock types. The study performed in France by Hardy and Cornu (2006) for natural and agricultural soils on silty parent material (classified as Podzoluvisols) revealed the preferential association of trace metals with the clay fraction. Qian et al. (1996) found that in moderately and slightly polluted agricultural tropical soils in China the majority of the metals accumulated in the clay fraction and also in the coarse and medium sand. For the urban soil the major carriers of heavy metals are fine fractions, including the silt and clay, with particle sizes < 0.05mm (Ljung et al. 2006) and < 0.01mm (Ajmone-Marsan et al. 2008). These fractions, having high metal levels, might affect human health and environmental quality since they are easily transported by suspension, can remain in air for a long period and enter organisms, including humans, by ingestion and inhalation (Ljung et al. 2006; De Miguel et al. 1997). The coarser fractions in urban soils are relatively depleted in metals, however in some European cities they reveal high contents of certain metals, in particular geogenic Cr and Ni, due to their additions from specific parent lithologies (Ajmone-Marsan et al. 2008). Urban dust and aerosol are characterized by higher total concentrations of trace metals (Pb, Zn, Cu, Cd, and Cr) than urban soil (Banerjee 2003; Khademi et al. 2019) because they mostly consist of fine particles. The study of roadside dust in Moscow (Vlasov et al. 2015) showed that heavy metals accumulate in the medium and fine silt and also in the clay fraction. The study of metals' partitioning in aerosol fractions performed in an industrial city in southern Poland (Zwozdziak et al. 2017) also revealed that concentrations of metals vary with aerosol particle size: the maximum supply of Fe was related to coarse aerosol fractions (3μιη-5μιη), while the addition of Zn and Pb was associated with finer material (0.30μιη-0.67μιτι). The supply of Mn, Cr, and Cu originating from both natural and man-made sources did not show any particular association with particle sizes.
Taking into account the importance of background data on particle size effect on metals' concentrations, in this paper we present the results of a soil-geochemical study of two small erosional landforms located 100 km to southwest from Moscow. The objectives of the study were (i) to investigate and compare the concentrations and distribution of Fe, Mn, Ti, Zr, Ni, Co, Cr, Zn, Pb in various particle size fractions (1-0.25tt, 0.25-0.05tt, 0.05-0.01 mm, 0.01-0.001 tt and <0.001 mm) separated from the landforms' humus horizons, and (ii) to assess the contribution of particle size classes to total metal concentrations, considering the relative abundances of individual particle size fractions. It was hypothesized that comparing the soils of the two erosional landforms will reveal the effect of lithologies on the studied parameters because the landforms belong to different lithological types. In addition to this, the study will provide background geochemical data on natural sources of dust and aerosol to make a sound basis for pollution assessment of these components in the urban landscapes of Moscow and New Moscow area.
The study area (55°12-13'N, 36°21-22'E) is located in the southeastern part of the Smolensk-Moscow Upland (314 t a.s.l.), in the Middle Protva basin, 100 km to the southwest from Moscow (Fig. 1). Geomorphologically, it belongs to a marginal area of the Middle Pleistocene (MIS 6) glaciation with moraine topography modified by post-glacial erosional and fluvial processes. Climate is humid temperate continental characterized by moderately moist and warm summers (TJuly= 17.5°C), cold winters (mean TJanuary =-9.9°C) and mean annual precipitation about 600 mm. Natural vegetation is variable because the territory is located in the transition zone from mixed to deciduous forests. The forest communities cover about 60% of the studied area, while cultivated lands and meadows occupy about 40% of its territory. The major soil type is Retisol (World reference base 2015). In the Russian classification system, it corresponds to sod-podzolic soils. In the study area such soils occupy sub-horizontal surfaces and gentle slopes of the interfluve areas and develop under mixed forest (oak-spruce, lime-spruce, birch-spruce) vegetation mostly on mantle (loessial) loam, whose origin has still not been finally settled. Composed predominantly of silt-size particles, the mantle loam could have different origin (Kolevatykh 2011): glaciofluvial, eluvial, subaerial, polygenetic. It is assumed that it contains an aeolian component (Buggle et al. 2008; Muratov 1953) modified to some degree by local reworking and biological processes. About 50% of the soils in the interfluve area developed on the mantle loam in the nearest past were subjected to arable farming. The steepest relief elements in the study area such as sides of the river valleys or gullies represent erosional sites and are occupied by soddy soils (Regosols, according to World reference base 2015).
The present study deals with the topsoil horizons of a gully and a small "U”-shaped dry valley (called balka in Russian) incised into the left side of the Protva river valley (Fig. 1). The gully and the balka represent two common types of small erosional systems typical of the study area. The gully is a smaller and younger Holocene landform whose formation was initiated in between 4.3- 4.6 ka BP (cal.) probably due to a local forest fire, coincided with sharp changes of hydroclimatic conditions (Panin et al. 2011). The gully has well developed fan, a concave form of longitudinal profile and mostly "V”-shaped cross-sections characterized by sharp edges and straight sides, 20-50° steep. Similar to other Holocene gullies of the study area, very little sediment storages are found in its bottom (Fig. 2).
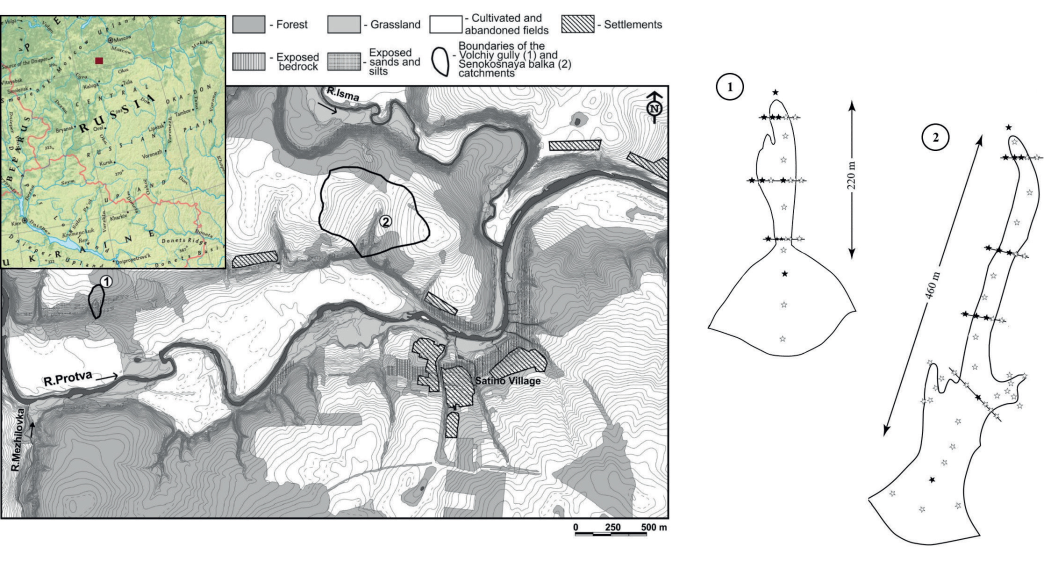
Fig. 1. The map of the study area (modified after Panin et al. 2009) with locations and schemes of the study objects - the gully (1) and the balka (2). Sampling sites are indicated with five-pointed stars
Black stars are the positions where the concentrations of metals were measured not only in a bulk soil sample but also in the separated particle size fractions.
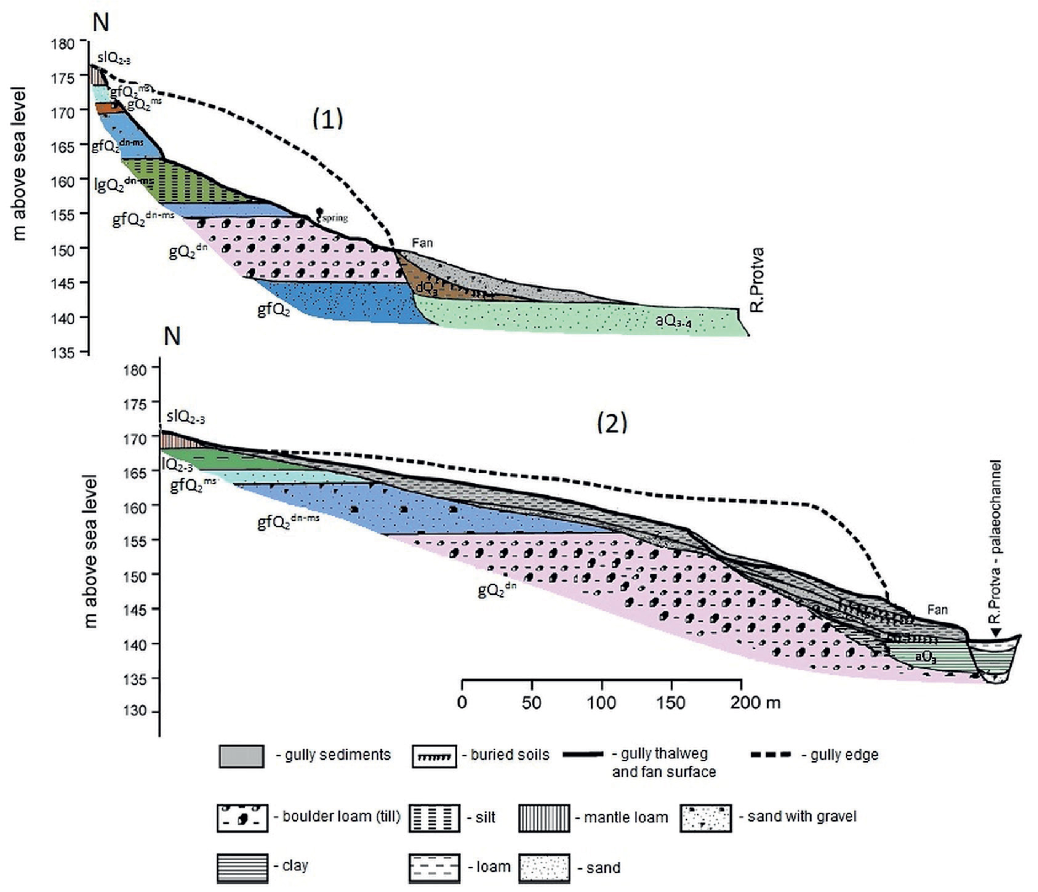
Fig. 2. Geological sections along the gully (1) and balka (2) incised in different types of Quaternary deposits and showing different sediment storage in their bottoms (from Panin et al. 2009)
Geological indexes: Origin: a - alluvium, sl - mantle loam, g - glacial till, gf- glacio-fluvial, lg - limno -glacial; Age: Q2 - Middle Pleistocene, dn - Dnieper stage (MIS-8), ms - Moscow stage (MIS-6), Q3- Late Pleistocene, Q4 - Holocene.
The soil cover of the gully's catchment is dominated by sod-podzolic soils under forest communities while in the bottom and on the sides of the landform soddy soils with weakly differentiated A-AC-C profile are developed. The gully's detrital fan is covered by soddy soils with a relatively thick humus horizon developing under herbaceous meadow communities. The soils are formed on different parent materials since the system cuts through various lithologies including glaciofluvial sands, highly erodible glacio-lacustrine silts and fine-grained sands with a limited involvement of loessial (mantle) loams and boulder clays (Fig. 2).
The balka is morphologically different and an older system whose formation was initiated in the Pleistocene and continued in the Holocene during phases and episodes of high erosion (Panin et al. 2009). The balka is incised entirely into loamy deposits, such as Late Pleistocene loessial loams, which cover significant share of interfluves area in the region and also Middle Pleistocene glacial sediments.
It has a smoothed longitudinal profile (Fig. 2), well developed fan and "U” -shaped cross-sections. The bottom of the balka is covered by loamy sediments (Fig. 2) accumulated during the periods of low erosion therefore the parent material for soil formation is more homogeneous than in the gully. The soddy soils of the balka's sides and bottom are developing on loamy deposits under grass and large shrub vegetation. The large proportion of the balka's catchment area with sod-podzolic soils was used as tillage and recently is occupied by grass vegetation. Thus, the gully and the balka, having different morphology, belong to different lithologi- cal types, which allows us to evaluate the effect of parent li- thology on particle size partitioning of metals in their humus horizons: the balka can be viewed as more homogeneous, monolithic, system with loamy deposits serving as parent material and gully belongs to a sandier and less homogeneous, heterolithic type.
The samples were taken from the surface A horizon (0-10 cm) according to the scheme displayed in Fig. 1. The sampling locations in each landform represent three major geomorphic units, such as sides, bottom and detrital fan, connected by sediment fluxes as well as adjacent catchment area considered as a source of solid matter (Samonova et al. 2014).
The collected bulk samples were analyzed for exchangeable soil acidity in 1M KCl solution. The concentrations of total organic carbon (TOC) were determined using K2Cr2O7 wet-combustion method and then recalculated to humus content (Van Reeuwijk 1992). The total levels of metals and their lateral distribution in the humus horizons of the gully and balka soils in all the sampled locations (n=75) were analyzed in our previous study (Samonova et al. 2014). Particle size analysis and physical fractionation of the bulk soil into five particle size classes was performed for the fine earth fraction <1 mm. Overall, 22 soil samples were subjected to physical fractionation (11 samples for each landform). The boundaries between particle size classes were defined in accordance with the Russian conventional fraction groups (Arinushkina 1992): coarse and medium sand (1-0.25 mm), fine sand (0.25-0.05mm), coarse silt (0.05-0.01 mm), medium and fine silt (0.01-0.001 mm), clay (<0.001 mm). The listed fractions for the convenience were designated by capital latter G and (according to particle sizes) by Arabic numerals: G1, G2, G3, G4-5, G6. The sand fractions (G1 and G2) were separated by wet sieving while the silt fractions (G3 and G4-5) as well as the clay fraction (G6) were obtained by sedimentation and siphoning, during times determined by Stokes' law (Arinushkina 1992). In the individual particle size fractions (3-5 g) and also in the bulk soil material, the concentrations of Mn, Cu, Ni, Co, Cr, Zn, Pb, Ti and Zr were determined by atomic emission spectroscopy with 3-phase dc arc using DFS-458 equipment and the concentrations of Fe were determined by atomic absorption spectrometry. In total 110 samples of the individual fractions were analyzed for the metals' contents. Many of the analysed elements, such as Ni, Co, Cr, Zn, Pb, Cu are often-studied and linked with health risk concerns (Rinklebe et al. 2019; Zwozdziak et al. 2017), while some, namely Ti and Zr, have received little attention in environmental studies as compared to other potentially toxic elements (PTEs). Also, the key (typomorphic) elements, such as Mn and Fe, are necessary in explaining the distribution of PTEs since their (hydr)oxides may incorporate trace elements and thus influence mobilization and accumulation of trace metals in soils.
For two independent subpopulations of the samples ("the balka" and "the gully” datasets, n=11, each), we calculated descriptive statistics and used two-sample t-test and significance level α=0.05 to compare the means between the two groups in order to understand whether there is a difference between the metal concentrations in bulk soil or in a particular particle size fraction on the basis of the landform type. For the statistical treatment the software program SPSSv11.0 was used. The magnitude of the differences between two subpopulations was also evaluated by calculating enrichment ratio. It shows how many times the average metal concentrations in one group of samples (bulk soil or individual particle size fractions) taken from one landform exceeds the average concentrations in the other group. This ratio in the text is given as a numeric index next to the element symbol.
The relative importance of a particular fraction with respect to its contribution to total metal concentrations was assessed on the basis of the soil textural data and the content of a particular metal in each size fractions by calculating average mass loading using the following formula (Sutherland 2003; Gong et al. 2014):
where Mi - is the average content of the metal in a particle size fraction i (mg-kg-1); Gi - the average mass percentage of individual fraction.
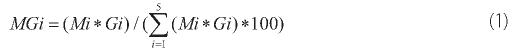
The data on average proportions of individual particle size fractions in humus horizons of various locations of the two systems are shown in Fig. 3. The greatest differences in the granulometry of the topsoil horizons are observed in the gully system, which can be explained mostly by its heterolithic nature. In the catchment area the particle-size distribution is very characteristic for loessic material and resembles one found in the topsoil of the balka's catchment. Towards the gully's fan due to the landform incision into glaciofluvial strata the granulometry of the topsoil changes: total sand share (G1 and G2) increases to 55%, while the proportions of the silt (G3 and G4- 5) drop accordingly from 70% to 32% (Fig. 3a). The amount of the clay fraction stays relatively stable, however, on average, the clay is slightly enriched in the soils located on the sides of the landform and in its adjacent catchment area (13-12%). For the longitudinal soil sequence in the gully's bottom, the linear trend estimates performed in our previous study (Samonova et al. 2014) proved that the amount of the sand fractions exhibit an increasing trend (r=0.79, p=0.002), while the silt fractions reveal decreasing trends (r=-0.75, p=0.005), which might indicate redistribution of soil material in longitudinal direction taking place during summer rainstorms or spring snowmelt.
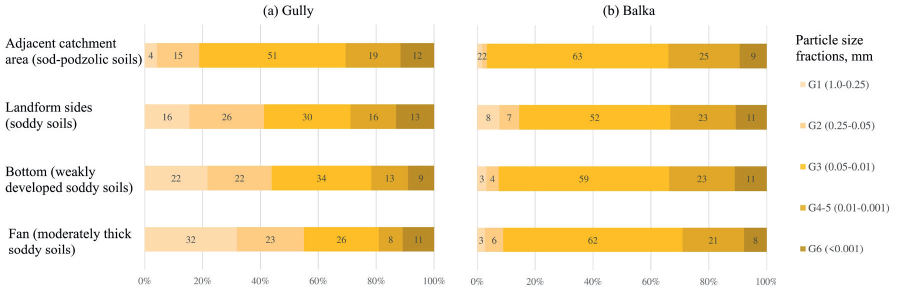
Fig. 3. Average granulometry of the topsoil horizons in the gully (a) and the balka (b) in various soil locations
Compared to the gully, the distribution of particle size fractions in soils along the different units of the balka system is more uniform. In all geomorphic positions the balka's topsoil horizons are dominated by the coarse silt, whose proportions vary between 52-63% (Fig. 3b). The clay comprises 8-11% of the fine earth fraction. The contents of the sand fractions (G1 and G2) vary within a wider range: in the topsoil of the balka's sides the sand accounts for 14%, which is higher than in the adjacent area (4%) or in the balka's bottom (7%). The estimations of linear trends for the longitudinal soil sequence in the balka's bottom (n=16) (Samonova et al. 2014) showed the patterns similar to those described for the gully.
The humus content in soils of the gully and balka systems varies considerably from very low (1-2%) to very high values (Fig. 4a) due to control of erosional-depositional processes as well as different development of vegetation communities and ground cover producing organic residues and protecting soil from erosion. The highest average levels of soil organic matter in both systems are observed in the soils occupying the sides of the landforms (Fig. 4a) probably due to accumulation of soil material that moved with creep processes (Azhigirov et al. 1987; Gennadiev et al. 2008; Golosov 2006). The minimum humus content in the two systems is found in the bottom locations which reveal decreasing linear trends in longitudinal soil sequences (from the headcuts towards fans) (Samonova et al. 2014).
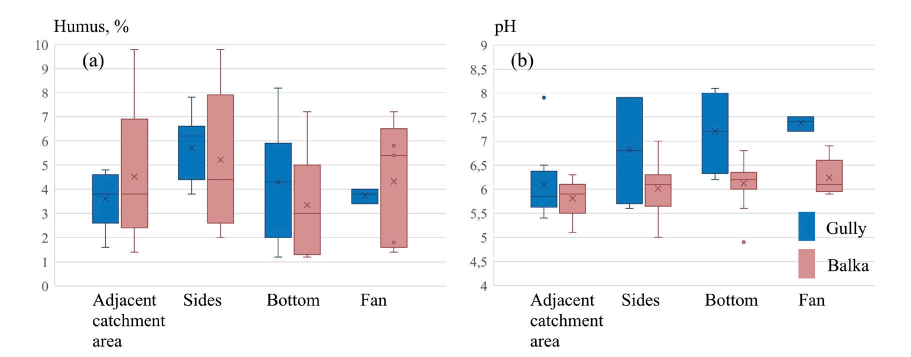
Fig. 4. Statistics on humus content (a) and pH (b) in the topsoil of the gully and balka systems
The data on the soil exchangeable acidity (Fig. 4b) display that the soils of adjacent catchment areas formed on a single parent material mostly have weakly acidic reaction. The topsoil of the internal units in the balka are characterized by weakly acidic or neutral reaction, while in the gully this parameter changes more sharply, from weakly acidic to weakly alkaline reaction. The sharp increase in pH in the landform long profile is accompanied by the rise of the fine sand content in topsoil horizons, which is caused by the incision of the gully landform into calcareous sandy strata.
The metal contents calculated for the bulk soil and individual particle size fraction for two subpopulations of samples (grouped on the basis of gully or balka membership) are presented in Appendix (Table A), and Fig. 5. The magnitude of differences between the mean values in two groups of samples was evaluated using the enrichment ratio.
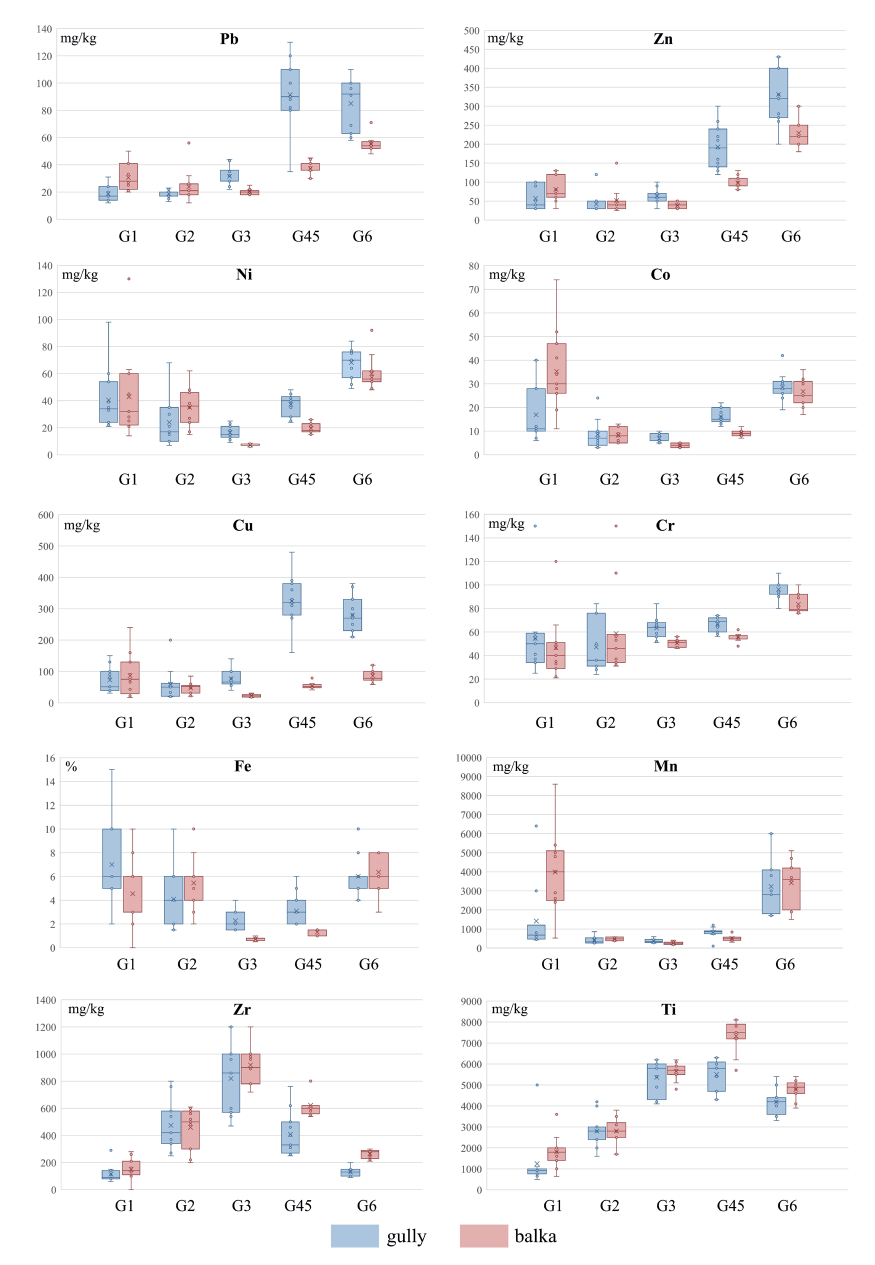
Fig. 5. Comparison between the abundances of metals in particle size fractions in humus horizons in the gully with those in the balka
Arithmetic mean is indicated as a cross, median - as a line across the box. Х-axe - particle size fractions
The results of the performed comparison demonstrated that the bulk soil (humus horizons) of the gully and the balka systems have nearly equal levels of Ni and very small differences in the average concentrations of a wide spectrum of the elements including Fe, Zr, Cu, Pb, Co (± 10%). Despite very narrow divergence between metals' contents in the gully and the balka topsoils, the differences are statistically significant (Table 1) for all listed elements except for Cu. The concentrations of Co, Zr are slightly higher in the soils of the balka, while the gully topsoil has higher levels of Pb and Fe. The larger magnitude of differences between the bulk soil of the two systems were observed for Mn, Cr, Ti, and Zn, showing higher levels in the the balka (with the enrichment ratio equal 2 for Mn, and 1.3-1.4 for other elements). The difference, however, is significant only for Mn, Cr and Ti (Table 1), while for Zn it is not. Thus, the variations in lithology across the balka and the gully systems have clear response in metals concentrations in the bulk soil: the topsoil of the balka system is generally higher in metals than that of the gully except for two metals - Fe and Pb, enriching soils of the gully.
Table 1. Results of two-sample t-test for metal concentrations in bulk and individual particle size fractions separated from humus horizons of the balka and the gully: two-tailed test p-values (n=11)
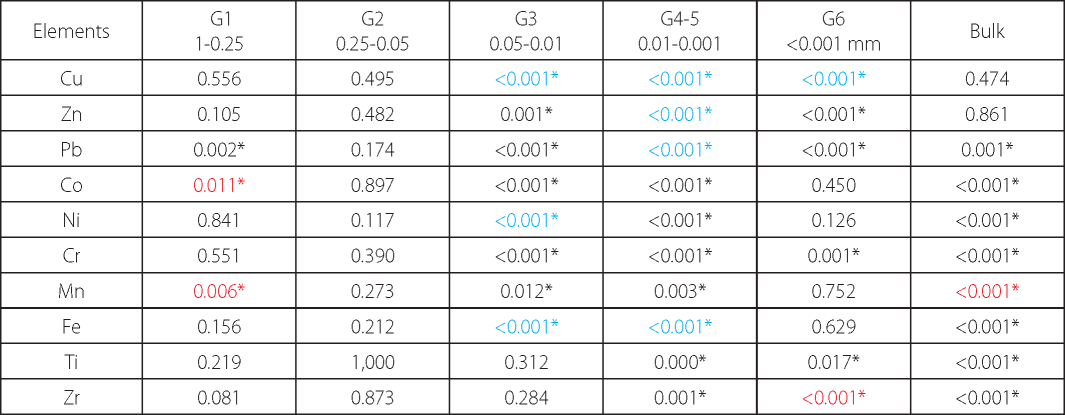
* the star sign indicates p-values below the chosen threshold (α=0.05), which means that two sets of data are significantly different from each other. For such cases the font colour (red, blue or black) is used to show the magnitude of the difference. The red or blue fonts are used to demonstrate high magnitude of the divergence between mean concentrations with the enrichment ratio >2. The red font shows that the mean concentration of a particular element is higher in the balka, while the blue one - in the gully samples.
The sand fractions might have different genesis in the two systems. In the gully, the sand could be inherited mainly from glaciofluvial strata, but in the balka sand material is mostly derived from mantle (loessial) loams. According to the obtained data, the coarse and medium sand (G1) separated from the balka's topsoil compared to that in the gully contains equal average amount of Ni, but higher concentrations of Mn2.8, Co2.1, Pb1.6, Ti,Zr1.5, Cu,Zn1.2 and lower concentrations of Fe1.4. and Cr1.2. However, statistically these differences are significant only for Mn, Co and Pb (Table 1). The higher content of these three elements in coarse particle size fraction might reflect a relative abundance of manganese coatings or nodules which are usually enriched in several other trace metals, in particular Co and Pb (Kabata-Pendias 2011; Sposito 2008; Barron and Torrent 2013). The observed metal depletion in the sand sized material in the gully system seems to be related to the fact that glaciofluvial sediments in comparison with mantle loam or till are relatively enriched in quartz (Protasova 2003; Rychagov and Antonov 1992) that does not contain or very few other elements than Si (Hardy and Cornu 2006). The fine sand fraction (G2) of the two systems has less distinct differences than the coarser one. It is equal in terms of Ti, Zr, Zn, and Co levels. However, it showed statistically insignificant differences for other elements whose average concentrations were mostly 1.5-1.2 higher in the balka, except for Cu, enriching this particle size fraction in the gully soil.
The coarse silt (G3), separated from the gully and the balka soils and composed mostly of primary minerals (Schaetzl et al. 2005), does not differ in terms of Ti and Zr levels. At the same time, in the gully it contains significantly higher amounts of Cu,Fe3.4-3.2, Ni2.3,Co1.7,Zn1.6,Pb1.5,Mn1.4,Cr1.2. The medium and fine silt (G4-5) from the gully soils also demonstrates higher contents of a wide range of metals (Cu5.9,Pb2.5, Fe2.4, Zn2.0, Ni1.9, Co1.8, Mn1.6, Cr1.2), while the same fraction from the balka's humus horizon is significantly higher in stable elements - Zr1.5 and Ti1.3. The predominance of micas and chlorite which accumulate a wide spectrum of trace metals (Hardy and Cornu 2006) over other major silt constituents, such as quartz, alkaline feldspars and plagioclases, seems to be a reasonable explanation for higher amounts of trace elements in the silt-sized material of the gully soils. The fine and medium silt fractions in the balka soils probably contain less micas and more Zr and Ti-rich primary accessory minerals (rutile and zircon).
The clay fraction (G6) showed very little (less than 10%) and not significant differences in Fe, Mn, Co, Ni levels, but higher divergence and significant difference in the average concentrations of other elements (Table 1). In particular, Cu3.3, Pb1.5, Zn1.4, Cr1.2 enrich the clay of the gully's soil, while Zr2.0 and Ti1.1 accumulate in the clay of the balka's humus horizons. Some of these patterns obviously are inherited from the silt fractions because clay is formed from silt due to geochemical and mineralogical transformation of unstable primary minerals in secondary minerals and also physical microdivision of primary silt particles (Hardy and Cornu 2006).
Metal distribution among soil particle size fractions is shown in Fig. 5. It is obvious that the metals show different patterns due to the different ways in which these elements can occur in the soils. They can be present in soil (a) as structural components in primary stable (Zr, Ti) or ferrous minerals (Fe, Ti, Mn), (b) in secondary minerals such phyllo- silicate clay or as (hydr)oxides (Fe, Mn), especially in redox conditions, and (c) as adsorbed ions on clay minerals and/ or humus (Pb, Zn, Cu, Ni). Part of the latter elements and elements of ferro-family (Co, Ni) may also be concentrated in the Fe Mn (hydr)oxides, but they are unlikely to form minerals of themselves.
The analysis of the partitioning of metals among different soil particle size fractions in the gully system showed that the studied elements can be combined into the following groups. The first group includes Fe and metals of ferro-family - Mn, Ni and Co, with a minimum average content in the coarse silt and maximums in two hosting fractions - the clay and the coarse and medium sand. Bimodal distribution of elements with concentration maxima in the clay and sand fraction was reported earlier by Qian et al. (1996) and was explained by the presence of several soil minerals and phases having high retention for metals. It is reasonable to suggest that in the clay the listed elements are associated with secondary clay minerals, while in the sand they are bound to newly formed Fe-Mn-hydroxides or ferrous heavy minerals, such as hornblende, garnet, ilmen- ite and glauconite, which are common in the soil parent materials of the study area (Rychagov et al. 1992).
The second group includes Zn, Pb, Cu, Cr. These trace metals are characterized by a minimum average content in the sand but by the maximum concentrations in finer fractions: the medium and fine silt (Pb, Cu) and the clay (Zn, Cr). The preferential accumulation of metals in the fine fractions was reported earlier both for the natural (Acosta et al. 2009; Hardy and Cornu 2006) and polluted soils (Ljung et al. 2006) suggesting that they are rather present in adsorbed form in the clay minerals and/or humus.
The third group incorporates stable elements Ti and Zr. In the gully system they reveal the maximum concentrations in the silt fractions: in the coarse silt (Zr) and in the medium and fine silt (Ti), which can be explained by their preferential occurrence in detrital grains of primary accessory minerals such as rutile, titanite, zircon (Sposito 2008). These minerals often survive several cycles of weathering and sedimentation (Deer et al. 1997) and usually concentrate in the fine sand to coarse silt fractions.
In the balka system the patterns of distribution shown by some metals are very similar to those found in the gully's soils. This is the case for Mn, Ni, Co, Fe (1), Cr (2) and also for Ti, and Zr (3). The elements from the third group compared to the gully soil, however, have slightly higher levels in the silt and the clay fractions probably due to higher mineralogical maturity of the correspondent fractions of mantle loam deposits associated with the higher relative abundance of stable accessory minerals.
The particle size partitioning of Zn, Pb and Cu seem to be more lithology dependent. The minimum concentrations of Pb, Cu, Zn in the gully on average are observed in the sand fractions (fine sand), while in the balka the lowest levels are observed in the coarse silt; the maximum concentrations of Pb and Cu in the gully are typical of the medium and fine silt, while in the balka these elements tend to accumulate in the clay.
The extent of variability of the metals' concentrations in the bulk samples of the topsoil horizons and in particle size fractions is given in Table A (Appendix). According to the variation coefficient (CV), which is often viewed as a measure of group heterogeneity (Dmitriev 2009) the highest degree of dispersion of concentrations around the mean in bulk samples of the gully system is shown by Mn (CV=50%). Other metals can be arranged into the following groups: Zn, Pb, Zr, Co (CV=20-30%); Fe, Cr, Cu, Ni, Ti (CV=10-20%). The balka has less variable topsoil geochemistry regarding metal concentrations, which can be explained by relatively homogeneous textural and mineralogical composition of the bulk samples in comparison to those in more heterogeneous gully system. In the fraction of the coarse and medium sand separated from the gully soils, the variation coefficient for the majority of the elements exceed 50%, except for Pb (30%). The dispersion around the mean reaches the highest values for Ti and Mn (101% and 128%, respectively) due to the presence of outliers. The same fraction in the balka's topsoil seems to be less variable with respect to Ti concentrations, however, Ni and Cu display higher and Zn, Pb, Cr, Fe nearly equal degree of variation.
Across the sand fractions, the fine sand in both systems reveals lower dispersion of Mn and Ti. The same trend is observed for Cr and Pb in the gully and for Cu, Ni and Fe in the balka. The higher CV values, which might indicate an increase in spatial differentiation of this fraction in comparison to the coarser sand, are displayed by Zn (in both systems), Cu, Ni, Fe (in the gully) and Pb, Cr (in the balka).
The coarse silt, when comparing with sand fraction G2, demonstrates a significant drop in the variation coefficients for the majority of the elements both in the gully (except for Pb) and in the balka (except for Mn), which could be due to the fact that the silt is more homogeneous in its mineralogical composition.
The medium and fine silt and the clay have relatively low CV for most metals. In the lithologically heterogeneous gully system finer particle size fractions G4-5 and G6 reveal the minimal CV values for all elements, except for Pb and Mn, whose lowest variation were observed in the fine sand (Pb) or coarse silt (Mn). In the balka's soils only Mn displayed the minimal dispersion in the sand fraction (G2), while other elements were found to be the least variable in G3 and finer fractions. When comparing fine soil fractions between the two systems, the general trend was revealed: the variations of the metal concentrations are higher in the gully's soil. In the medium and fine silt the difference in CV values for Zn, Pb, Fe is twice higher or nearly three times for Zr. In the clay the same magnitude of differences in CV is shown by Pb and Zr. The lower variations in metal contents in the balka's fine fractions could be due to more homogeneous mineralogical composition of fine soil material and/or its more intensive transformation by soil-geochemical processes.
Contributions of particle size fractions to total metal concentrations in topsoil horizons of the gully and balka system.
The relative importance of particle size fractions in controlling total metal concentrations in topsoil horizons of the gully and balka system was evaluated by considering the joint effect of average abundances of particle size fractions and their metal contents. The results of these calculations are shown in Fig. 6.
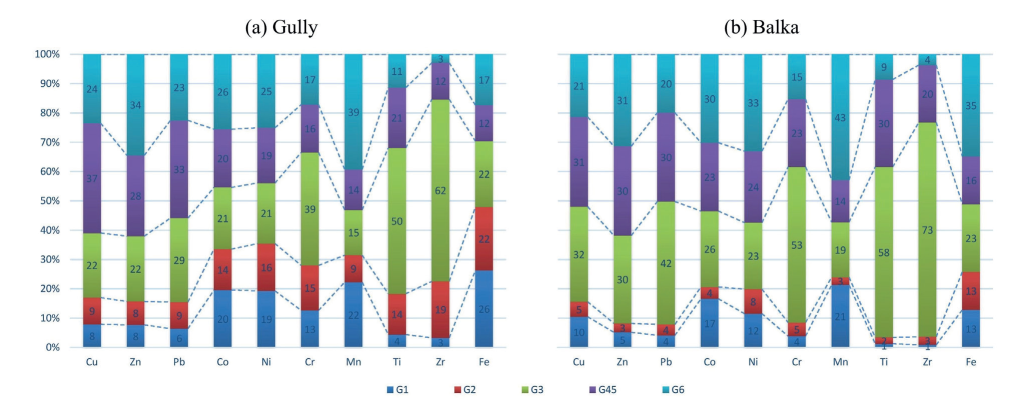
Fig. 6. The average mass loadings of different particle size fractions in terms of metal contents in the bulk soil (humus horizon) of the gully (a) and the balka (b)
In the gully soils (Fig. 6a), the maximum mass loadings of Mn (39%), Zn (34%), Co and Ni (25%) were associated with the clay fraction. This reflects high concentrations of the listed metals in clay-sized particles (Fig. 5) characterized, however, by relatively low average share (11%) in the topsoil horizons of the studied system. For the same reason the maximum contribution of Cu (37%) and Pb (33%) in the gully's soils came from the fraction of the medium and fine silt (Fig. 6a). The coarse silt, which dominates over other particle size fractions, mostly controls the concentrations of stable elements - Zr (62%), Ti (50%) and also Cr (39%), while the contribution of other elements from this fraction does not exceed 22% (29% for Pb). The only element whose maximum mass loading came from the sand fraction (coarse and medium sand) was Fe (26%).
In the balka the clay fraction with average proportion of 10% makes the maximum contribution to the total amount of a wide range of metals: Mn (43%), Fe (35%), Ni (33%), Zn (31%) and Co (30%). The second important fraction is the coarse silt (Fig 6b). Because of high amount in the bulk soil (58%) it makes the maximum mass loading for Zr (73%), Ti (58%), Cr (53%) Pb (42%) and Cu (32%). The coarser sand fractions G1 and G2 due to their very low amount in the surface horizons of the balka's soils (4%) have very little loadings of Ti, Zr, Cr, Pb but make slightly higher contribution to total abundances of ferro-family elements (Mn, Fe, Co, Ni) and also Cu.
The bulk soil of the gully and balka systems revealed very little differences in average concentrations for the majority of metals except for Mn, Cr and Ti enriching the balka's soils.
Some individual particle size fractions in the two systems have equal average levels of the specific metals: the coarse and medium sand - Ni, the fine sand - Ti, Zr, Zn, Co; the coarse silt - Ti and Zr, the clay fraction - Fe, Mn, Co and Ni.
The silt fractions separated from the gully's and the balka's humus horizons have the most prominent differences regarding the mean metal contents. The silt size particles in the gully's soils on average are more metal-rich than those in the balka's soils. The significant differences in metal concentrations between the two studied systems were also found for the coarse and medium sand: this fraction has higher levels of the majority of metals in the balka's soil.
The variability of the metal content is related to the sizes of particles and decreases from the coarser to finer particle size fractions, which is explained by relatively homogeneous mineralogical composition and the predominance of secondary clay minerals over the primary ones in the fine silt and clay fraction.
The topsoil horizons of the two systems have common types of distribution over the particle size fractions for the majority of the studied metals but slightly different ones for Zn, Cu and Pb. Our data provides evidences that preferential association of metals with particle size fractions is not limited to finer fractions. The elements of ferro-family (Fe, Mn, Co, Ni ) appear to have bimodal distribution with concentration maxima in the clay and sand fraction. The partitioning of Ti and Zr accumulating in the silt fractions is governed by their incorporation in mineral structure of accessory minerals that are stable during the processes of physicochemical weathering and soil formation.
The contribution of the clay to the total mass loading of metals was the greatest for Mn, Zn, Ni and Co in both systems. The highest mass loading for Ti, Zr and Cr came from the coarse silt, while for Cu and Pb it was made by different particle size fractions: the medium and fine silt in the gully or the coarse silt in the balka. The highest contribution of Fe also came from different fractions, either from the coarse sand in the gully or the clay in the balka.
The genesis and lithogeochemical parameters of the soil parent material might affect the particle size partitioning of metals in the topsoil in the small erosional landforms and control the absolute concentrations of metals in individual particle size fractions.
Table A. Metal concentrations in bulk and individual particle size fractions of topsoil horizons in the gully and balka (n=11; Min: minimum, Max: maximum, VC: variation coefficient, %)
Sample | Statistics | Cua | Zna | Pba | Coa | Nia | Cra | Mna | Tia | Zra | Feb |
|---|---|---|---|---|---|---|---|---|---|---|---|
| Gully | ||||||||||
| Min | 24 | 40 | 21 | 7 | 22 | 40 | 320 | 3500 | 320 | 1.5 |
| Max | 36 | 90 | 44 | 18 | 40 | 63 | 1300 | 6200 | 840 | 2.0 |
| Mean | 28.2 | 63.6 | 31.5 | 10.7 | 27.6 | 52.8 | 563.6 | 4281.8 | 536.4 | 1.9 |
Bulk soil | VC | 14.2 | 20.2 | 22.5 | 31.2 | 18.6 | 14.0 | 51.7 | 19.6 | 29.1 | 10.6 |
Balka | |||||||||||
| Min | 20 | 60 | 26 | 11 | 21 | 59 | 600 | 5100 | 350 | 1.5 |
| Max | 34 | 100 | 35 | 14 | 27 | 84 | 1600 | 6400 | 720 | 2.0 |
| Mean | 29.6 | 82.7 | 30.8 | 12.2 | 24.7 | 71.7 | 1107.3 | 5381.8 | 570.9 | 1.8 |
| VC | 12.4 | 14.4 | 8.9 | 10.9 | 9.1 | 10.0 | 29.9 | 7.7 | 16.6 | 14.7 |
| Gully | ||||||||||
| Min | 31 | 30 | 12 | 6 | 21 | 25 | 420 | 500 | 60 | 2 |
| Max | 150 | 100 | 31 | 40 | 98 | 150 | 6400 | 5000 | 290 | 15 |
| Mean | 72.4 | 67.5 | 18.6 | 16.9 | 40.5 | 54.5 | 1410.9 | 1246.4 | 114.5 | 7.0 |
1-0.25mm | VC | 56.4 | 48.7 | 31.3 | 75.6 | 56.6 | 61.9 | 128.2 | 100.9 | 55.9 | 49.5 |
Balka | |||||||||||
| Min | 17 | 30 | 20 | 11 | 14 | 21 | 520 | 640 | 100 | 2.0 |
| Max | 240 | 130 | 50 | 74 | 130 | 120 | 8600 | 3600 | 280 | 10.0 |
| Mean | 86.6 | 80.9 | 30.6 | 35.3 | 42.9 | 46.5 | 3983.6 | 1812.7 | 166 | 5 |
| VC | 78.0 | 40.4 | 31.9 | 49.6 | 76.7 | 59.7 | 53.9 | 43.1 | 38.3 | 52.5 |
| Gully | ||||||||||
| Min | 19 | 30 | 13 | 3 | 7 | 24 | 250 | 1600 | 250 | 1.5 |
| Max | 200 | 120 | 23 | 24 | 68 | 84 | 860 | 4200 | 800 | 10 |
| Mean | 59.1 | 56.0 | 18.7 | 8.5 | 24.0 | 47.1 | 412.7 | 2800.0 | 474.5 | 4.1 |
0.25-0.05mm | VC | 88.5 | 66.3 | 15.7 | 72.8 | 73.3 | 46.6 | 45.8 | 27.6 | 39.5 | 65.8 |
Balka | |||||||||||
| Min | 21 | 25 | 12 | 5 | 15 | 31 | 360 | 1700 | 200 | 2.0 |
| Max | 85 | 150 | 56 | 13 | 62 | 150 | 580 | 3800 | 610 | 10.0 |
| Mean | 47.5 | 51.4 | 23.9 | 8.3 | 35.1 | 58.6 | 482.7 | 2800.0 | 459.1 | 5.5 |
| VC | 39.2 | 68.0 | 49.4 | 35.9 | 39.8 | 64.2 | 17.1 | 23.3 | 32.5 | 41.3 |
| Gully | ||||||||||
| Min | 40 | 30 | 22 | 5 | 9 | 51 | 250 | 4100 | 470 | 1.5 |
| Max | 140 | 100 | 44 | 10 | 25 | 84 | 600 | 6200 | 1200 | 4 |
| Mean | 76.9 | 62.7 | 31.6 | 6.9 | 16.5 | 63.3 | 372.7 | 5363.6 | 819.1 | 2.3 |
0.05-0.01mm | VC | 36.0 | 31.2 | 22.7 | 25.4 | 31.2 | 14.9 | 29.2 | 15.6 | 33.0 | 37.3 |
Balka | |||||||||||
| Min | 17 | 30 | 18 | 3 | 6 | 46 | O CO | 4800 | 720 | 0.5 |
| Max | 31 | 50 | 25 | 5 | 8 | 56 | 410 | 6200 | 1200 | 1.0 |
| Mean | 22.8 | 38.2 | 20.4 | 4.0 | 7.2 | 50.5 | 260.9 | 5654.5 | 919.1 | 0.7 |
| VC | 19.3 | 22.9 | 10.1 | 19.4 | 10.5 | 7.1 | 30.1 | 7.2 | 14.5 | 19.5 |
| Gully | ||||||||||
| Min | 160 | 120 | 35 | 12 | 24 | 56 | 100 | 4300 | 250 | 2 |
| Max | 480 | 300 | 130 | 22 | 48 | 74 | 1200 | 6300 | 760 | 6 |
| Mean | 323.6 | 192.7 | 91.5 | 16.2 | 37.3 | 66.6 | 823.6 | 5500.0 | 408.2 | 3.1 |
0.01-0.001tt | VC | 25.3 | 30.4 | 27.4 | 20.5 | 22.1 | 9.5 | 33.8 | 13.6 | 40.1 | 44.5 |
Balka | |||||||||||
| Min | 41 | 80 | 30 | 7 | 15 | 48 | 310 | 5700 | 540 | 1.0 |
| Max | 79 | 130 | 45 | 12 | 26 | 62 | 840 | 8100 | 800 | 1.5 |
| Mean | 54.4 | 98.2 | 37.2 | 9.1 | 19.5 | 55.7 | 503.6 | 7336.4 | 621.8 | 1.3 |
| VC | 17.9 | 16.3 | 12.9 | 15.1 | 20.1 | 6.3 | 28.2 | 10.5 | 14.7 | 19.1 |
| Gully | ||||||||||
| Min | 210 | 200 | 58 | 19 | 49 | 80 | 1700 | 3300 | 90 | 4 |
| Max | 380 | 430 | 110 | 42 | 84 | 110 | 6000 | 5400 | 200 | 10 |
| Mean | 280.0 | 330.9 | 85.0 | 28.6 | 68.2 | 96.2 | 3227.3 | 4190.9 | 130.0 | 6.0 |
<0.001tt | VC | 21.2 | 23.0 | 22.0 | 20.4 | 16.6 | 8.1 | 49.6 | 14.8 | 23.8 | 28.9 |
Balka | |||||||||||
| Min | 58 | 180 | 48 | 17 | 48 | 76 | 1500 | 3900 | 210 | 3.0 |
| Max | 120 | 300 | 71 | 36 | 92 | 100 | 5100 | 5400 | 300 | 8.0 |
| Mean | 86.3 | 229.1 | 55.5 | 26.7 | 60.0 | 83.6 | 3418.2 | 4790.9 | 263.6 | 6.4 |
| VC | 24.2 | 17.9 | 10.5 | 21.6 | 21.1 | 9.8 | 33.8 | 9.4 | 12.5 | 27.5 |
a mg·kg-1
b %
1. Acosta J., Faz Cano A., Arocena J., Debela F. and Martínez-Martínez S. (2009). Distribution of metals in soil particle size fractions and its implication to risk assessment of playgrounds in Murcia City (Spain). Geoderma, 149, 101-109. DOI: 10.1016/j.geoderma.2008.11.034.
2. Acosta J., Martínez-Martínez S., Faz A. and Arocena J. (2011). Accumulations of major and trace elements in particle size fractions of soils on eight different parent materials. Geoderma, 161(1), 30-42. DOI:10.1016/j.geoderma.2010.12.001.
3. Ajmone-Marsan F., Biasioli M., Kralj T., Grčman H., Davidson C.M., Hursthouse A.S., Madrid L. and Rodrigues S. (2008) Metals in particle-size fractions of the soils of five European cities. Environmental Pollution, 152, 73-81. DOI: 10.1016/j.envpol.2007.05.020.
4. Arinushkina E. (1992). Handbook for chemical analysis of soils. Moscow: Chimiya Publishing house. (in Russian). Azhigirov A., Golosov V., Dobrovolskaya N., Litvin L. and Samodurova L. (1987). Investigation of the flow of water and sediment along interfluve slopes in the Protva river basin. VINITI, 6389-B87, 51-77. (in Russian).
5. Barrón V. and Torrent J. (2013). Iron, manganese and aluminium oxides and oxyhydroxides. European Mineralogical Union Notes in Mineralogy, 14, 297-336. DOI: 10.1180/EMU-notes.14.9.
6. Banerjee A. (2003) Heavy metal levels and solid phase speciation in street dusts of Delhi, India. Environmental Pollution, 123, 95-105. DOI:10.1016/S0269-7491(02)00337-8.
7. Buggle B., Glaser B., Zoeller L., Hambach U., Markovic S., Glaser I. and Gerasimenko N. (2008). Geochemical characterisation and origin of Southeastern and Eastern European loesses (Serbia, Romania, Ukraine). Quaternary Science Reviews, 27, 1058-1075. DOI: 10.1016/j. quascirev.2008.01.018.
8. Deer W., Howie R. and Zussman J. (1997) Orthosilicates. In: Rock-forming minerals: Volume 1A, 2nd ed. Bath, UK: Geological Society, 418-466.
9. De Miguel E., Llamas J., Chacón E., Berg T., Larssen S., Royset O. and Vadset M. (1997). Origin and patterns of distribution of trace elements in street dust: unleaded petrol and urban lead. Atmos. Environ., 31, 2733-2740.
10. Dmitriev Ye. (2009). Mathematical Statistics in Soil Science, 3rd ed. Moscow: Book House Librokom. (in Russian).
11. Dobrovolskii V. (1983). Geography of Trace Elements. Global Dispersion. Moscow: Mysl’. (in Russian).
12. Förstner U. (1982). Chemical forms of metal accumulation in recent sediments. In: G. C. Amstutz, G. Frenzel, C. Kluth, G. Moh, A. Wauschkuhn, R. Zimmermann, A. El Goresy, eds., The Ore genesis. Berlin; Heidelberg: Springer-Verlag, 191-199.
13. Gennadiev A., Koshovskii T., Zhidkin A. and Kovach R. (2013) Lateral migration of soil solid-phase material within a landscape-geochemical arena detected using the magnetic tracer method. Eurasian Soil Science, 46(10), 983-993.
14. Golosov V. (2006). The erosional and accumulative processes in river basins in cultivated plains. Moscow: Geos. (in Russian).
15. Gong C., Ma L., Cheng H., Liu Y., Xu D., Li B., Liu F., Ren Y., Liu Z., Zhao C., Yang K., Nie H. and Lang C. (2014)
16. Characterization of the particle size fraction associated heavy metals in tropical arable soils from Hainan Island, China. Journal of Geochemical Exploration, 139, 109-114. DOI: 10.1016/j.gexplo.2013.01.002.
17. Hardy M. and Cornu S. (2006). Location of natural trace elements in silty soils using particle-size fractionation. Geoderma, 133, 295-308. DOI: 10.1016/j.geoderma.2005.07.015.
18. Kabata-Pendias A. (2011) Trace elements in soils and plants, 4th ed. London, New York: CRC Press, Boca Raton.
19. Khademi H., Gabarrón M., Abbaspour A., Martínez-Martínez S., Faz A. and Acosta J. (2019). Environmental impact assessment of industrial activities on heavy metals distribution in street dust and soil. Chemosphere, 217, 695-705. DOI: 10.1016/j.chemosphere.2018.11.045.
20. Kolevatykh E. (2011). Geochemistry of landscapes on mantle loams of the Vyatsko-Kama Cis-Urals: synopsis of the PhD theses. Perm. (in Russian).
21. Liu G., Wang J., Liu X., Liu X., Li X., Ren Y., Wang J. and Dong L. (2018). Partitioning and geochemical fractions of heavy metals from geogenic and anthropogenic sources in various soil particle size fractions. Geoderma, 312, 104-113. DOI: 10.1016/j.geoderma.2017.10.013.
22. Ljung K., Selinus O., Otabbong E. and Berglund M. (2006). Metal and arsenic distribution in soil particle sizes relevant to soil ingestion by children. Applied Geochemistry, 21, 1613-1624. DOI: 10.1016/j.apgeochem.2006.05.005.
23. Muratov M. (1953). On the conditions of loam formation in the Quaternary period. Bulletin of the Quaternary Commission, 19, 57-64. (in Russian).
24. Panin A., Fuzeina Ju. and Belyaev V. (2009). Long-term development of Holocene and Pleistocene gullies in the Protva River basin, Central Russia. Geomorphology, 108, 71-91. DOI: 10.1016/j.geomorph.2008.06.017.
25. Panin, A., Fuzeina, Y., Karevskaya, I. and Sheremetskaya, E. (2011). Mid-Holocene gullying indicating extreme hydroclimatic events in the centre of the Russian Plain. Geographia Polonica, 84, 95-115. DOI: 10.7163/GPol.2011.1.6.
26. Pobedinceva I. (1975). The soils on ancient weathering crusts. Moscow: Moscow Univ. Press. (in Russian).
27. Protasova N. (2003). Rare and trace elements (Mn, Cr, V, Ni, Cu, Zn, Co, Mo, Be, Ti, Zr, Ga, Sr, Ba, I, B) in the parent materials of the Central Chernozemic Belt region. Voronezh University Bulletin. Series Himija, biologija, farmacija, 2, 164-171. (in Russian).
28. Qian J., Shari X., Wang Z. and Tu Q. (1996). Distribution and plant availability of heavy metals in different particle-size fractions of soil. The Science of the Total Environment, 187, 131-141.
29. Rinklebe J., Antoniadis V., Shaheen S. M., Rosche O. and Altermann M. (2019) Health risk assessment of potentially toxic elements in soils along the Central Elbe River, Germany. Environment International, 126, 76-88. DOI: 10.1016/j.envint.2019.02.011.
30. Rychagov G. and Antonov S. (1992). The integrated analysis of the Quaternary deposits of the Satino training station. Moscow: Moscow Univ. Press. (in Russian).
31. Samonova O. and Aseeva E. (2006). Geochemical transformation of mantle and moraine loams as a result of soil formation in the Central Protva river basin. Vestnik Moskovskogo universiteta. Seriya 5, Geografiya, 6, 67-74. (in Russian with English summary).
32. Samonova O. and Aseeva E. (2008). The distribution of metals in grain-size fractions of soils in the southeastern part of the SmolenskMoscow Upland. Vestnik Moskovskogo universiteta. Seriya 5, Geografiya, 3, 32-39. (in Russian with English summary).
33. Samonova O. and Aseyeva E. (2013). Distribution of metals in particle size fractions in soils of two forested catenas (Smolensk-Moscow upland). Geography, Environment, Sustainability, 6(2), 28-33, DOI: 10.24057/2071-9388-2013-6-2-28-33.
34. Samonova O., Aseyeva E. and Kasimov N. (2014). Metals in soils of erosional systems in forest zone in the central part of European Russia. J. Geochem. Explor., 144, 247−259. DOI: 10.1016/j.gexplo.2014.03.012.
35. Semenkov I. and Koroleva T. (2019). The spatial distribution of fractions and the total content of 24 chemical elements in soil catenas within a small gully’s catchment area in the Trans Urals, Russia. Applied Geochemistry, 106, 1-6. DOI: 10.1016/j.apgeochem.2019.04.010.
36. Schaetzl R.J. and Anderson S. (2005). Soils. Genesis and geomorphology. Cambrige university press.
37. Sposito G. (2008). The chemistry of soils. 2nd ed. New York, USA: Oxford University Press.
38. Sutherland R. (2003). Lead in grain size of road deposited sediment. Environmental pollution, 121, 229-237, DOI: 10.1016/S0269- 7491(02)00219-1.
39. Van Reeuwijk L. (1992). Procedures for soil analysis. 3rd ed. Wageningen: ISRIC.
40. Vlasov D., Kasimov N. and Kosheleva N. (2015). Geochemistry of road dust in the Eastern District of Moscow. Vestnik Moskovskogo universiteta. Seriya 5, Geografiya, 1, 23-33. (in Russian with English summary).
41. World Reference Base for Soil Resources 2014, update 2015. (2015). International soil classification system for naming soils and creating legends for soil maps. World Soil Resources Reports 106. Rome: Food and Agriculture organization of the United Nation. Available at: www.fao.org/soils-portal/soil-survey/soil-classification/world-reference-base/en/ [Accessed 20 Jan. 2019].
42. Zhang J., Wu L., Zhang Y., Li F., Fang X. and Mao H. (2019). Elemental composition and risk assessment of heavy metals in the PM10 fractions of road dust and roadside soil. Particuology, 44, 146-152. DOI: 10.1016/j.partic.2018.09.003.
43. Zwozdziak А., Gini M.I., Samek L., Rogula-Kozlowska W., Sowka I. and Eleftheriadis K. (2017). Implications of the aerosol size distribution modal structure of trace and major elements on human exposure, inhaled dose and relevance to the PM2.5 and PM10 metrics in a European pollution hotspot urban area. Journal of Aerosol Science, 103, 38-52. DOI: 10.1016/j.jaerosci.2016.10.004.
Faculty of Geography,
Leninskiye Gori, 1, Moscow, 119991
Faculty of Geography,
Leninskiye Gori, 1, Moscow, 119991
Samonova O.A., Aseyeva E.N. Particle size partitioning of metals in humus horizons of two small erosional landforms in the middle Protva basin – a comparative study. GEOGRAPHY, ENVIRONMENT, SUSTAINABILITY. 2020;13(1):260-271. https://doi.org/10.24057/2071-9388-2019-116

Editor-in-Chief
Kasimov Nikolay S.Lomonosov Moscow State University
Moscow 119991 Russia, Leninskie Gory, Faculty of Geography, 1806a
Phone +7 495 939-15-52
E-mail: ges-journal@geogr.msu.ru


