


Contents
Scroll to:
https://doi.org/10.24057/2071-9388-2019-123
Scroll to:
Klimanova O.A., Illarionova O.I. Green infrastructure indicators for urban planning: applying the integrated approach for Russian largest cities. GEOGRAPHY, ENVIRONMENT, SUSTAINABILITY. 2020;13(1):251-259. https://doi.org/10.24057/2071-9388-2019-123
Urbanization of megacities meets a lot of different environmental, economic and social problems and risks (Kotter et al. 2009). As a remedy to some of these negative consequences of urbanization, the installation of green infrastructure as opposed to grey infrastructure is identified as an alternative nature-based and cost-effective solution for improving the sustainability of the urban development (Ahern 2013; Alberti 2008).
Green infrastructure is described as an integrated network of natural and semi-natural areas and features which deliver a variety of benefits to humans (Naumann 2011). Modern approaches to urban planning assume the dualistic nature of urban green infrastructure (Benedict and McMahon 2012; Austin 2014; Lafortezza et al. 2013). In the context of landscape ecology, green infrastructure preserves its integrity due to the reasonable structure and internal links and interactions (Alberti 2008; Forman 2015). At the same time GI is multifunctional and provides the residents by complex of ecosystem services to be user-oriented (Gill et al. 2007; Hansen et al. 2014).
In the past years, an increasing number of studies have been conducted on green infrastructure indicators, which can be generally categorized into two groups. The first one includes «general» indicators that generally characterize the quantity and types of urban green space (Green infrastructure and territorial cohesion 2011; Gomez et al. 2011; Kabisch et al. 2013; Huang 2017). Data for them, mainly the share of vegetated area in the city, can be collected from remote sensing (Huang et al. 2017; Yang et al. 2014; Ahmad 2014). Remote sensing enables us to evaluate not only a current share of different green infrastructure types within the city, but to reveal its changes as well (Cheng et al. 2011; Li et al. 2015).
Based on remote sensing data, land cover models can be interpreted as a variation of this indicator (Cheng et al. 2011; Zeng 2016; Huang et al. 2017). When combined with land use statistics, they are used to assess ecosystem services (Green Infrastructure and Territorial cohesion 2011). Projects like Urban Atlas and CORINE Land Cover offer an open access for this data on European cities. Such algorithm was applied to evaluate similar indicators for Moscow (Klimanova et al. 2018). Some other countries develop national standards to regulate urban land use in functional zones. Thus, in China, permitted ranges of the percentages of urban land are allocated for different uses are established for residential, industrial, administrative use and green spaces (MOHURD 2010).
Usually the indicators of this group are not regulated by general international standards, but rather by local state or city government. For example, London Department for Communities and Local Government requires 40% of green area within the city, including green roofs and household gardens. This indicator - the percentage of urban green infrastructure - is often referred to by different European manuals for urban planning (like Handley 2003, Good Practice Guidance for Green Infrastructure and Biodiversity, TCPA 2012), Urban Green Infrastructure Planning: A Guide for Practioners (Hansen 2017). In China, key goals for the national garden city scheme was to ensure that the percentage of green spaces in urban areas should be higher than 36% and have potential opportunities to achieve more than 40% in the future (MOHURD 2010). Russia also has its national standards for urban green infrastructure. According to them, green space must occupy at least 40% of the city's area (Sanitary Regulations and Standards 2003).
Another «general» indicator from the first group is urban green infrastructure per capita. World Health Organization recommends the minimum of 9 m2 green space per capita, while an optimum is about 50 m2 per capita (WHO 2016). These regulations may vary in different countries (Russia, China), depending on nature zones, but they must not be below international recommendations.
The second group of «special» indicators describes the quality of green infrastructure. Generally speaking, it determines how well urban green areas fulfill their functions. It is common knowledge that vegetation removes air pollutants, reduces urban heat island effect and street noise. However, the efficiency of these functions depends on the vegetation health, particularly on the density and condition of the leaf cover. These parameters are assessed by matching NDVI with field data (Ahmad 2014; Chen 2002). Another common indicator to assess green infrastructure quality is Leaf Area Index (LAI), varying from 1 to 10. It is defined as the green leaf area per unit ground surface area, and measured by using either field date at the local scale or remote sensing for large territories (Fang 2014).
The accessibility of green areas promotes active lifestyle and outdoor activities, positively effecting physical and mental health (Annerstedt et al. 2016; Ekkel et al. 2017). To assess how much green infrastructure influences the conditions for urban recreation, the availability of green space within easy walking distance from residential area is measured. A number of works, including (WHO 2016) reports, turn to Accessible Natural Greenspace Standard (ANGSt) (Ma 2016), according to which the accessibility indicator can be assessed at three levels: 5 minutes walk from home - 400 m, 10 minutes - 800 m, 15 minutes - 1200 m (Pauleit 2003). Moreover, ANGSt recommends that citizens should have at least 1 accessible ha of green area within 300 m of residential area, 20 ha within 2000 m, 100 ha within 5000 m, and 500 ha within 10000 m (Handley 2003). General green infrastructure accessibility is defined as a ratio of the population with an access to green area in the 300 m buffer to the total city's population (WHO 2016). This standard was also partially used to evaluate accessibility in Google Earth Engine system (2005-2015) for 28 world megacities (Huang et al. 2017).
Special fragmentation/cohesion indicators are used to assess the integrity of urban green infrastructure (Andersson et al. 2008; Werner 2011). Basically, fragmentation is a process in which large elements are divided into smaller isolated segments with their geometric shape becoming more complex due to the economic activity (McGarigal 1995). As fragmentation disrupts the interchange of energy and matter between green areas, it primarily affects supporting and regulating ecosystem services (Zhang 2017). Of course, urban forests lack the sustainability of natural ecosystems and are more vulnerable. Still, GI connectivity and integrity allows species (mostly birds and insects) to move through all the green network and thus to create stable populations (Shavnin 2011). At the same time, however, high fragmentation means an even distribution of green elements in the city, and that is important for GI recreational role. Thus, when dealing with GI fragmentation, both sides of its interpretation should be considered.
European Environmental Agency (EEA 2017) also uses a similar fragmentation indicator in their reports - a distribution of green urban areas (GUA), that is defined as the relationship between green area boundaries (edges) and all the other elements present in the city. The total length of the edges is compared with the city's urban area. The edge density provides an indication of the distribution of GUAs. A high edge density in a city indicates a relatively high number of green areas that border residential, commercial, industrial or other public buildings. Consequently, a higher value for the indicator may be due to a long boundary length, i.e. more small patches. The agency, however, does not establish certain values of indicators.
Finally, the green infrastructure integrated assessment is often considered a part of urban sustainability (or urban ecosystems health) research (Bell et al. 2008; Mell 2009; Pakzad et al. 2016; Zeng 2016). For instance, urban ecosystems health of Chinese megacities is described by parameters like per capita green area, built-up area green coverage rate, percentage of different type of land system (cropland, forest cover, grassland, water area and unutilized land) (Zeng et al. 2016). All of them, though, belong to the assessment of the facility and land systems.
In most cases, the common method for assessing urban green infrastructure incorporates an index system and weight determination for a final value that reflects the green infrastructure status of each city. Other works have attempted (Cheng 2011; Yang 2014; Klimanova 2018) to combine the advancements made in urban natural ecosystem assessment with the distinct purposes for recreation of urban green areas. Measures of availability and accessibility have been integrated, whereas the link between these components and GI fragmentation is still weak. The assessment of urban green infrastructure requires both groups of indicators and also the accounting of spatial distribution of green spaces.
In this study, we aimed to assess the current state of urban green infrastructure by establishing an indicator system associating GI general indicators their quality. These approaches were applied to the 15 largest Russian cities to evaluate their status quo and facilitate future urban management.
The objects of our research are the largest Russian cities with population over one million people. Eight out of fifteen cities are situated in the European part of the country, four in the Urals and three in Siberia. Their social-economic data is shown in Table 1.
Table 1. Socioeconomic development of largest cities in 2016
City | Natural zone | Area (km2) | Population (million) | Annual population growth, 2007-2017, per cent | Population density (prs per km2) | GDP (billion USD) (2015) |
|---|---|---|---|---|---|---|
Moscow | Mixed forest | 2432 | 12.381 | + 1.05 | 5091 | 213.15 |
St Petersburg | Coniferous forest | 1439 | 5.282 | +1.4 | 3670 | 61.5 |
Novosibirsk | Forest-steppe | 481 | 1.603 | + 1.38 | 3333 | 11.5 |
Ekaterinburg | Coniferous forest | 401 | 1.456 | +0.97 | 3631 | 13.8 |
Perm | Coniferous forest | 806 | 1.456 | +0.53 | 1806 | 8.1 |
Nizhny Novgorod | Mixed forest | 317 | 1.262 | -0.11 | 3981 | 11.6 |
Kazan | Mixed forest | 635 | 1.232 | +0.94 | 1940 | 8.5 |
Chelyabinsk | Forest-steppe | 504 | 1.178 | +0.89 | 2337 | 8.5 |
Samara | Forest-steppe | 543 | 1.170 | +0.24 | 2155 | 9.2 |
Rostov-on-Don | Steppe | 355 | 1.125 | +0.64 | 3169 | 9.3 |
Ufa | Mixed forest | 667 | 1.116 | +0.83 | 1673 | 8.6 |
Krasnoyarsk | Coniferous forest | 378 | 1.083 | + 1.52 | 2865 | 8.9 |
Voronezh | Forest-steppe | 601 | 1.040 | +2.15 | 1730 | 6.5 |
Omsk | Steppe | 580 | 1.016 | +0.35 | 1752 | 7.3 |
Volgograd | Steppe | 861 | 1.015 | +0.27 | 1179 | 6.0 |
Source: Russian Federal State Statistics Service (2016) and Institute of Urban Economics (2015)
The largest and most populated city is the capital - Moscow. It is the only Russian city that, according to the international indicators, can be considered a megacity and that is one of top- 25 world cities with the highest GDP and GDP growth (Dobbs 2011). Saint Petersburg is the second most populated city in Russia and like Moscow is also a city of federal importance. The highest rate of population increase is found in Voronezh and Krasnoyarsk, while in Nizhny Novgorod the population is rapidly dwelling. Population growth is an important factor to consider when investigating urban GI and particularly its dynamics, since green area may not change a lot, but considering a significant population increase, it is not a positive result. A growing population means a growing demand for green infrastructure, so the «protection and conservation policy» is not sufficient. More measures for green area enhancement should be applied.
Omsk, Chelyabinsk, Ufa and Krasnoyarsk are big industrial cities with significant emissions from point source. The share of transport emissions varies from 34% in Krasnoyarsk to 94 in Moscow (Rosstat 2016). Unfortunately, while industrial centers need regulating and purifying green infrastructure first and foremost, they lack it most than others.
All of the studied cities are administrative centers of federal subjects of Russia, with most of them being the main drivers of regional economic development. They undoubtedly demonstrate the best practice of urban planning in their regions, but they still face a lot of environmental problems and need a number of measures to improve urban green infrastructure.
To assess the present state of urban green infrastructure, it is basically crucial to develop a system of indicators. Notably, indicators for urban planning should have some standard values to serve as reference when deciding on measures for improvement. It was the basic principle during the selection of indicators in our research. Moreover, indicators should be quite easy to evaluate, interpret and regulate. The aim is to choose comprehensible instruments that can characterize both strong and weak points of urban green infrastructure, indicate the most and the least effective strategy for its enhancement.
Our systemization of indicators bases on the idea that green infrastructure does not only fulfill the citizens'needs, but also supports itself as a system of integrated elements. Thus, we divided all indicators into three groups: those that 1) characterize general green infrastructure availability; 2) support a comfortable urban environment; 3) form a stable integrated system of green infrastructure. The groups and their indicators are present in Table 2.
Table 2. Indicator system for green infrastructure integrated assessment
Group | # | Indicators and units of measurement |
|---|---|---|
1. General green infrastructure availability | 1.1 | Total urban green infrastructure, per cent |
1.2 | Green infrastructure availability, sq. m per capita | |
1.3 | Green infrastructure availability of the least vegetated city district, sq. m per capita | |
1.4 | Difference between urban green infrastructure per capita in the most and the least vegetated city districts, sq. m per capita | |
1.5 | Change of the percentage of total green infrastructure, per cent | |
2. Comfortable urban environment formation | 2.1 | Urban green infrastructure for recreation availability, sq. m per capita |
2.2 | Share of residential area without green infrastructure in the 300-meter buffer, per cent | |
2.3 | Share of residential area without green infrastructure in the 800-meter buffer, per cent | |
3. Green infrastructure sustainability | 3.1 | Tree vegetation in green infrastructure, per cent |
3.2 | Agricultural lands in green infrastructure, per cent | |
3.3 | Green infrastructure fragmentation index | |
3.4 | Urban protected areas, per cent | |
3.5 | Change of tree cover share in green infrastructure2, per cent |
Integrated assessment consists of three stages (fig. 1). Stage one includes the preparation of spatial data for the evaluation. We used materials on tree cover within cities for 2000-2016 (Hansen 2013) and land use categories (from OpenStreetMap (OSM) to define agricultural lands and green areas. The administrative borders for the cities are also taken from corresponding OSM layers. To assess the per capita green infrastructure for recreation, we used the following OSM layers and categories: vegetation (wood), landuse / vegetation (forest, orchard, grass, meadow, vil- lage_green, recreation_ground), landuse (garden, park, allotments, cemetery).

Fig. 1. Three stages of study
To assess how much green infrastructure influences the conditions for urban recreation, the availability of green space within easy walking distance from residential area is measured. A number of works, including (WHO 2016) reports, turn to Accessible Natural Greenspace Standard (ANGSt) (Ma 2016), according to which the accessibility indicator can be assessed at three levels: 5 minutes walk from home - 400 m, 10 minutes - 800 m, 15 minutes - 1200 m (Pauleit 2003). Moreover, ANGSt recommends that citizens should have at least 1 accessible ha of green area within 300 m of residential area, 20 ha within 2000 m, 100 ha within 5000 m, and 500 ha within 10000 m (Handley 2003). In our study we use 300 and 800 m buffers.
The most common parameters to fragmentation measurement are the number of patches, patch density (patches per 100 ha), mean patch size, total edge length, edge density (the sum of all green elements' edges, divided by total urban area - m/ha), total core area and percentage of core area (the one that is not influenced by edge effect) and Euclidean nearest neighbor distance (the shortest distance between close patches) (McGarigal 2014). Fragmentation parameters were evaluated in Fragstats by inputting Hansen tree cover rasters with 30 meter spatial resolution and using six operations from «class metrics» block: Edge Density (ED), Largest Patch Index (LPI), Patch Density (PD), Number of Patches (NP), Total Core Area (TCA), Euclidean Nearest Neighbor Distance (ENN). For the «background value» we assigned the class of non-tree vegetation of a classified raster image. To do so, we input a special matrix into Fragstats, so that a value of pixels with tree vegetation would be considered true and non-tree vegetation - false. We also verified the results by doing the same operation with NDVI classified images that we created from Landsat 5, 7 and 8 images for 2000 and 2016. Four classes were defined: water surface; unvegetated surface, sparse vegetation cover and dense vegetation cover. The first class includes NDVI values below 0; the second class - up to 0,2; the third - up to 0.35; and the last one consists of all higher values. The edge depth defines the distance of edge effect and consequently the size of core area, so we took 120 meters for this parameter and created a matrix for the operation as well.
On stage two we assessed the indicators. To evaluate per capita ones, we used the official statistical data on urban population. The summed values of indicators for the cities were later ranked from 1 to 15. The same operation was done separately for the first, second and third groups of indicators. Fragmentation index is also a result of ranking cities by six Fragstats parameters we have described earlier. Their values were summed and then ranked again. As a result, the maximum value of fragmentation index is 15, and the minimum is 1.
Stage three is a final integrated assessment of urban green infrastructure, based on all chosen indicators, and the following normalization of its values.
Table 3 shows variabilities for 15 cities.
First group indicators. The highest percentage of total green infrastructure (#1.1) is found in Perm and Moscow, while Saint Petersburg, Volgograd and Samara the lowest total share of green areas. As to the per capita green infrastructure (#1.2), the best results are discovered in Volgograd and Ufa, and the worst in Saint Petersburg. Per capita green infrastructure of the least vegetated city district (#1.3) is another per capita indicator that, unlike the previous one, characterizes the spatial homogeneity of green infrastructure. Thus, the least vegetated districts of Saint Petersburg, Moscow and Volgograd are the worst among other cities, while the best are in Novosibirsk, Kazan and Perm. The difference between urban green infrastructure per capita in the most and the least vegetated city districts (#1.4) is especially high in Moscow, Saint Petersburg and Samara, and less significant in Rostov-on-Don and Omsk. The change of the percentage of total green infrastructure (#1.5) is the last «general» indicator, that has shown the most distinctive decrease of green area in Saint Petersburg, and a particularly big increase in Nizhny Novgorod and Novosibirsk.
Second group indicators. Per capita urban green infrastructure for recreation (#2.1) is the highest in Perm and Voronezh, and the lowest in Rostov-on-Don and Omsk. The largest share of residential area without green infrastructure in the 300-meter buffer (#2.2) is found in Volgograd and Ekaterinburg, while Chelyabinsk and Omsk have the best accessibility to urban green areas. As to the availability of green infrastructure in the 800-meter buffer (#2.3), the most provided cities are Saint Petersburg, Ekaterinburg, Moscow and Kazan, and the least ones are Rostov-na-Dony and Ufa.
Third group indicators. Tree vegetation takes the largest part of urban green infrastructure (#3.1) in Perm and Voronezh, while in Chelyabinsk, Omsk and Volgograd green area mostly consists of non-tree vegetation. Agricultural lands occupy the most significant share of urban area (#3.2) in Volgograd, Saint Petersburg and Kazan, and the smallest percentage in Krasnoyarsk and Novosibirsk. Green infrastructure fragmentation index (#3.3) is maximum in Samara and Kazan, and minimum in Saint Petersburg. As to the urban protected areas (#3.4), their share is distinctively high in Chelyabinsk and Voronezh, but quite low in Krasnoyarsk and Omsk. In most cases, the change of tree cover is insignificant. However, the positive dynamics in Voronezh and Samara, and the negative one in Ekaterinburg are worth mentioning.
Table 3. Statistics of the variables for 15 cities
# | Maximum value | Minimum value | Mean value | Variance ratio |
|---|---|---|---|---|
1.1 | 73 | 36 | 53.6 | 1.98 |
1.2 | 466 | 137 | 247.87 | 45.72 |
1.3 | 59 | 1 | 17.13 | 17.00 |
1.4 | 5123 | 47 | 800.20 | 2066.39 |
1.5 | 11.6 | -11.7 | 2.34 | 14.69 |
2.1 | 406 | 33 | 131.07 | 73.49 |
2.2 | 74 | 25 | 46.20 | 3.91 |
2.3 | 33 | 2 | 9.60 | 7.65 |
3.1 | 62 | 12 | 34.9 | 5.48 |
3.2 | 24.5 | 0.2 | 6.40 | 9.48 |
3.3 | 61 | 20 | 48.00 | 1.90 |
3.4 | 30 | 0.3 | 8.68 | 7.93 |
3.5 | 8.7 | -1.8 | 0.70 | 12.44 |
The variance ratio reflects the gaps among these cities, which is calculated by dividing the variance by the mean value of each variable. It demonstrates how even or uneven green infrastructure aspects are developed in different cities. As we can see, variation ratio is high for most indicators, particularly for the difference between urban green infrastructure per capita in the most and the least vegetated city districts, meaning that results for this one vary greatly in different cities - while districts in Rostov-on-Don and Omsk are quite evenly vegetated, the situation in Saint Petersburg and Moscow is 100 times worse. On the whole, most cities are vegetated quite differently. In only four cases - total green infrastructure percentage, tree vegetation in green infrastructure percentage and «change» indicators - most cities got results that are relatively close to mean values. Moreover, the mean value of indicator 1.1 shows that most cities have the share of green area above recommended 40%. The same applies to the per capita indicators since there is more than 9 m2 GI per capita in every city. Though, the same cannot be said about the least vegetated districts in Ufa, Saint Petersburg, Kazan, Krasnoyarsk, Moscow, Novosibirsk and Rostov-on-Don, where central parts lack green elements.
As we have mentioned in part two, for every indicator the cities were ranked from 1 to 15. So, a total sum of all indicator-ranks for each city is actually a value of its green infrastructure integrated assessment. Later, we also evaluated the sum of ranking points for each group of indicators separately. Since the number of indicators differs in three groups and thus their summed values cannot be compared, we normalized the results by using the following formula: In = Ix x 100 / Imax, where In is a normalized value, Ix - a sum of ranking points for a city, Imax - a maximum possible sum of ranking points in a group. In case of dynamics indicators (1.5 and 3.5), we give a city 0 points if the change is negative. So, for the first and third group Imax is 63, for the second one - 45.
Normalized values vary between 1 and 100.
Figure 2 demonstrates the relation between general, comfort and integrity indicators. When comparing results of the first two groups («recreational» and «integrity» indicators), we can divide cities into three sub-groups, depending on their interrelation:

Fig. 2. Normalized values of indicators from 3 groups
The first sub-group includes Ufa, Rostov-on-Don, Omsk, Novosibirsk, Nizhny Novgorod and Krasnoyarsk. Chelyabinsk, Perm, Saint Petersburg, Moscow, Voronezh, Kazan and Volgograd belong to the second sub-group, while Ekaterinburg and Samara have approximately equal normalized values of both indicators groups.
Besides getting normalized values for three groups, the same operation was done for all 13 indicators. Thus, the research has revealed that Voronezh, Ekaterinburg and Perm have the most effective and sustainable green infrastructure (Fig. 3). The first two also have the largest share of protected green areas, while the percentage of total green area is one of the highest in the latter. These cities got 65-75 normalized points out of 100, so the quality of their green infrastructure can be described as «good'. In contrast, Saint Petersburg, being a densely built-up city with limited open space, got the worst result. According to the final assessment, the quality of green infrastructure in Krasnoyarsk, a large industrial city, and four cities from the steppe zone (Rostov-on-Don, Samara, Omsk, Novosibirsk) is also unsatisfactory. Their total mark is about 40. Other cities got 50-65 points, and since their marks are above average, the quality of their green infrastructure can be defined as satisfactory.
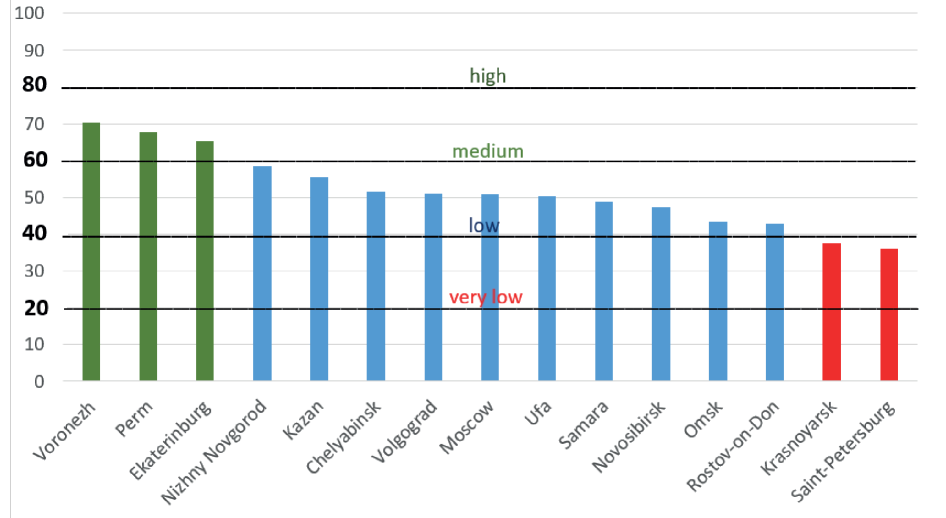
Fig. 3. Normalized values and marks for green infrastructure state
Since our integrated assessment is based on ranking, the final marks do not reveal the results' difference between the cities and we cannot fully comprehend the weight behind the normalized values. When there is a small variance of minimum and maximum values, it does not mean that the city that got 1 point for this indicator has «unsatisfactory» results. For instance, for per capita green infrastructure Volgograd got 15 points and Saint Petersburg - 1. However, the leader's absolute values for this indicator are only 4 times better than the absolute values of the last one, while in some cases (like urban protected areas percentage) the absolute values of the first city can be 30 times better.
Green infrastructure plays a key role in a formation of a comfortable urban environment, but at the same time it is affected by intense processes of urbanization, like surface sealing and active building, transport and industrial activity. However, cities are not only the cause of negative influence, but also the main decision-making centers for green infrastructure improvement.
The development of green infrastructure is a necessary measure for keeping urban sustainability, particularly in the context of the global environment change. Sustainable cities and communities is among the priority UN sustainable development goals (Sustainable Development Goals 2015). Green infrastructure planning is an essential part of urban development policy, as it combines both nature conservation measures and plans for the formation of a comfortable urban environment. The conflict between contradicting environmental and users' approaches is the major problem of urban nature protection, that is especially keen in large cities.
The Russian national program «Housing and urban environment» (2019) includes 36 indicators, but only six of them describe green infrastructure: 1) the percentage of public green area, 2) total share of urban green area, 3) the state of green area, 4) attractiveness of green area, 5) the variety of services of green area, 6) the percentage of population with access to public green area. However, most of these indicators do not describe spatial heterogeneity and GI sustainability.
Our research on 15 cities gives an integrated method of green infrastructure assessment, which offers two main contributions.
The first one is a tested integrated system of 13 indicators for the current state and quality of urban green infrastructure. Among other common «traditional» indicators like the percentage of total green area and total green area per capita, we also take into account the spatial differences of green infrastructure and consider tree vegetation more valuable in the context of ecosystem services. In our study we used data from both open source geoportals and official statistics base, that guarantees its consistency. Obviously, the suggested method is not perfect. The full assessment of green infrastructure quality requires a big variety of data sources, many of which are not available for all 15 cities at the moment. At the same time, the method we suggest is relatively simple in evaluation and use, and can be applied for cities in other countries as well.
The second contribution is a method, that allows to combine two blocks of green infrastructure indicators - the ones characterizing the influence on the urban environment, and those defining the integrity of green infrastructure - in one assessment. Today, the integrated multifunctional approach to green space organization should be considered the best urban planning practice. However, in most cases there are still quite a few natural areas within the city borders in Russia that actually continue to exist as self-sustaining ecosystems. Sometimes, this phenomenon is found in some other cities, particularly in Africa and South America: Rio-de-Janeiro (Illarionova 2018), Dar-es-Sa- laam (Lindley 2015), Caracas (Werner 2011). Our method offers a convenient way to assess whether measures directed at the formation of a comfortable urban environment are developed proportionally to the measures for green infrastructure sustainability improvement.
By assessing the change of green area in 15 largest cities in 2000 and 2016, we reveal that was insignificant (under 3%), with the most noticeable decrease concerning non-tree vegetation that covers former agricultural lands on the outskirts and wastelands in central districts. A positive aspect of this result is a conclusion that forest area remains relatively stable and does not shrink under the cities' growth. There are, though, a few cases of local forest cutting in some areas, for instance in Saint Petersburg.
We did not discover, though, a direct correlation between the sustainability of urban green infrastructure and nature zones or industrial activity. One should expect in «arid» cities a higher mark for socially significant «recreational» indicators since green infrastructure is meant to mitigate the effects of the harsh environment, while natural fragmentation should lower the marks of «integrity» indicators there. This contradiction, found in all cities of steppe zones (excluding Voronezh), only proves that green infrastructure development is not sufficient there.
Moscow, Saint Petersburg and Krasnoyarsk, even being in an auspicious forest zone with favorable conditions for vegetation, got low marks for integrity indicators, meaning that their green infrastructure is especially vulnerable. Satisfactory marks for both recreational and integrity indicators have Ufa, Perm, Nizhny Novgorod, Kazan, Ekaterinburg and Voronezh.
The most cities of steppe zone with unfavorable environmental conditions indeed belong to the group with a low-qual- ity green infrastructure. Moreover, industrial cities like Ekaterinburg, Perm and Nizhny Novgorod do not always get the worst results, meaning an effective local urban planning policy and intense measures for improvement.
Not all indicators involved can help realize a better urban green infrastructure, but they still provide a reference point for making specific regulations to control human activity and improve eco-environment management.
In this research, we used an integrated method to assess the current state of green infrastructure in 15 Russian most populated cities. The major contributions and conclusions can be summarized as follows.
We offered a system of 13 indicators to assess green infrastructure quality that includes two sub-systems to characterize 1) the influence of green areas on the comfort of urban environment, and 2) the integrity of green space as an interconnected ecosystem.
Besides two sub-systems that characterize the indicators' assessment focus (social or environmental), we marked out «general» and «special» indicators: the common ones that are often used in reports on urban planning, but actually show an average picture of the situation; and those that are less «popular», but allow to assess spatial distribution and homogeneity. We divided cities into three sub-groups, depending on the interrelation between 'sustainability' and 'recreational' indicators. That way we found out that six cities have green infrastructure that lacks recreational functions, while green areas in six other cities is most vulnerable.
Thus, cities that got the lowest marks (below 50) for integrity indicators should dedicate more attention to the restoration and improvement measures to reduce fragmentation. In contrast, cities, ranking last in the assessment of green infrastructure mitigating effects, are better to review their urban planning strategies to achieve an optimal spatial distribution of green areas and a comfortable urban environment.
1. Ahern J. (2013). Urban landscape sustainability and resilience: The promise and challenges of integrating ecology with urban planning and design. Landscape Ecology, 28(6), 1203-1212. DOI: 10.1007%2Fs10980-012-9799-z.
2. Ahmad A. (2014). Temporal changes in urban green space based on normalized difference vegetation index. Applied Mathematical Sciences, 8(55), 2743-2751. DOI: 10.12988/ams.2014.432230.
3. Alberti M. (2008). Advances in urban ecology. Integrating humans and ecological processes in urban ecosystems. New York: Springer.
4. Andersson E. and Bodin Ö. (2008). Practical tool for landscape planning? An empirical investigation of network based models of habitat fragmentation. Ecography, 32(1), 123-132. DOI: 10.1111/j.1600-0587.2008.05435.x.
5. Annerstedt van den Bosch M., Mudu P, Uscila V., Barrdahl M., Kulinkina A., Staatsen B., Swart W., Kruize H., Zurlyte I. and Egorov A.I. (2016). Development of an urban green space indicator and the public health rationale. Scandinavian Journal of Public Health, 44, 159-167. DOI: 10.1177/1403494815615444.
6. Austin G. (2014). Green Infrastructure for landscape planning: Integrating human and natural systems. New York: Routledge Press.
7. Bell S. and Morse S. (2008). Sustainability indicators: Measuring the immeasurable? Earthscan, London: Sterling.
8. Benedict M.A. and McMahon E.T. (2012). Green infrastructure: Linking landscapes and communities. Chicago: Island Press.
9. Chen X. (2002). Relationships among phenological growing season, time–integrated normalized difference vegetation index and climate forcing in the temperate region of Eastern China. International Journal of Climatology: A Journal of the Royal Meteorological Society, 22 (14), 1781-1792. DOI: 10.1002/joc.823.
10. Chen B. and Wang R. (2014). Integrated ecological indicators for sustainable urban ecosystem evaluation and management. Ecological Indicators, 47, 1-4. DOI: 10.1016/j.ecolind.2014.09.020.
11. Cheng L., Li F. and Deng H.F. (2011). Dynamic of land use and its ecosystem services in China’s megacities. Acta Ecologica Sinica, 31(20), 6194-6203.
12. Dobbs R. (2011). Urban world: mapping the economic power of cities. New York: McKinsley Global Institute.
13. Ekkel E.D. and de Vries S. (2017). Nearby green space and human health: evaluating accessibility metrics. Landscape and Urban Planning, 157, 214-220. DOI: 10.1016/j.landurbplan.2016.06.008.
14. Environmental European Agency (EEA) (2017). Indicators for urban green infrastructure. [online] Environmental European Agency. Available at: www.eea.europa.eu/themes/sustainability-transitions/urban-environment/urban-green-infrastructure/indicators_for_urban-greeninfrastructure [Accessed 1 Sep. 2019].
15. Fang H. (2014). Leaf area index models. Reference Module in Earth Systems and Environmental Sciences, 1-11.
16. Forman R. (2015). Urban ecology: science of cities. Cambridge: Cambridge University Press.
17. Gomez F., Jabaloyes J., Montero L., De Vicente V. and Valcuende M. (2011). Green areas, the most significant indicator of the sustainability of cities: research on their utility for urban planning. Urban Planning Development, 311, 311-328. DOI: 10.1061/(ASCE)UP.1943-5444.0000060.
18. Gill S.E., Handley J.F., Ennos A.R. and Pauleit S. (2007). Adapting cities to climate change: the role of the green infrastructure. Built Environment, 33(1), 115-133. DOI: 10.2148/benv.33.1.115.
19. Green Infrastructure and Territorial Cohesion. (2011). Technical Report EEA. [online]. Available at: www.eea.europa.eu/publications/greeninfrastructure-and-territorial-cohesion. [Accessed 1 Sep. 2019].
20. Handley J. (2003). Providing accessible natural green space in towns and cities: a practical guide to assessing the resource and implementing local standards for provision. London: Countryside Council for Wales.
21. Hansen R. (2017). Urban green infrastructure planning: a guide for practitioners. Copenhagen: University of Copenhagen.
22. Hansen R. and Pauleit S. (2014). From multifunctionality to multiple ecosystem services? A conceptual framework for multifunctionality in green infrastructure planning for urban areas. Ambio, 43, 516-529. DOI: 10.1007/s13280-014-0510-2.
23. Hansen M.C. (2013). High-resolution global maps of 21st-century forest cover change. Science, 342, 850-853. DOI: 10.1126/science.1244693.
24. Huang C. (2017). Green spaces as an indicator of urban health: evaluating its changes in 28 mega-cities. Remote Sensing, 9, 12. DOI: 2072- 4292/9/12/1266.
25. Huang H., Chen Y., Clinton N., Wang J., Wang X., Liu C., Gong P., Yang J., Bai Y., Zheng Y. and Zhu Z. (2017). Mapping major land cover dynamics in Beijing using all Landsat images in Google Earth Engine. Remote Sensing of Environment, 202, 166-176. DOI: 10.1016/j.rse.2017.02.021.
26. Illarionova O. (2018). Transformation of green infrastructure in large cities of South America. Vestnik Moskovskogo Universiteta, 5(3), 23-29 (in Russian). Available at: www.vestnik5.geogr.msu.ru/jour/article/view/414 [Accessed 1 Sep. 2019].
27. Institute of Urban Economics (2015). Ranking of Russian Central Cities. [online] Available at: http://www.urbaneconomics.ru/centrobshchestvennyh-svyazey/news/reyting-stolichnyh-gorodov-rossii-ot-fonda-institut-ekonomiki (in Russian) [Accessed 1 Sep. 2019].
28. Kabisch N. and Haase D. (2013). Green spaces of European cities revisited for 1990–2006. Landscape and Urban Planning, 110, 113-122. DOI: 10.1016/j.landurbplan.2012.10.017.
29. Klimanova O. (2018). Impacts of urbanization on green infrastructure ecosystem services: the case study of post-soviet Moscow. Belgeo. Revue belge de géographie, 4. Available at: www.journals.openedition.org/belgeo/30889 [Accessed 1 Sep. 2019]. DOI: 10.4000/belgeo.30889.
30. Kötter T. and Friesecke F. (2009). Developing urban indicators for managing mega cities. Land governance in support of the MDGs: Responding to New Challenges, 4-21.
31. Lafortezza R., Davies C., Sanesi G. and Konijnendijk C.C. (2013). Green infrastructure as a tool to support spatial planning in European urban regions. iForest-Biogeosciences and Forestry, 6, 102-108. DOI: 10.3832/ifor0723-006.
32. Li X., Gong, P. and Liang L. (2015). A 30-Year (1984–2013) record of annual urban dynamics of Beijing city derived from Landsat data. Remote Sensing of Environment, 166, 78-90. DOI: 10.1016/j.rse.2015.06.007.
33. Lindley S. (2015). Green infrastructure for climate adaptation in African cities. Urban vulnerability and climate change in Africa. Springer International Publishing.
34. Ma J. (2016). Green infrastructure and urban liveability: Measuring accessibility and equity. Doctoral dissertation. [online]. Available at: www. researchspace.auckland.ac.nz/handle/2292/31220 [Accessed 1 Sep. 2019].
35. McGarigal K. (2014). FRAGSTATS Help. Documentation for FRAGSTATS, 4. Mell I. (2009). Can green infrastructure promote urban sustainability? Proceedings of the Institution of Civil Engineers – Engineering Sustainability, 162(1), 23-34. DOI: 10.1680/ensu.2009.162.1.23.
36. Ministry of Housing and Urban-Rural Development of the People’s Republic of China. MOHURD. (2010). Eco-City Implementation Guideline for Green Building. Beijing.
37. Naumann S. (2011). Design, Implementation and Cost Elements of Green Infrastructure Projects. Final report of European Commission. [online]. Available at: www.ec.europa.eu/environment/enveco/biodiversity/pdf/GI_DICE_FinalReport.pdf. [Accessed 1 Sep. 2019].
38. Niemeijer D. and de Groot R.S. (2008). A conceptual framework for selecting environmental indicator sets. Ecological Indicators, 8, 14-25. DOI: 10.1016/j.ecolind.2006.11.012.
39. Pakzad P. and Osmond P. (2016). Developing a sustainability indicator set for measuring green infrastructure performance. Procedia, Social and Behavioral Sciences, 216, 68-79. DOI: 10.1016/j.sbspro.2015.12.009
40. Pauleit S. (2003). Promoting the natural green structure of towns and cities: English nature’s accessible natural greenspace standards model. Built Environment, 29(2), 157-170. DOI: 10.13140/RG.2.1.2343.1121. Russian Federal State Statistics Service.
41. Rosstat. (2016). Environment. [online]. Available at: www.gks.ru/wps/wcm/connect/rosstat_main/rosstat/ru/statistics/environment/ [Accessed 1 Sep. 2019].
42. Sanitary Regulations and Standards (2003). SANPIN 2.2.1/2.1.1.1200-03 Sanitary Protection Zones and Sanitary Classification of Industrial, Residential and Other Objects. Moscow: Standartinform.
43. Shavnin S.A. (2011). Spatial structure of urban forest ecosystems as an indicator of their sustainability. Izvestiya OGAU, 29(1), 12-16.
44. Sustainable Development Goals (2015). Transforming Our World. General Assembly. [online] Available at: www.unfpa.org/resources/ transforming-our-world-2030-agenda-sustainable-development. [Accessed 1 Sep. 2019].
45. Werner P. (2011). The ecology of urban areas and their functions for species diversity. Landscape and Ecological Engineering, 7(2), 231-240. DOI: 10.1007/s11355-011-0153-4.
46. World Health Organization (WHO) (2016). Urban Green Spaces and Health: A Review of Evidence; World Health Organization: Geneva, Switzerland. [online] Available at: www.euro.who.int/en/health-topics/environment-and-health/urban-health/publications/2016/urban-greenspaces-and-health-a-review-of-evidence-2016 [Accessed 1 Sep. 2019].
47. Yang J., Huang C., Zhang Z. and Wang L. (2014). The temporal trend of urban green coverage in major Chinese cities between 1990 and 2010. Urban Forestry & Urban Greening, 13(1), 19-27. DOI: 10.1016/j.ufug.2013.10.002.
48. Zeng C., Deng X., Xu Sh., Wang Y. and Cui J. (2016). An integrated approach for assessing the urban ecosystem health of megacities in China. Cities, 53, 110-119. DOI: 0.1016/j.cities.2016.01.010.
Klimanova O.A., Illarionova O.I. Green infrastructure indicators for urban planning: applying the integrated approach for Russian largest cities. GEOGRAPHY, ENVIRONMENT, SUSTAINABILITY. 2020;13(1):251-259. https://doi.org/10.24057/2071-9388-2019-123

Editor-in-Chief
Kasimov Nikolay S.Lomonosov Moscow State University
Moscow 119991 Russia, Leninskie Gory, Faculty of Geography, 1806a
Phone +7 495 939-15-52
E-mail: ges-journal@geogr.msu.ru


