


Contents
Scroll to:
https://doi.org/10.24057/2071-9388-2019-65
Scroll to:
Terekhina N.V., Ufimtseva M.D. Leaves of trees and shrubs as bioindicators of air pollution by particulate matter in Saint Petersburg. GEOGRAPHY, ENVIRONMENT, SUSTAINABILITY. 2020;13(1):224-232. https://doi.org/10.24057/2071-9388-2019-65
The growth of urbanization is accompanied by an increase in atmospheric air pollution, the source of which is thermal power plants, industrial enterprises and, often to a greater extent, emissions of motor vehicles. This is especially pronounced in countries where the control and management of environmental impact processes are at a low level. Air pollution negatively affects public health, thereby worsening the socio-economic situation in cities (Ghio et al. 2001).
In St. Petersburg over the past 30 years, especially since 2009, the emissions of pollutants into the atmospheric air have significantly increased, which was accompanied by an increase in the incidence of the population. The Central District, characterized by a high density of urban development and large road traffic flows, has the highest non-carcinogen- ic risk index for the period 2010-2015 among all districts of the city (Movchan et al. 2018). The negative influence of particulate pollution on public health and on the urban trees considered in the article Beckett K.P et al. (1998). For the assessment and monitoring of air pollution in St. Petersburg, there is an automated system that includes 25 automatic stations (3 of them are in Central District), 2 stationary observation posts, and 3 mobile laboratories. The stations are located in all 18 administrative districts of St. Petersburg, providing daily information on the level of air pollution in the city. Recorded data for a number of chemical compounds: CO, NO, NO2, SO2, O3, PM10 - particulate matter with a diameter of less than 10 microns, PM2.5 - particulate matter with a diameter of less than 2.5 microns. The average annual concentration of PM10 in the central part of the city over the past 10 years had declined from 1.1 to 0.2 MPC - maximum permissible concentration of pollutants in the air of populated areas (GN 2.1.6.2604-10); the maximum single concentrations of PM10 vary from 2.1 to 1.0 MPC (Ecological portal of St. Petersburg 2019). More detailed information on the quality and quantity of particulate matter is not available.
Indirect assessment of air pollution is obtained by measuring the amount of pollutants in the snow cover. In the works of Nesterov EM et al. (2009), Vorontsova A.V., Nesterov E.M. (2012), Vorontsova A.V. (2013), Yufereva L.M. (2013) it is shown that the high concentrations of chemical elements (Zn, Cu, Fe, V), which are accumulated in the snow cover of the Central District, do not exceed the MPC for chemicals in the water of water bodies for drinking and cultural and domestic water use. It is also noted that in winter the atmospheric air is cleaner.
The shortcomings of the available methods for assessing the degree of atmospheric pollution make us look for other approaches. Phytoindication is one of such methods that allows obtaining information on the qualitative characteristics and chemical composition of particles deposited on the surface of plant leaves (Tomasevic et al. 2005; S^bo et al. 2012; Nowak et al. 2013; Yang et al. 2015). To do this, samples of leaves are divided into two parts, one of which is washed. The difference in the concentrations of chemical elements in unwashed and washed leaves will show what part of them was deposited on the surface of the leaves. We chose this method, despite the fact that it has a number of difficulties in application. Overview of problems related with interaction between urban vegetation and particle air pollution is presented in article by Janhall S. (2015). In particular, there are different ways to wash leaves: mechanical cleaning, washing through solvents, weak acid solutions, but also sample washing with distilled water (Ugolini et al. 2013). Previous studies have shown that these approaches may give different results (Alfani 1996; Aksoy et al. 1997; Palmieri et al. 2005; Tomasevic et al. 2005; De Nicola et al. 2008; Dzierzanowski et al. 2011). The washing procedure prior to chemical analysis is a critical point in biomonitoring studies, since removal of particles from a leaf surface strongly depends on the washing treatment and its duration (Tomasevic et al. 2011). Another problem with the use of this method is that differences in the accumulation of pollutants are determined by the structure of the leaf surface of different plant species, leaf area, and their life cycle (evergreen or deciduous plants) (Popek et al. 2013; Ugolini et al. 2013). Anicic M. et al. (2011) note the elements content in the leaves does not reflect atmospheric deposition directly. However, many scientists recommend using urban woody plants for phytoindication and remediation (Janhall 2015; Yang et al. 2015; Bargagli et al. 2019).
Our previous data (Ufimtseva, Terekhina 2014, 2017) give an idea of soil and plant contamination in the district, but do not reflect the contribution of atmospheric pollutants, therefore the goal of this study are to find out what proportion of air pollutants is included in the structure of leaves of different trees and shrubs, and which is deposited on their surface; also which species should be used to assess the quality of the urban environment, and which ones should be recommended for the creation of protective green spaces.
Objects of research in the Central District of St. Petersburg are the tree species widely used in city landscaping: Tilia cor- data (10 samples), Populus sp. (4), as well as less common trees and shrubs: Quercus robur (1), Ulmus laevis (2), Syringa vulgaris (1), Cotoneaster lucidus (1), Berberis vulgaris (1), Syrin- ga josikaea (1), Rosa rugosa ( 1 sample). In total, 22 samples of urban plants were studied. Shrubs grew on the Field of Mars (Marsovo Polye), woody plants grew in different types of urban planting: gardens, parks, street plantings. Sampling was carried out in August 2006, when for a long time there was no rain. Medium samples of leaves without petioles were taken, at a height of 1-2 m from the soil surface along the entire perimeter of crowns from 3-5 neighboring trees or shrubs. Samples were divided into 2 parts, one part was washed in in running tap water for 10 s. We assume that a certain amount of substances can be washed out of leaf tissues when washing, but we hope that these are not significant values. Then the samples were placed in paper bags with labels and dried to air dry condition.
Primary sample preparation of plant samples was carried out according to generally accepted methods (Guidelines 1972). Ashing of plant samples was carried out by the dry method in a muffle furnace at a temperature of 400-450 ° C. The ash content was calculated using the formula: % ash = (M / p) * 100, where M - the weight of the ash, g; p - the weight of the sample of dry matter, g.
The determination of the chemical composition of the plant ash was carried out in the spectral analysis laboratory of the Russian Geological Research Institute (VSEGEI) by the atomic emission method with inductively coupled plasma (ICP AES) for the following elements: Fe, Mn, Cu, Zn, Pb, Ni, Cr, Co, Cd, Ba, Sr.
The results of spectral analyzes were processed statistically. The indicators of washout for each element were calculated: the difference between the content of the element in unwashed and washed leaves, expressed as a percentage of the weight of unwashed leaves. Also, the washout index was calculated for the content of ash substances in the leaves. Comparing heavy metal contents of washed and unwashed plants, a paired t-test was performed in order to determine significance of difference between them. To characterize the intensity of accumulation of chemical elements by plants and the intensity of transport and industrial pollution of the studied areas, a concentration coefficient (Kk) was calculated representing the ratio of the chemical element content in a plant growing in the studied area to its content in plants of background conditions. As a in regional background residential habitats for Tilia cordata, 4 samples were taken in small settlements of the Leningrad Region; for other species, the average values of the chemical elements were calculated using our previously obtained data on the chemical composition of the leaves of trees in the background habitats and literature data (Paribok et all. 1982; Ufimtseva, Terekhina 2005; Drozdova et al. 2015).
The total indicator of pollution, commonly used to assess the state of the soil (Saet et al. 1988), was calculated: Zc = ΣKk / (n-1), where n - the number of elements for which Kk> 1, and included in the calculation.
Data were processed by using the software Statistica. Difference on heavy metals deposition between washed and unwashed leaves within each site assessed by t-test for independent samples. Descriptive statistics calculated using Microsoft Excel.
Values of ash content and concentrations of chemical elements in leaves of Tilia cordata from Central District of St. Petersburg and background places are presented in table 1.
Table 1. Concentrations of chemical elements μg*g−1 of dry matter) and ach content (%) in unwashed and washed leaves of Tilia cordata from Central District of St. Petersburg and from background places in Leningrad region.
№ | ash, % | Fe | Mn | Cr | Ni | Cu | Zn | Pb | Cd | Sr | Ba | Co |
|---|---|---|---|---|---|---|---|---|---|---|---|---|
Tilia cordata in city, unwashed leaves | ||||||||||||
1 | 9.37 | 1098.27 | 49.01 | 4.54 | 1.70 | 13.59 | 31.78 | 5.55 | 0.06 | 53.44 | 40.27 | 0.49 |
2 | 10.32 | 1577.20 | 48.87 | 5.39 | 1.96 | 16.28 | 39.92 | 6.45 | 0.07 | 52.57 | 41.75 | 0.76 |
3 | 12.32 | 3040.68 | 63.91 | 7.73 | 2.83 | 24.63 | 79.07 | 9.93 | 0.14 | 47.54 | 51.36 | 1.77 |
4 | 9.26 | 1431.02 | 40.87 | 4.18 | 1.76 | 14.63 | 40.27 | 5.93 | 0.09 | 32.96 | 28.42 | 0.69 |
5 | 8.93 | 1130.73 | 26.98 | 2.93 | 1.46 | 13.22 | 36.98 | 5.48 | 0.10 | 39.12 | 30.19 | 0.54 |
6 | 12.47 | 3653.77 | 64.70 | 5.42 | 2.71 | 25.68 | 62.34 | 13.84 | 0.08 | 32.54 | 57.48 | 1.58 |
7 | 16.03 | 4203.73 | 85.65 | 8.13 | 5.08 | 25.48 | 98.09 | 15.74 | 0.23 | 52.41 | 72.77 | 2.24 |
8 | 11.59 | 1466.63 | 32.30 | 4.39 | 2.79 | 14.25 | 39.97 | 7.88 | 0.12 | 49.93 | 34.87 | 0.77 |
9 | 6.88 | 437.94 | 31.98 | 1.73 | 1.53 | 8.88 | 21.06 | 2.91 | 0.06 | 47.07 | 22.16 | 0.20 |
10 | 14.74 | 3061.78 | 52.51 | 5.87 | 3.01 | 21.08 | 87.41 | 10.08 | 0.10 | 45.69 | 59.11 | 1.62 |
average | 11.19 | 2110.18 | 49.68 | 5.03 | 2.48 | 17.77 | 53.69 | 8.38 | 0.11 | 45.33 | 43.84 | 1.07 |
SD | 2.80 | 1268.25 | 18.07 | 1.96 | 1.09 | 5.98 | 26.27 | 4.02 | 0.05 | 7.84 | 16.00 | 0.68 |
Tilia cordata in city, washed leaves | ||||||||||||
1 | 8.53 | 298.42 | 33.05 | 1.72 | 0.83 | 8.70 | 17.66 | 2.59 | 0.05 | 44.12 | 23.47 | 0.15 |
2 | 8.94 | 350.02 | 22.15 | 1.87 | 0.72 | 7.54 | 21.72 | 2.96 | 0.04 | 43.70 | 15.37 | 0.18 |
3 | 8.40 | 352.34 | 18.86 | 1.91 | 0.54 | 7.00 | 19.98 | 2.54 | 0.03 | 31.07 | 9.49 | 0.19 |
4 | 7.60 | 403.91 | 21.78 | 1.71 | 0.78 | 8.59 | 24.85 | 2.96 | 0.08 | 27.36 | 12.54 | 0.19 |
5 | 8.20 | 321.10 | 20.32 | 1.41 | 0.93 | 10.74 | 28.53 | 2.83 | 0.06 | 60.01 | 18.94 | 0.13 |
6 | 8.74 | 384.89 | 17.59 | 1.83 | 0.68 | 9.08 | 21.14 | 2.94 | 0.03 | 27.87 | 10.92 | 0.23 |
7 | 10.18 | 398.60 | 29.95 | 1.68 | 1.07 | 7.62 | 25.44 | 3.08 | 0.05 | 38.27 | 11.09 | 0.22 |
8 | 10.04 | 245.71 | 17.88 | 1.47 | 0.86 | 7.54 | 21.98 | 4.64 | 0.11 | 61.63 | 18.27 | 0.15 |
9 | 6.90 | 188.22 | 33.14 | 1.20 | 1.02 | 7.80 | 17.25 | 1.99 | 0.06 | 49.89 | 17.46 | 0.08 |
10 | 9.95 | 452.42 | 20.81 | 1.58 | 0.77 | 7.37 | 26.77 | 3.01 | 0.04 | 43.79 | 14.23 | 0.23 |
average | 8.75 | 339.56 | 23.55 | 1.64 | 0.82 | 8.20 | 22.53 | 2.95 | 0.06 | 42.77 | 15.18 | 0.18 |
SD | 1.07 | 79.19 | 6.11 | 0.23 | 0.16 | 1.11 | 3.78 | 0.68 | 0.02 | 12.13 | 4.38 | 0.05 |
Tilia cordata in country, unwashed leaves | ||||||||||||
11 | 7.53 | 110.56 | 69.96 | 1.16 | 0.73 | 4.37 | 14.75 | 1.69 | 0.04 | 20.70 | 13.40 | 0.10 |
12 | 8.32 | 372.41 | 238.42 | 0.78 | 1.62 | 6.17 | 15.23 | 2.09 | 0.06 | 44.26 | 57.66 | 0.20 |
13 | 6.41 | 250.88 | 74.42 | 0.94 | 0.95 | 5.09 | 21.52 | 2.34 | 0.02 | 35.36 | 63.29 | 0.12 |
14 | 8.12 | 221.59 | 660.64 | 0.70 | 3.56 | 8.77 | 19.17 | 1.65 | 0.05 | 72.30 | 53.05 | 0.14 |
average | 7.59 | 238.86 | 260.86 | 0.89 | 1.71 | 6.10 | 17.67 | 1.94 | 0.04 | 43.16 | 46.85 | 0.14 |
Tilia cordata in country, washed leaves | ||||||||||||
11 | 7.51 | 89.30 | 75.62 | 1.26 | 0.87 | 4.87 | 15.10 | 1.46 | 0.06 | 19.98 | 14.72 | 0.11 |
12 | 7.53 | 121.08 | 221.52 | 0.53 | 1.29 | 5.55 | 12.65 | 1.60 | 0.04 | 42.60 | 42.60 | 0.09 |
13 | 6.00 | 75.52 | 78.98 | 0.67 | 0.50 | 5.20 | 20.88 | 1.12 | 0.03 | 43.13 | 71.57 | 0.09 |
14 | 6.69 | 149.80 | 648.00 | 0.58 | 3.34 | 7.63 | 17.60 | 1.38 | 0.07 | 78.98 | 54.55 | 0.10 |
average | 6.93 | 108.93 | 256.03 | 0.76 | 1.50 | 5.81 | 16.56 | 1.39 | 0.05 | 46.17 | 45.86 | 0.10 |
Notes. Addresses of sampling points: I - Tavricheskiy Sad, center, 2 - The middle edge of Tavricheskiy Sad along Kirochnaya St., 3 - Preobrazhenskaya Square, 4 - Klenovaya St., the alley on the left when driving from Inzhenernaya St., outer side, 5 - the same place, inside, 6 - Garden of the Winter Palace, roadside, 7 - Embankment of the Obvodny Canal, 7A, 8 - Mitropolichiy Sad, 9 - the same place, 10 - Novgorodskaya St., I
Ash content as an indicator of the content of inorganic leaves in leaves varies from 6.88 to 16.03% for unwashed leaves and from 6.9 to 10.18% for washed leaves of city lindens. Moreover, the minimum values of both washed and unwashed leaves belong to sample № 9 taken from a healthy tree in Mi- tropolichiy garden, protected from highways by buildings. The maximum values of ash content for washed and unwashed leaves belong to sample № 7, taken on Embankment of the Obvodny Canal, geographically not very remote from the Mi- tropolichiy garden, but subject to heavy traffic load. In the first case, the difference between washed and unwashed leaves is not significant, and in the second it is 5.85% - almost a third of the ash content of unwashed leaves. The difference between the ash content of unwashed and washed leaves of city lindens is on average 2.44%, for leaves of background linens - 0.66%, which indicates the presence of a significant amount of ash substances on the surface of the leaves of plants in the city. There is not much information in the literature about changes in the ash content when working with washed and unwashed leaves. The article of Aksenova Yu.E. (2017) provides data for poplar in Tomsk (11 samples): the value of ash content for unwashed leaves varies from 14.07 to 26.6%, for washed leaves is 12.88-18.87%. The difference between the mean values is 2.58%, which corresponds with our data.
The average values of the content of chemical elements in the leaves of Tilia cordata presented in fig. 1, they show the highest concentrations for Fe, Mn, Zn, Cu. The amount of such biophilic element as Mn in leaves of background conditions is higher than in urban areas, while all other elements in urban plants are higher than in background ones, which indicates a violation of the zonal biological circulation of trace elements due to anthropogenic effects. Paired t-test demonstrated significance of difference between washed and unwashed leaves for all investigated elements excluded Sr. For a number of chemical elements (Ni, Cu, Zn, Pb) the results are similar to the data for Nevsky Prospect (Slepyan, 1997). Our data are consistent with data by unwashed and washed leaves of Tilia tomentosa in Cracow (Czaja et al. 2014), and Tilia platyphyllos from south-west Poland (Piczak et al. 2003), but significantly superior data by Tilia cordata for Huszlew and Lyublin (Chwil et al. 2015).
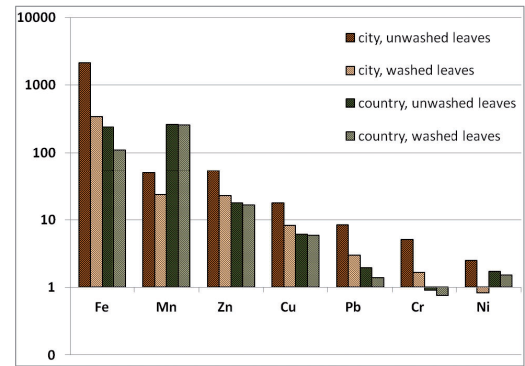
Fig. 1. Average values of the content of chemical elements in the leaves of Tilia cordata in urban and background habitats (mg / kg of dry matter; logarithmic scale)
Washout - the difference between the concentrations of chemical elements of unwashed and washed leaves of Tilia cordata, expressed as a percentage of the weight of these elements in unwashed samples, - is very significant. For all elements except Sr, it is close to 50% or exceeds this value (Fig. 2). This means that most of the chemical elements are on the surface of the leaves and washed away from it. The predominant elements washed out from the leaves of urban lindens are Fe (78.8%), Co (78.5%), Cr (62.9%), Ni (61.8%), Ba (59.0%), Pb (58.2%), which are the main pollutant elements. Biophilic elements have slightly lower, but also high washout values: Zn (49.8%), Mn (46.8%), Cu (48.0%), due to their technogenic penetration. Sr, despite the high content in the leaves, varies greatly in index of washing, so its average value is the lowest (4.9%). For all elements except Sr, the difference in the t-test of comparing means is significant between washed and unwashed leaves.
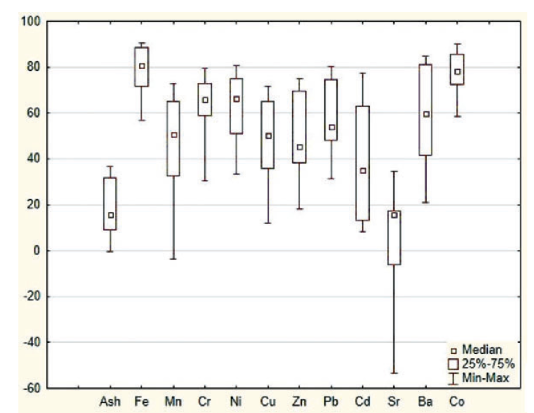
Fig. 2. Average percentages of washout of chemical elements from Tilia cordata leaves for urban habitats
As for the background plants, the comparison of washed and unwashed leaves shows low values of the percentage of elements washout (an average of 10%). The maximum values are Fe (47.3%), Pb (26.4%), Co (26.4%), Cr (17.5%), Ni (13.5%), which is probably due to sampling within settlements with anthropogenic stress. In some samples, the excess of elements such as Cd, Sr, Mn in the washed leaves over their content in unwashed leaves is within the limits of the analysis error and indicates that these elements are not pollutants in the background conditions.
According to the data (Tomasevic et al. 2011), washout indices were calculated, based on which it can be concluded that the average difference in the concentrations of chemical elements between washed and unwashed leaves of Tilia cordata, gathered in three parks of Belgrade, is 26.3 %, which is 2 times less than our indices, but the washed elements are represented mainly by the same pollutants: Fe (49.7%), Cr (38.1%), Pb (30.8%), Ni (21.5%).
Coefficient of concentration Kk (Table 2) was used to assess the contamination of leaves of urban plants. High average values are characteristic for unwashed leaves of Tilia cordata in Fe (8.83), Co (7.47), Cr (5, 62), Pb (4.31), Zn (3.04). The total indicator of pollution Zc varies from 1,7 to 7.91 with average value 4.59. For washed leaves such high values of Kk are not observed; slightly higher values are only for Fe (3.12) and Pb (2.13), Zc varies from 1.57 to 2.9, with average value 2.34, which confirms the fact that most of the pollutants are contained in dust-like particles on the leaf surface.
Table 2. Coefficient of concentration and total index of contamination for unwashed and washed leaves of Tilia cordata
№ | ash | Fe | Mn | Cr | Ni | Cu | Zn | Pb | Cd | Sr | Ba | Co | Zc |
|---|---|---|---|---|---|---|---|---|---|---|---|---|---|
unwashed leaves | |||||||||||||
1 | 1.12 | 4.60 | 0.19 | 5.08 | 0.99 | 2.23 | 1.80 | 2.86 | 1.39 | 1.24 | 0.86 | 3.43 | 3.23 |
2 | 1.18 | 6.60 | 0.19 | 6.03 | 1.14 | 2.67 | 2.26 | 3.32 | 1.61 | 1.22 | 0.89 | 5.29 | 3.77 |
3 | 1.11 | 12.73 | 0.24 | 8.64 | 1.65 | 4.04 | 4.48 | 5.11 | 3.23 | 1.10 | 1.10 | 12.40 | 6.05 |
4 | 1.00 | 5.99 | 0.16 | 4.67 | 1.03 | 2.40 | 2.28 | 3.05 | 2.17 | 0.76 | 0.61 | 4.86 | 3.78 |
5 | 1.08 | 4.73 | 0.10 | 3.27 | 0.85 | 2.17 | 2.09 | 2.82 | 2.22 | 0.91 | 0.64 | 3.78 | 3.51 |
6 | 1.15 | 15.30 | 0.25 | 6.06 | 1.58 | 4.21 | 3.53 | 7.13 | 1.89 | 0.75 | 1.23 | 11.07 | 6.50 |
7 | 1.34 | 17.60 | 0.33 | 9.08 | 2.96 | 4.18 | 5.55 | 8.10 | 5.27 | 1.21 | 1.55 | 15.69 | 7.91 |
8 | 1.32 | 6.14 | 0.12 | 4.91 | 1.63 | 2.34 | 2.26 | 4.06 | 2.82 | 1.16 | 0.74 | 5.39 | 3.84 |
9 | 0.91 | 1.83 | 0.12 | 1.93 | 0.90 | 1.45 | 1.19 | 1.50 | 1.47 | 1.09 | 0.47 | 1.40 | 1.70 |
10 | 1.31 | 12.82 | 0.20 | 6.56 | 1.75 | 3.45 | 4.95 | 5.19 | 2.37 | 1.06 | 1.26 | 11.34 | 5.64 |
average | 1.15 | 8.83 | 0.19 | 5.62 | 1.45 | 2.91 | 3.04 | 4.31 | 2.45 | 1.05 | 0.94 | 7.47 | 4.59 |
SD | 0.14 | 5.31 | 0.07 | 2.19 | 0.63 | 0.98 | 1.49 | 2.07 | 1.15 | 0.18 | 0.34 | 4.75 | 1.86 |
washed leaves | |||||||||||||
1 | 1.23 | 2.74 | 0.13 | 0.26 | 0.55 | 1.50 | 1.07 | 1.86 | 0.94 | 0.96 | 0.50 | 1.49 | 2.16 |
2 | 1.29 | 3.21 | 0.09 | 0.28 | 0.48 | 1.30 | 1.31 | 2.13 | 0.93 | 0.95 | 0.33 | 1.82 | 2.44 |
3 | 1.21 | 3.23 | 0.07 | 0.29 | 0.36 | 1.20 | 1.21 | 1.83 | 0.66 | 0.67 | 0.20 | 1.99 | 2.36 |
4 | 1.10 | 3.71 | 0.09 | 0.26 | 0.52 | 1.48 | 1.50 | 2.13 | 1.70 | 0.59 | 0.27 | 1.94 | 2.49 |
5 | 1.18 | 2.95 | 0.08 | 0.22 | 0.62 | 1.85 | 1.72 | 2.04 | 1.33 | 1.30 | 0.40 | 1.30 | 2.08 |
6 | 1.26 | 3.53 | 0.07 | 0.28 | 0.45 | 1.56 | 1.28 | 2.11 | 0.63 | 0.60 | 0.23 | 2.33 | 2.71 |
7 | 1.47 | 3.66 | 0.12 | 0.26 | 0.71 | 1.31 | 1.54 | 2.22 | 1.10 | 0.83 | 0.24 | 2.28 | 2.42 |
8 | 1.45 | 2.26 | 0.07 | 0.22 | 0.57 | 1.30 | 1.33 | 3.34 | 2.23 | 1.33 | 0.39 | 1.58 | 2.23 |
9 | 1.00 | 1.73 | 0.13 | 0.18 | 0.68 | 1.34 | 1.04 | 1.44 | 1.22 | 1.08 | 0.37 | 0.85 | 1.57 |
10 | 1.44 | 4.15 | 0.08 | 0.24 | 0.51 | 1.27 | 1.62 | 2.16 | 0.91 | 0.95 | 0.30 | 2.39 | 2.90 |
average | 1.26 | 3.12 | 0.09 | 0.25 | 0.55 | 1.41 | 1.36 | 2.13 | 1.16 | 0.93 | 0.32 | 1.80 | 2.34 |
SD | 0.16 | 0.73 | 0.02 | 0.03 | 0.11 | 0.19 | 0.23 | 0.49 | 0.49 | 0.26 | 0.09 | 0.50 | 0.36 |
Values of ash content and concentrations of chemical elements in leaves of different trees and shrubs are presented in table 3. Ash content in leaves of various plants is different and depends on species, character of leaves surface and ecological situation of habitat (Weerakkody et al. 2018). The differences of this indicator for the studied species are presented in Fig. 3, but statistically they are not supported due to the insufficient number of samples. Populus sp. has the highest value of ash content as for unwashed (14.4%) and washed leaves (14.6%). It is related with xeromorphic nature of leaves, therefore big difference between ash content for unwashed and washed leaves is absent. Ulmus laevis and Rosa rugosa have rough surface of leaves that leads to accumulation of dust; other reason for Ulmus - these trees grow on the streets with heavy traffic. Tilia cordata also has the high value of ash content, but usually it is related with wide leaves covered excreta of insects contributed to sticking dust. The next species Cotoneaster lucidus has hard xeromorphic leaves and relatively high ash content. Other species has ash content about 6-7%. The biggest difference between these figures for unwashed and washed leaves (19.2%) is for Ulmus laevis and Tilia cordata. For two species Syringa josikaea and Berberis vulgaris this difference is negative, because their habitat - on The Field of Mars - was relatively clean place, more than 10 m away from the roadways, with good blowing.
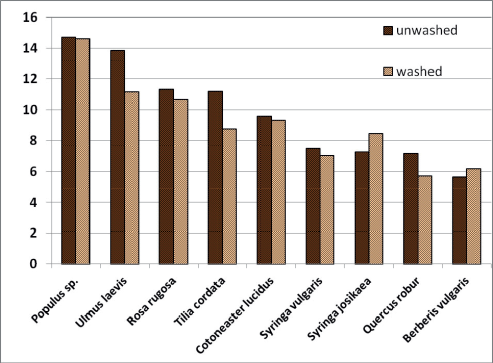
Fig. 3. Ash content (% of dry matter) in unwashed and washed leaves of investigated plants
Content of Fe, Cr, Ni, Cu, Pb, Ba is maximum for leaves of Ulmus laevis and Rosa rugosa. Zn, Cd, Sr have the maximum values for leaves of Poplar sp., this is the species features of accumulation. For all elements, except Zn, Cd, and Sr, the difference in the t-test of comparing means is significant between washed and unwashed leaves of investigated species.
The literature contains data on the accumulation of particulate matter by leaves of woody plants in different countries: for Poland and Norway (Sæbø et al. 2012), for USA (Nowak et al. 2013), for Serbia (Urosevic et al. 2019), for Iran (Norouzi et al. 2015; Kardel et al. 2018), for China (Chen et al. 2016; Liu et al. 2017); also a review of this subject is presented in an article by Yang, J., Chang, Y., Yan P. (2015). The series of plant species that characterize the decrease in the accumulation of suspended particles vary greatly depending on the local urban flora, so their use in different regions requires additional research.
Comparison of the obtained data with the content of chemical elements in a "Reference plant" (Markert 1992) showed that the Fe content for all samples exceeds the baseline level, which is explained by a significant anthropogenic load. Low level of Mn is observed in leaves of urban trees and shrubs and demonstrates violation of the ratio Fe / Mn - the excess Fe intake leads to a deficiency of Mn (Kabata-Pendias et al. 2001). For some samples, an excess of Cr, Co and Cd is noted. Poplar leaves accumulate Zn, which is its species feature. Paired t-test demonstrated significance of difference between washed and unwashed leaves for all investigated elements excluded Zn, Cd, and Sr.
Comparison of the contents of chemical elements in the leaves of linden and poplar, taken at the same points, showed that in general unwashed leaves of linden contain 2-4 times more elements (especially Fe, Cr, Pb, Ba); washed leaves of both species contain approximately the same amount of elements (except for Zn, Co, Cd, which in both cases prevail in poplar leaves). Thus, significantly more particulate matters are deposited on the surface of linden leaves than on the surface of poplar leaves, due to the fact that, as mentioned above, the sticky secretions of insects living on lindens serve as a suitable surface for the accumulation of pollutants.
Indicators of the percentage of substances washed away from the surface of leaves of investigated species of trees and shrubs are presented in Fig. 4. The average values of these indicators for all studied plants for each chemical element are arranged in the following row: Fe (63.8%), Co (57.4%), Cr (37.3%), Pb (36.7%), Ni (35.7%), Cu (34.7%), Ba (28.9%), Zn (25.2%), Mn (17.9%), Cd (11.6%), Sr (3.7%). The maximum values of the average washout index for all investigated chemical elements were noted in Tilia cordata (53.6%) and Ulmus laevis (52.3%). Rosa rugosa (37.2%) and Quercus robur (35.6%) are significantly behind them. Minimum washout value is for Cotoneaster lucidus (15.6%), with smooth and hard leaves. For other species, this index varies from 21 to 28%. Comparison of our data with the data of other researchers yielded the following results: for a number of evergreen plant species in Palermo (Italy) (Olivia et al. 2004), the percentage of washout for Cr is similar to ours, but for other elements we have much higher rates. In the city of Amman (Jordan), the washout for Pb, Cd, Zn, Cu is higher for Pinus eldarica than ours (Al-Alawi et al. 2007), and for Bojnourd (Iran) washing the leaves for Fraxinus excelsior removed of Cu, Zn, Pb about 20-46% (Solgi et al. 2020) which is similar to our data. Probably, these indicators depend both on species features and on the degree of air pollution in these cities.
Fig. 4. Percentage of chemical elements, which were washed away from the leaves of different plant specie
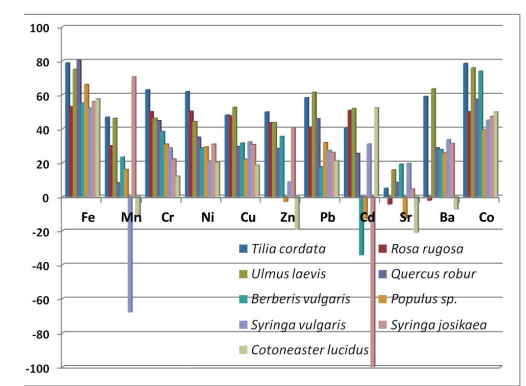
Note: Negative values of washout show that the content of chemical elements in washed leaves is higher than in unwashed ones.
Coefficients of concentration and total index of contamination for unwashed and washed leaves of different species of investigated trees and shrubs are presented in table 4. Pb, Cr, Cu show Kk>1 for unwashed and washed leaves of all species, whereas other elements can have Kk both more and less than 1. It should be noted that the main pollutants of urban soils in the Central Region are Zn, Pb, Cd, Cu (Ufimtseva et al. 2014). Here is also three species - Ulmus laevis, Populus sp., and Rosa rugosa - demonstrate high values by concentration of many chemical elements and total index of contamination.
Table 3. Concentrations of chemical elements μg*g-1 of dry matter) and ach content (%) in unwashed and washed (w) leaves of shrubs and trees from Central District of St. Petersburg
№ | ash, % | Fe | Mn | Cr | Ni | Cu | Zn | Pb | Cd | Sr | Ba | Co |
|---|---|---|---|---|---|---|---|---|---|---|---|---|
Syringa vulgaris | ||||||||||||
15 | 7.49 | 330.20 | 19.15 | 1.43 | 0.54 | 9.07 | 45.56 | 2.38 | 0.07 | 20.31 | 12.81 | 0.15 |
15w | 7.04 | 157.62 | 32.18 | 1.02 | 0.42 | 6.14 | 41.62 | 1.73 | 0.05 | 16.34 | 8.52 | 0.08 |
Cotoneaster lucidus | ||||||||||||
16 | 9.58 | 535.85 | 29.67 | 2.05 | 0.73 | 9.51 | 29.78 | 3.06 | 0.06 | 36.20 | 52.29 | 0.26 |
16w | 9.29 | 227.52 | 33.11 | 1.80 | 0.59 | 7.74 | 35.60 | 2.42 | 0.03 | 43.87 | 56.23 | 0.13 |
Berberis vulgaris | ||||||||||||
17 | 5.63 | 480.58 | 43.62 | 1.63 | 0.52 | 10.64 | 23.15 | 2.17 | 0.02 | 23.60 | 13.52 | 0.20 |
17w | 6.18 | 216.09 | 33.50 | 1.01 | 0.37 | 7.29 | 14.95 | 1.79 | 0.03 | 19.09 | 9.76 | 0.05 |
Syringa josikaea | ||||||||||||
18 | 7.26 | 604.63 | 73.14 | 2.11 | 0.84 | 11.55 | 73.37 | 2.96 | 0.02 | 33.85 | 31.96 | 0.25 |
18w | 8.45 | 265.88 | 21.59 | 1.64 | 0.58 | 8.01 | 43.76 | 2.19 | 0.05 | 32.36 | 21.96 | 0.13 |
Rosa rugosa | ||||||||||||
19 | 11.31 | 2247.08 | 44.69 | 5.67 | 2.35 | 19.57 | 43.67 | 7.22 | 0.10 | 36.54 | 48.98 | 1.11 |
19w | 10.64 | 1056.34 | 31.30 | 2.83 | 1.17 | 10.26 | 24.68 | 4.27 | 0.05 | 38.18 | 50.10 | 0.55 |
Ulmus laevis | ||||||||||||
20 | 13.89 | 3051.15 | 60.26 | 6.35 | 4.46 | 32.23 | 86.97 | 11.31 | 0.11 | 34.04 | 54.46 | 1.43 |
20w | 10.88 | 684.79 | 27.81 | 2.52 | 1.83 | 12.18 | 47.54 | 3.98 | 0.05 | 25.02 | 17.95 | 0.33 |
21 | 13.74 | 2134.14 | 61.74 | 4.14 | 2.89 | 19.38 | 65.01 | 9.00 | 0.14 | 43.57 | 43.85 | 1.04 |
21w | 11.45 | 592.66 | 38.14 | 2.82 | 2.04 | 11.08 | 37.79 | 3.77 | 0.07 | 41.45 | 17.63 | 0.26 |
Quercus robur | ||||||||||||
22 | 7.16 | 756.56 | 22.19 | 2.47 | 1.01 | 7.16 | 24.36 | 3.67 | 0.04 | 12.54 | 17.84 | 0.31 |
22w | 6.77 | 411.97 | 15.73 | 1.75 | 0.72 | 5.50 | 18.28 | 2.55 | 0.03 | 11.78 | 12.59 | 0.19 |
Populus sp. | ||||||||||||
23 | 11.58 | 753.30 | 31.39 | 2.21 | 2.29 | 11.93 | 141.29 | 3.76 | 0.39 | 29.19 | 17.26 | 0.89 |
23w | 10.45 | 329.03 | 31.58 | 1.56 | 0.79 | 9.21 | 189.23 | 2.61 | 0.51 | 33.98 | 12.23 | 0.79 |
24 | 12.38 | 1740.43 | 41.23 | 3.89 | 3.42 | 16.96 | 137.42 | 6.36 | 0.44 | 45.06 | 38.01 | 1.14 |
24w | 12.19 | 392.29 | 27.39 | 1.90 | 2.38 | 12.44 | 141.44 | 3.06 | 0.52 | 49.51 | 21.22 | 0.56 |
25 | 13.89 | 388.47 | 37.64 | 2.58 | 1.21 | 10.08 | 144.41 | 3.74 | 0.49 | 55.26 | 18.61 | 0.48 |
25w | 13.90 | 174.95 | 33.36 | 2.56 | 1.45 | 9.48 | 145.91 | 2.65 | 0.51 | 63.79 | 17.09 | 0.35 |
26 | 20.96 | 1055.43 | 56.81 | 3.42 | 1.84 | 16.41 | 440.14 | 6.54 | 1.18 | 92.43 | 44.85 | 0.69 |
26w | 21.78 | 258.95 | 45.54 | 1.99 | 1.11 | 11.04 | 326.69 | 5.51 | 1.15 | 101.06 | 35.28 | 0.23 |
Regional background | 272.88 | 215.90 | 0.74 | 1.65 | 5.72 | 31.02 | 0.84 | 0.07 | 33.20 | 25.00 | 0.25 | |
Reference plant (by Markert, 1992) | 150 | 200 | 1.5 | 1.5 | 10 | 50 | 1 | 0.05 | 50 | 40 | 0.2 | |
Table 4. Coefficients of concentration and total index of contamination for unwashed and washed (w) leaves of different species of trees and shrubs (bold text indicates the highest values for unwashed leaves)
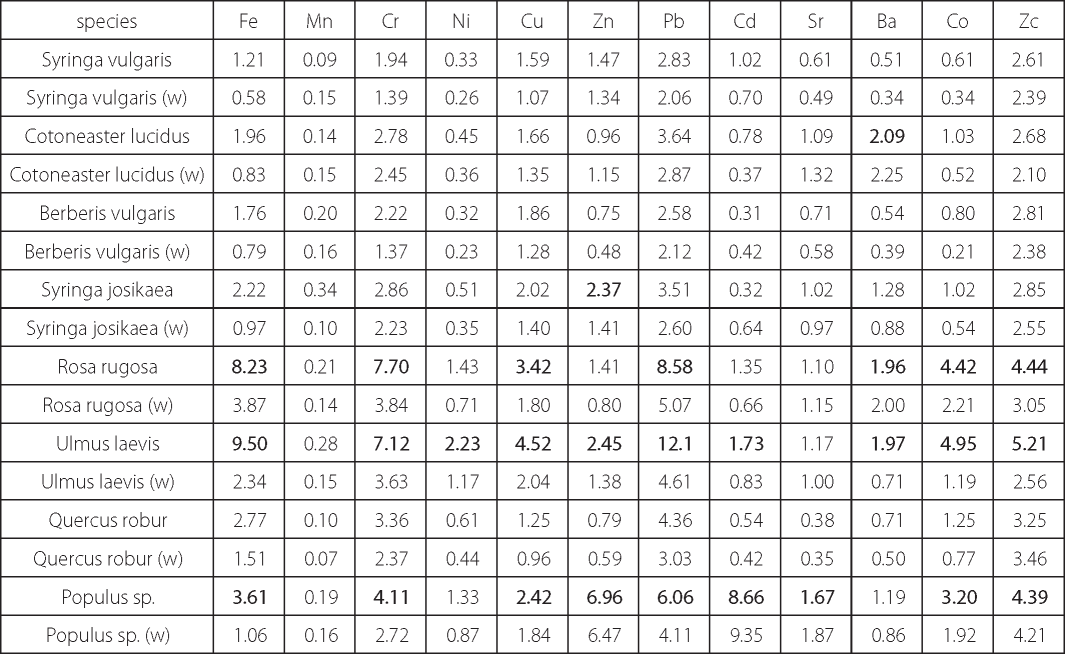
Notes. Addresses of sampling points: 15-19 - Field of Mars, 20 - Admiralty Embankment near the Palace Bridge, 21 - Garden of the Winter Palace, roadside, 22 - Field of Mars, 23 - Preobrazhenskaya Square, 24 - Embankment of the Obvodny Canal, 7A, 25 - Mitropolichiy Sad, 26 - Novgorodskaya St., 1
As a result of the research conducted to assess the influence of atmospheric pollution on the chemical composition of leaves of urban plants, the following conclusions are obtained:
Results of the study showed the most of pollutants - Fe, Co, Cr, Ni, Ba, Pb - deposited on the surface of the leaves and can be washed off into the soil with precipitation. Different types of trees and shrubs accumulate pollutants in different ways, most of all they are accumulated by leaves of Ulmus laevis, Tilia cordata, Populus sp., Rosa rugosa. One can recommend them for use in green areas, creating protective vegetation strips along the obviously dangerous point and line technical objects, with the aim of improving the ecological situation in general and protecting the health of the local population in particular. Tilia cordata can be used as bioindicator of city air pollution by particulate matter.
1. Aksenova Yu.E. (2017). Estimation of the impact of vehicles on the state of atmospheric air by the method of biogeochemical indication. Proceedings of the conference Problems of Geology and Mineral Resources. Tomsk, 684-686 (in Russian).
2. Aksoy A., Ozturk M.A. (1997). Nerium oleander L. as a biomonitor of lead and other heavy metal pollution in Mediterranean environments. Science of the Total Environment, 205, 145-150. DOI: 10.1016/S0048-9697(97)00195-2.
3. Al-Alawi Mu’taz M., Khakhathi L. Mandiwana (2007). The use of Aleppo pine needles as a bio-monitor of heavy metals in the atmosphere. Journal of Hazardous Materials, 148(1-2), 43-46. DOI: 10.1016/j.jhazmat.2007.02.001.
4. Alfani A., Maisto G., Iovieno P., Rutigliano F.A., Bartoli G. (1996). Leaf contamination by atmospheric pollutants as assessed by elemental analysis of leaf tissue, leaf surface deposit and soil. Journal of Plant Physiology, 148(1-2), 243-248. DOI: 10.1016/S0176-1617(96)80321-X.
5. Anićić M., Spasić T., Tomašević M., Rajšić S., Tasić, M. (2011). Trace elements accumulation and temporal trends in leaves of urban deciduous trees (Aesculus hippocastanum and Tilia spp.). Ecological Indicators, 11, 824-830. DOI: 10.1016/j.ecolind.2010.10.009.
6. Aničić Urošević, M., Jovanović, G., Stević, N., Deljanin, I., Nikolić, M., Tomašević, M., Samson, R. (2019). Leaves of common urban tree species (Aesculus hippocastanum, Acer platanoides, Betula pendula and Tilia cordata) as a measure of particle and particle-bound pollution: a 4-year study. Air Quality, Atmosphere and Health, 12(9), 1081-1090. DOI: 10.1007/s11869-019-00724-6.
7. Bargagli R., Ancora S., Bianchi N., Rota E. (2019). Deposition, abatement and environmental fate of pollutants in urban green ecosystems: Suggestions from long-term studies in Siena (Central Italy). Urban forestry and urban greening, 46, 126483. DOI: 10.1016/j.ufug.2019.126483.
8. Beckett, K.P., Freer-Smith P.H., Taylor G. (1998). Urban woodlands: their role in reducing the effects of particulate pollution. Environmental Pollution, 99, 347-360. DOI: 10.1016/S0269-7491(98)00016-5.
9. Chen L., Liu C., Zou R., Yang M., Zhang Z. (2016). Experimental examination of effectiveness of vegetation as bio-filter of particulate matters in the urban environment. Environmental Pollution, 208, 198-208. DOI: 10.1016/j.envpol.2015.09.006.
10. Chwil S., Kozłowska-Strawska J., Tkaczyk P., Chwil P., Matraszek R. (2015). Assessment of air pollutants in an urban agglomeration in Poland made by the biomonitoring of trees. Journal of Elementology, 20(4), 813-826. DOI: 10.5601/jelem.2015.20.1.742.
11. Czaja M., Kołton A., Baran A., Muras P. (2014). Influence of urban transport on heavy metals accumulation in the leaves of lime trees in Cracow. Logistyka, 4, 4193-4197.
12. De Nicola F., Maisto G., Prati M.V., Alfani A. (2008). Leaf accumulation of trace elements and polycyclic aromatic hydrocarbons (PAHs) in Quercus ilex L. Environmental Pollution, 153, 376-383. DOI: 10.1016/j.envpol.2007.08.008.
13. Drozdova I.V., Alekseeva-Popova N.V., Beliaeva A.I. (2015). The content of heavy metals in the soil-plant system of some specially protected natural areas of St. Petersburg and the Leningrad region. Environmental problems of industrial cities. Proc. of 7th All-Russia scientific-practical conf. with international participation, Part 1, ed. Prof. E.I. Tikhomirova, Saratov, 251-254 (in Russian).
14. Dzierżanowski K, Gawroński S.W. (2011). Use of trees for reducing particulate matter pollution in air. Challenges of Modern Technology, 1(2), 69-73. DOI: 10.1007/s12273-014-0180-9.
15. Ecological portal of St. Petersburg Available at: www.infoeco.ru/index.php?id=53 [Accessed 10 May. 2019].
16. Ghio A, Devlin R. (2001). Inflammatory lung injury after bronchial instillation of air pollution particles. American Journal of Respiratory and Critical Care Medicine, 164, 704-708. DOI: 10.1164/ajrccm.164.4.2011089.
17. GN 2.1.6.2604-10, Hygienic standards Supplement N 8 to GN 2.1.6.1338-03 «Maximum permissible concentrations (MPC) of pollutants in the atmospheric air of populated areas» (in Russian).
18. Guidelines for geological survey scale 1: 50 000 Biogeochemical and geobotanical studies. (1972). Leningrad: Nedra (in Russian).
19. Janhäll S. (2015). Review on urban vegetation and particle air pollution – Deposition and dispersion. Atmospheric Environment, 105, 130- 137. DOI: 10.1016/j.atmosenv.2015.01.052.
20. Kabata-Pendias Alina, Pendias Henryk (2001).Trace elements in soils and plants. 3rd ed. Boca Raton FL: CRC Press LLC. .
21. Kardel F., Wuyts K., De Wael K., Samson R. (2018). Biomonitoring of atmospheric particulate pollution via chemical composition and magnetic properties of roadside tree leaves. Environmental Science and Pollution Research, 25-26, 25994-26004. DOI: 10.1007/s11356-018-2592-z.
22. Liu Y., Yang Z., Zhu M., Yin J. (2017). Role of plant leaves in removing airborne dust and associated metals on Beijing roadsides. Aerosol and Air Quality Research, 17, 2566-2584. DOI: 10.4209/aaqr.2016.11.0474.
23. Markert B. (1992). Establishing of “Reference Plant” for inorganic characterization of different plant species by chemical fingerprinting. Water Air and Soil Pollution, 64, 533-538. DOI: 10.1007/BF00483363.
24. Movchan V.N., Zubkova P.S., Kalinina I.K., Kuznetsova M.A., Sheinerman N.A. (2018). Assessment and forecast of the ecological situation in St. Petersburg in terms of air pollution and public health indicators. Vestnik SPSU. Earth Sciences, 63(2), 178-193. (in Russian with English summary). DOI: 10.21638/11701/spbu07.2018.204.
25. Nesterov E.M., Zarina LM, Piskunova M.A. (2009). Monitoring of behaviour of heavy metals in snow and soil covers of the central part of St.- Petersburg. Bulletin of the Moscow Region State University. Series: Natural Sciences, 1, 27-34. (in Russian with English summary).
26. Norouzi S., Khademi H. (2015). Source identification of heavy metals in atmospheric dust using Platanus orientalis L. leaves as bioindicator. Eurasian Journal of Soil Science, 4(3), 144-152. DOI: 10.18393/ejss.2015.3.144-152.
27. Nowak D.J., Hirabayashi S., Bodine A., Hoehn R. (2013). Modeled PM2.5 removal by trees in ten U.S. cities and associated health effects. Environmental Pollution, 178, 395-402. DOI: 10.1016/j.envpol.2013.03.050.
28. Oliva S.R., Valdés B. (2004). Influence of washing on metal concentrations in leaf tissue. Communications in Soil Science and Plant Analysis, 35(11-12), 1543-1552. DOI: 10.1081/CSS-120038553.
29. Palmieri R.M., La Pera L., Di Bella G., Dugo G. (2005). Simultaneous determination of Cd(II), Cu(II), Pb(II) and Zn(II) by derivative stripping chronopotentiometry in Pittosporum tobira leaves: a measurement of local atmospheric pollution in Messina (Sicily, Italy). Chemosphere, 59, 1161-1168. DOI: 10.1016/j.chemosphere.2004.11.066.
30. Paribok T.A., Sazykina N.A., Temp G.A., Troitskaya E.A., Leina GD, Chervyakova E.G. (1982). Metal content in the leaves of trees in the city. Botanicheskii Zhurnal, 67(11), 1533-1539. (in Russian).
31. Piczak K., Leśniewicz A., Zyrnicki W. (2003). Metal concentrations in deciduous tree leaves from urban areas in Poland. Environmental Monitoring and Assessment, 86, 273-287. DOI: 10.1023/A:1024076504099.
32. Popek R., Gawrońska H., Wrochna M. et al. (2013). Particulate matter on foliage of 13 woody species: deposition on surfaces and phytostabilisation in waxes – a 3-Year Study. International Journal of Phytoremediation, 15, 245-256. DOI: 10.1080/15226514.2012.694498.
33. Saet Yu.E., Revich B.A. (1988). Ecological and geochemical approaches to the development of criteria for the regulatory assessment of the state of the urban environment. Bulletin of the Russian Academy of Sciences, Geographical Series, 4, 37-46. (in Russian).
34. Slepyan E.I., Voloshko L.N., Dzyuba O.F. (1997). Flora of Nevsky Prospect and the natural environment of the historical center of St. Petersburg. Life and safety, 2-3, 406-453. (in Russian).
35. Solgi E., Keramaty M., Solgi M. (2020). Biomonitoring of airborne Cu, Pb, and Zn in an urban area employing a broad leaved and a conifer tree species. Journal of Geochemical Exploration, 208, 106400. DOI: 10.1016/j.gexplo.2019.106400.
36. Sæbø A., Popek R., Nawrot B., Hanslin H.M., Gawronska H., Gawronski S.W. (2012). Plant species differences in particulate matter accumulation on leaf surfaces. Science of the Total Environment, 427-428, 347-354. DOI: 10.1016/j.scitotenv.2012.03.084.
37. Tomašević M., Vukmirović Z., Rajšić S., Tasić M., Stevanović B. (2005). Characterization of trace metal particles deposited on some deciduous tree leaves in an urban area. Chemosphere, 61, 753-760. DOI: 10.1016/j.chemosphere.2005.03.077.
38. Tomašević M., Anićić M., Jovanović Lj., Perić-Grujć A., Ristić M. (2011). Deciduous tree leaves in trace elements biomonitoring: A contribution to methodology. Ecological indicators, 11, 689-695. DOI: 10.1016/j.ecolind.2011.04.017.
39. Ufimtseva M.D., Terekhina N.V. (2005). Phytoindication of ecological state of urban ecosystems in St. Petersburg. St. Petersburg: Nauka (in Russian with English summary).
40. Ufimtseva M.D., Terekhina N.V. (2014). Ecological-geochemical assessment of soil condition in historical center of St. Petersburg. Vestnik of Saint-Petersburg University. Earth Sciences, 2, 122-136. (in Russian with English summary). DOI: 10.21638/11701/spbu07.2017.206.
41. Ufimtseva M.D., Terekhina N.V. (2017). Assessment of ecological status of Central District (Saint-Petersburg) on the basis of ecophytoindication. Vestnik of Saint-Petersburg University. Earth Sciences, 62(2), 209-217. (in Russian with English summary). DOI: 10.21638/11701/spbu07.2017.206.
42. Ugolini F., Tognetti R., Raschi A., Bacci L. (2013). Quercus ilex L. as bioaccumulator for heavy metals in urban areas: Effectiveness of leaf washing with distilled water and considerations on the trees distance from traffic. Urban Forestry & Urban Greening, 12, 576-584. DOI: 10.1016/j. ufug.2013.05.007.
43. Vorontsova A.V., Nesterov E.M. (2012). Geochemistry of snow cover in urban environment. Izvestia: Herzen University Journal of Humanities & Science, 147, 125-132. (in Russian with English summary).
44. Vorontsova A.V. (2013). Features of the behavior of pollutants in the snow cover of St. Petersburg and their impact on the urban environment. PhD Dissertation. St. Petersburg: Herzen University (in Russian with English summary).
45. Weerakkody U., Dover J.W., Mitchell P., Reiling K. (2018). Evaluating the impact of individual leaf traits on atmospheric particulate matter accumulation using natural and synthetic leaves. Urban Forestry & Urban Greening, 30, 98-107. DOI: 10.1016/j.ufug.2018.01.001.
46. Yang, J., Chang, Y., Yan, P. (2015). Ranking the suitability of common urban tree species for controlling PM2.5 pollution. Atmospheric Pollution Research, 6(2), 267-277. DOI: 0.5094/APR.2015.031.
47. Yufereva LM, Gavrilova A.A., Yuferev M.Yu. (2013). Investigation of pollution by heavy metals of the snow cover of garden-park zones in the center of St. Petersburg. Proceedings of Petersburg Transport University, 4, 157-162. (in Russian).
Terekhina N.V., Ufimtseva M.D. Leaves of trees and shrubs as bioindicators of air pollution by particulate matter in Saint Petersburg. GEOGRAPHY, ENVIRONMENT, SUSTAINABILITY. 2020;13(1):224-232. https://doi.org/10.24057/2071-9388-2019-65

Editor-in-Chief
Kasimov Nikolay S.Lomonosov Moscow State University
Moscow 119991 Russia, Leninskie Gory, Faculty of Geography, 1806a
Phone +7 495 939-15-52
E-mail: ges-journal@geogr.msu.ru


