Scroll to:
Emerging and re-emerging natural focal diseases of European Russia (typological classification of nosological profiles and dynamics of incidence)
https://doi.org/10.24057/2071-9388-2019-61
Abstract
This study considers an automated typological classification version by using the extensive factual material in analysis of emerging and re-emerging natural focal diseases of European Russia.
The typological classification of nosological profile (a set of diseases) and the incidence dynamics for five nosological forms (hemorrhagic fever with renal syndrome, ixodic tick-borne borreliosis, tick-borne encephalitis, tularemia, and leptospirosis) was created using the formal methods of mathematical-cartographical modeling. This classification of the incidence in 1997–2015 yielded five types of the nosological profiles. These types vary by years, which is associated with the dependence of the incidence on climatic conditions in each specific year and on extent of deratization and preventive measures. The results obtained can be used to forecast potential epidemiological outbreaks and to develop targeted and appropriate for each region measures.
Keywords
For citations:
Malkhazova S.M., Pestina P.V., Tikunov V.S. Emerging and re-emerging natural focal diseases of European Russia (typological classification of nosological profiles and dynamics of incidence). GEOGRAPHY, ENVIRONMENT, SUSTAINABILITY. 2020;13(1):115-127. https://doi.org/10.24057/2071-9388-2019-61
INTRODUCTION
The classification of phenomena and processes is inherent, in one way or another, in all scientific fields and represent one of the main research methods. The problem of automated creation of classifications and various modifications of methods has increasingly gained importance in modern geoinformatics. A fairly large number of classification methods allow for the construction of appropriate formal algorithms.
A system of such algorithms (called "automated classification algorithms”) has been already widely adopted in geoinformatics (Kapralov et al. 2010). The algorithms of automated classification methods are currently included in a number of GIS packages. However, these algorithms are often created without specific requirements of individual scientific areas where they can be applied. Such versatility has a positive value, allowing for the use of algorithms already developed in applied mathematicians or in other fields. However, this may create difficulties associated with underestimation of specific needs in a particular area.
The use of classifications in geography, environmental science, and medical geography has a long history. Regionalization, typology, and evaluation of complexes, often with rendering of the obtained results on maps, represent, as a rule, not only the methods, but also the research objectives (Feldman 1977; Keller 1992; Tikunov 1997; Malkhazova 2001; Kurolap et al., 2015; Malkhazova et al., 2017; and others).
In classification of geographical complexes, one encounters various challenges; some of them are typical of many fields while others are only characteristic of individual scientific areas, for example, medical geography. One of the problems is that the existing algorithms are usually associated with statistical characteristics that only indirectly or not at all represent spatial position of the phenomena. At the present time, there are no reliable methods of quantitative assessment of the relative importance of geographical location. This necessitates an additional consideration of the territorial aspect of the modeled phenomena. Currently, there have been only few attempts to modify statistical processing of indicators to account for spatial position (Trofimov 1985). The statements of geographical problems and descriptions of phenomena allow for some subjectivism or double interpretation, at least at the present stage of research. Formalized multidimensional classification algorithms may not correspond exactly to the level of formalization and accuracy of the tasks themselves, which sometimes leads to the results that do not correspond to the essence and meaning of the studied phenomena. This problem may be addressed by using the concept of fuzzy sets and development of classification methods based on it (Zadeh 1965; Tikunov 1989).
The issue of the optimal system of base parameters is characteristic of many classifications; such a system must comprehensively (to the extent dictated by the essence of the task) describe the studied phenomena. Consideration of all available data can lead to their redundancy. The data should not duplicate each other, be derived from one another, etc. Otherwise, they may obscure the most significant properties and lead to a distortion of the final result. As a rule, it is difficult to find a specific criterion that determines the use of a given parameter of a geographical complex. A deep knowledge of the studied object is critical and allows establishing the optimal set of parameters. Alternatively, it may be possible to experimentally check the extent to which the input data influence the result.
Another difficulty is associated with the varying degrees of parameters' significance. Some of them are so important that it is not possible to simulate phenomena without their consideration, while others only complement and clarify the basic system. This requires "weighting” the parameters and assessing the degree of their influence on the final results. However, the definition of "weights” is an independent, complex, and largely unsolved, at the present time, task. There have been attempts to justify the system of "weights” by expert surveys of researchers on specific topics (Kapralov et al. 2010).
Most of the classification problems in geography are associated with quantitative and/or qualitative (for example, those that come from some other classifications) parameters. This imposes certain restrictions on the use of various methods of multidimensional classification. Since a significant part of the data that are taken into account in classifications is of a qualitative nature, the algorithms must be able to work with non-numeric characteristics. The creation of systems of such algorithms is a progressing field of research on multidimensional statistical analysis.
In all geographical studies, complexes should be treated as spatiotemporal formations. In this regard, the role of temporal and content-rich characteristics of the studied complexes in the classifications used in natural and social sciences (e.g., biology, geology, economics, history, etc.) should not be underestimated.
The present study considers the existing difficulties and the provisions outlined above and tests an automated typological classification version by using the extensive factual material in analysis of emerging and re-emerging natural focal diseases of European Russia. The problem of emerging and re-emerging diseases arose as a major world health care problem at the end of the XXth century. The World Health Organization (WHO) states that emerging and re-emerging infections are those that have recently appeared or whose incidence has increased over the past two decades or has a potential to increase in the near future. This term includes both diseases that spread to new territories and returning infectious diseases (Morse 1995; Jones et al. 2008; Malkhazova et al. 2016; Malkhazova and Mironova 2017).
The typological classification of nosological profile (a set of diseases) and the incidence dynamics for five nosological forms was created using the formal methods of mathematico-cartographical modeling (Tikunov 1997). A purposefully configured calculation algorithm was created specifically for this study. The advantage of the developed classification is its ability to analyze patterns of incidence variation as a result of grouping the administrative-territorial units (TUs) into taxa with homogeneous dynamics patterns. Such a typology allows studying not only the individual series, but also their groups, which are less susceptible to random fluctuations.
MATERIALS AND METHODS
The goal of the study presented herein was to use the typological classification method discussed in (Tikunov 1983) to obtain homogeneous groups for 48 TUs of European Russia, using the data on the 1997-2015 (19 yrs) incidence statistics on five emerging and re-emerging (herein-thereafter, referred to as "emerging”) natural focal infections: hemorrhagic fever with renal syndrome (HFRS), ixodic tick-borne borreliosis (ITBB) (i.e., lyme disease), tick- borne encephalitis (TBE), tularemia, and leptospirosis (Malkhazova et.al. 2019).. The calculations produced a series of maps which characterize the types of the nosological profiles for individual years (1997, 2005, 2015) and for the entire studied period (1997-2015), as well as a series of maps of incidence dynamics types for each nosological form for the considered period. The arithmetic mean incidence values for the nosological forms are shown on the maps of the nosological profiles as bar-charts, where the y-axis is the incidence and the x-axis is a nosological form, and on the maps of the incidence dynamics types — as line-charts of the incidence by years.
In the applied typological algorithm, the entire set of parameters for any TU can be written as a M-dimensional vector-string [x, x2, x3,...xm], and the entire set of TUs (with the number of N equal to 48 in this study) is denoted by X={x1...,xN}, where xi-i is -th TU. Spatially, TUs may be described by various parameters and metrics, the main of which are those that allow calculating the distance between TUs (i.e., the coefficients of "similarity” or "difference” between them). In addition to geographical space, the studied set of TUs also exists in the M-parameter space (19) where TUs lose their geographical attributes and, regardless of their original nature, become M-dimensional points. The result of this (Kapralov et al. 2010) is:
- Representation of the original TUs in the form of "TU—parameter” matrix, reflecting the measurements of M-parameters for NTUs with N rows and M columns:

where
xi=(xi(1) ,…,xi (M))- i -th TU in -dimensional space of parameters,
x(j) - j-th parameter, x(j)=(x1(j),..., xN(j)) ,
xi(j) - value of j-th parameter of i-th TU,
i∈{1,...,N} j∈{1,...,M} .
- Representation of the original TUs in the form of "TU— TU” matrix, reflecting the result of the TUs' comparison in the parameters' or geographical space with N rows and columns:
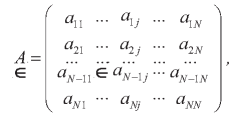
where
aij- result of comparison of i -th and j-th TU i,j g {1,...,N} .
As a rule, aij means the measure of difference (or similarity) of the TUs. In the case of interpretation of aij as a measure of difference, the matrix A is symmetric, with zeros on the main diagonal. The transition from "TU—parameter” matrix to "TU—TU” matrix is performed by setting the metric d (the distance between the TUs).
In this case, the TUs are compared with each' other by the method of pairwise comparison.
The next stage of the TUs' classification is their pretreatment, including normalization, weighing, and dimensionality reduction.
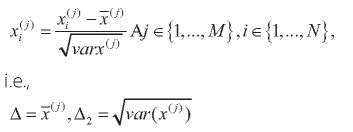
The normalization was carried out according to the variance and mathematical expectation.
The purpose of this normalization is to bring each incidence parameter for five types of infections, each for 19 years, to a standard form (as a result, the mathematical expectation of any parameter becomes zero, and the variance becomes one).

be the assessment of mathematical expectation of j -th parameter,

be the assessment of variance of j -th parameter.
Then the normalization means the recalculation
The next step includes the application of the principal component method. Principal component analysis, or component analysis, is one of the most frequently used methods for dimensionality reduction. This method solves the problem of finding, using the existing system of parameters that describe the TUs, a new system with the following properties:
- the new system's parameters are the linear
combinations of the original system's parameters;
- the number of parameters in the new system does
not generally exceed (and in practice is always less) the number of parameters in the original system;
- the new system's parameters are orthogonal, i.e.
uncorrelated;
- the new system's parameters are ordered in
descending order of variance;
- the new system's parameters carry as much
information (or a predetermined percentage of information, for example, 90%) about the variability of objects, as the original parameters. "Information” refers to the variance of parameters.
The principal component method is applied to correct the original parameters' space distorted by mutual correlations, to reduce the volume of the stored data without losing a significant part of the information on the TUs, to visualize the TUs in the parameters' space (which is achieved, for example, by rendering the TUs as points on the plane of the first two main components), and to identify the latent (i.e., hidden, not clearly observable) parameters that reflect the essence of processes or phenomena.
In a matrix form, the result of the principal component method is written as Z=XL or ZN·m=XN·MLM·m , where
M - the number of the original parameters;
m - the number of the principle components obtained, m≤M ;
Z=ZN·m=(z(1),...,z(m)) - matrix of the new parameters (as in the original matrix, the parameters are arranged in columns);
X=XN*M=(xi(1),…,xi(M) - the original matrix "TU—parameters”;
L=LM·m=(l(1),...,l(m)) - the calculated matrix of the componential loads.
The most simple is the geometric interpretation of the principal component method. In a multidimensional parameters' space, the TUs are considered as points, whose cloud's geometrical arrangement, in the case of the normal distribution, resembles a M-dimensional ellipsoid. The main axes of the imaginary ellipsoid are treated as the new parameters, sorted in the descending order of the TUs' dispersions along the axes.
Of course, component analysis is not the only method of dimensionality reduction. As examples of other common methods, we should note factor analysis, multidimensional scaling, and the method of extreme grouping of parameters. There are various methods for measuring distances in a multidimensional parameters' space. The parameters can
be measured on various scales — quantitative, ordinal, or nominal, which produces various types of distances between the TUs. This, first of all, allows constructing different "TU-TU” proximity matrixes for geographical and parameters' spaces. In addition, they are used to construct the distances between classes and functionals of classification quality.
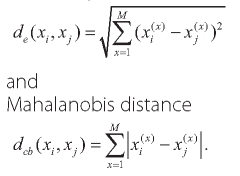
The most general relation is used to calculate the distance for M quantitative parameters. This relation is called the Mahalanobis-type metric. Special cases of the Mahalanobis- type distance are:
- ordinary Euclidean distance
The TUs correlation coefficient can also be used as a measure of the TUs' proximity in the space of numerical parameters.
The distances between the TUs in the space with ordinal parameters are most often based on various rank-order correlation coefficients. The main ones are the Spearman and Kendall rank-order coefficients.
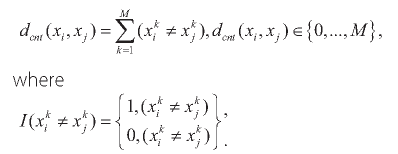
The distance between the TUs characterized by the nominal parameters is usually calculated as the number of matches or discrepancies between the parameters' values for two TUs:
Relevant literature on data analysis methods can be used to expand the list of methods for determining distances between objects in the parameters' space (Ayvazyan et al., 1985, 1989).
The typological method, which entails normalization of the base-parameter system by variances, represents a matrix for calculating the Euclidean distances (dk), connecting each pair of the TUs and capturing their differences. From the obtained d.k values, the greatest distance is chosen, and the two TUs that it links become the cores of the homogeneous territorial clusters. The clusters are formed by the distribution of the remaining TUs between the two cores based on the minimal Euclidean distances. If the number of the clusters is large, the third core (and all the subsequent ones) are isolated by testing each of the remaining TUs as cores, and the remaining TUs are distributed among the three cores by minimality of dk; the variant with the smallest intragroup differences is identified. The resulting number of groupings can be analyzed by the absolute and relative heterogeneity coefficients and, thus, we can choose the optimal number of clusters:
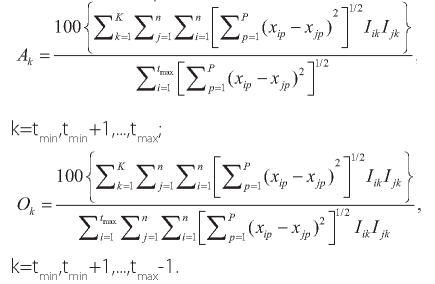
where К - the number of identified groups; Р - the number of the orthogonalized coefficients to calculate distances; n - the number of TUs; tmax - the maximal number of groups; tmin - the minimal number of groups; I - indicator (binary), pointing to the presence (1) or absence (0) of TUi in group k.
A sharp increase in the absolute or relative coefficients of heterogeneity with a decrease in the number of the identifiable clusters indicates the increase in heterogeneity within the identified clusters, while, on the contrary, a smooth increase in the coefficients is a sign of its uniform increase. The threshold followed by a sharp increase in heterogeneity can be optimally taken as the final number of clusters. In our analysis, the isolation of five clusters (specific types of nosological profiles) in all calculations turned out to be optimal.
RESULTS AND DISCUSSION
Types of nosological profiles
In 1997, the first two out of five isolated clusters (Fig. 1), each characterizing a specific set of re-emerging natural focal diseases, have similar features. The incidence of diseases is relatively high — more than 100 cases per 100,000 population, on average. The first type includes the Republic of Bashkortostan with a very high incidence of HFRS and a very low (less than one) incidence of TBE and ITBB. The second includes the Republic of Udmurtia with a high incidence of HFRS and a medium incidence of TBE and ITBB. The incidence of leptospirosis and tularemia is close to zero.
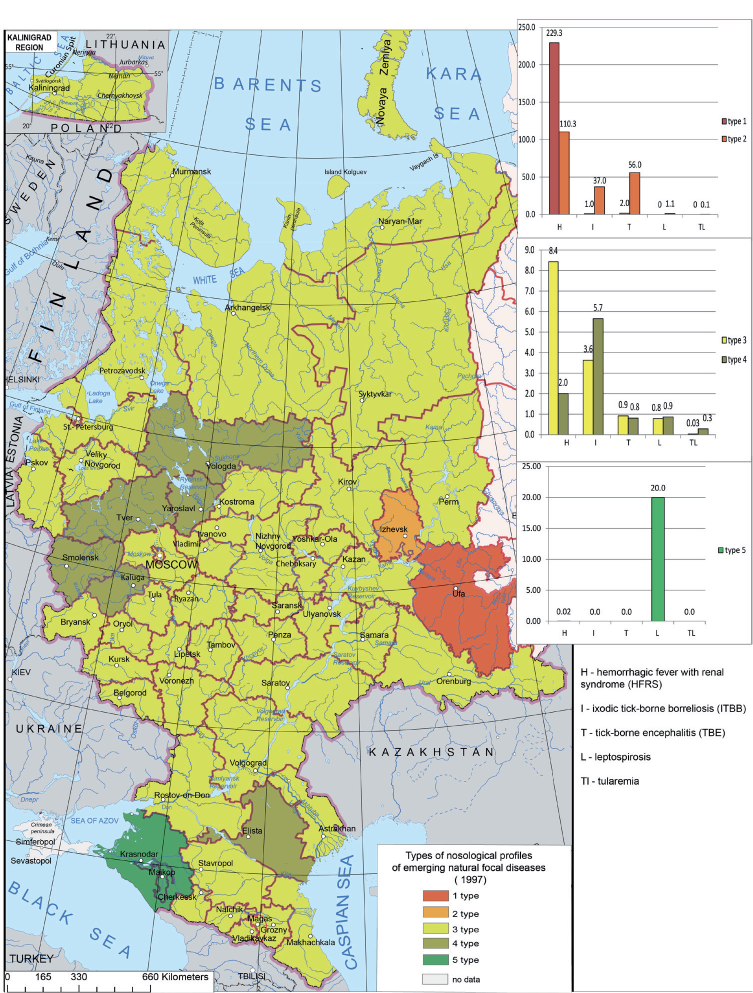
Fig. 1. The types of nosological profiles of emerging and re-emerging natural focal diseases in European Russia in 1997
The third type is associated with the most part of European Russia where all nosological forms are recorded. There are 8.4 and 3.4 cases and per 100,000 population of HFRS and ITBB respectively; the incidence of other infections is less than one.
The fourth type includes six TUs — the Vologda, Kaluga, Smolensk, Tver, and Yaroslavl regions, and the Republic of Kalmykia. It has a fairly high incidence of ITBB (5.7 cases per 100,000 population, on average), a lower incidence of HFRS (two cases per 100,000 population), and a very low incidence of other nosological forms (less than one).
The fifth type includes two regions — the Krasnodar Territory and the Republic ofAdygea, with a fairly high incidence of leptospirosis (over 20 cases per 100,000 population) and an extremely low incidence of HFRS (0.02 cases per 100,000 population).
In 2005, the situation differs from that in 1997 (Fig. 2). The first type, which includes the Republic of Udmurtia (Fig. 1), is characterized by a high incidence of ITBB and HFRS (36.7 and 28.3 cases per 100,000 population respectively) and a medium incidence of TBE (13.1 cases per 100,000 population). The incidence of leptospirosis is very low (two cases per 100,000 population), and there are no cases of tularemia.
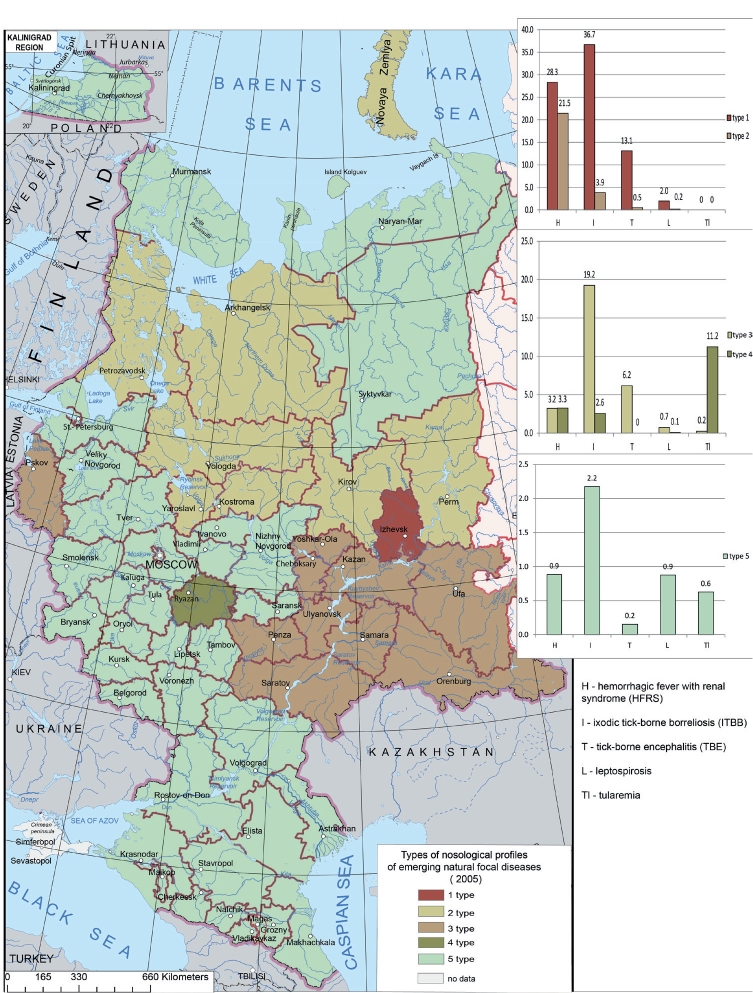
Fig. 2. The types of nosological profiles of emerging and re-emerging natural focal diseases in European Russia in 2005
The second type includes TUs of the Volga Federal District — the Orenburg, Penza, Samara, Saratov, and Ulyanovsk Regions, the Republics of Bashkortostan, Mari-El, Tatarstan, and Chuvashia; and of the Northwestern Federal District — the Pskov Region. There is a fairly high average incidence of HFRS (21.5 cases per 100,000 population) and a low incidence of TBE, ITBB, and leptospirosis. There are no tularemia cases.
The third type is typical of the Northwestern Federal District (the Arkhangelsk and Vologda Regions, and the Republic of Karelia), of the north of the Central Federal District (the Kostroma and Yaroslavl Regions) and of the north of the Volga Federal District (the Kirov Region and Perm Territory). The incidence of ITBB is relatively high (19.2 cases per 100,000 population). The incidence of other infections — TBE and HFRS, does not exceed seven cases per 100,000 population; and the incidence of leptospirosis and tularemia is close to zero.
In 2005, there was an outbreak of tularemia in the Ryazan Region, which, combined with a low incidence of HFRS and ITBB (about three cases per 100,000 population) and a very low incidence of leptospirosis, allowed us to classify this region as a separate, fourth type of the nosological profile.
The fifth type has some similarities with the fourth type isolated in 1997 (Fig. 1). As in 1997, it is characteristic of most European Russia (Fig. 2). The average incidence in the TUs of this cluster is quite low, with all of the analyzed nosological forms recorded.The nosological profiles of natural focal diseases in 2015 differ from those in 1997 and in 2005 (Fig. 3). The first type is characterized by a high incidence of HFRS (40 cases per 100,000 population), and a much lower incidence of TBE and ITBB (3.5 and 9.6 cases per 100,000 population, respectively). The incidence of leptospirosis is close to zero and tularemia was not recorded in this cluster in 2015. This type encompasses TUs of the Volga Federal District (the Republics of Bashkortostan, Mordovia, and Udmurtia, and the Perm Territory) and TUs of the Central Federal District (the Kostroma and Yaroslavl Regions).
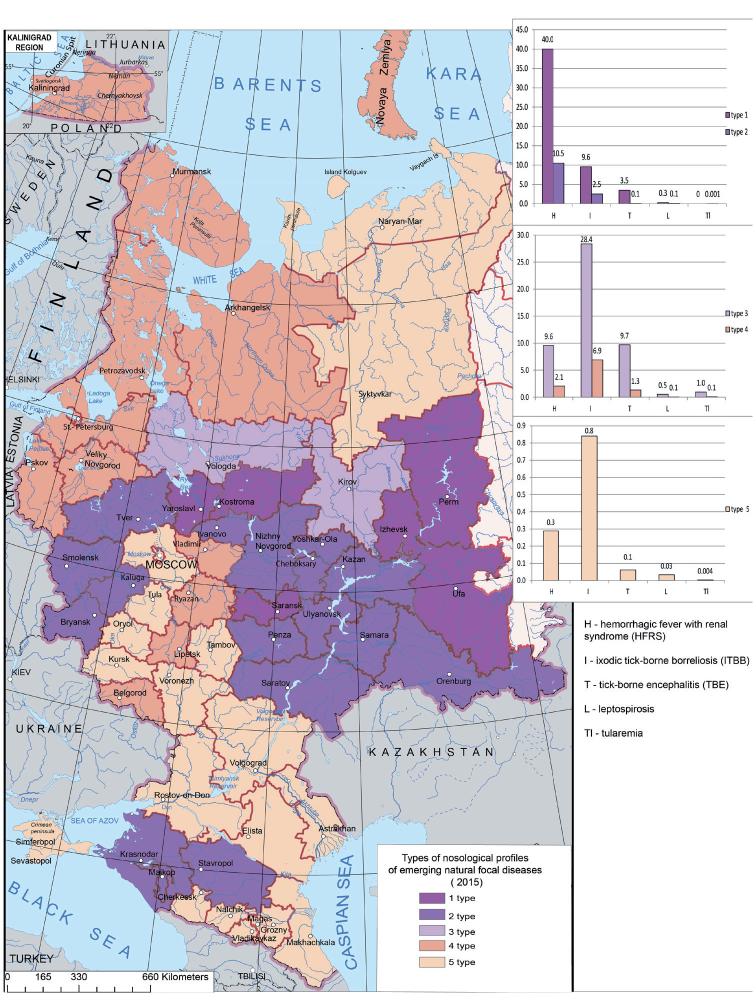
Fig. 3. The types of nosological profiles of emerging and re-emerging natural focal diseases in European Russia in 2015
The second type includes the Volga, Central, and Southern Federal Districts. It is characterized by a low incidence (the average number of cases of HFRS is 10.5 per 100,000) population; the incidence of TBE and ITBB is 0.1 and 2.5, respectively; the incidence of leptospirosis and tularemia is close to zero.
The third type includes the Vologda and Kirov Regions. It has a high (28.4 cases per 100,000 population) incidence of ITBB; the HFRS and TBE incidence is within 10 cases per 100,000 population each, while the incidence of leptospirosis and tularemia is close to zero.
The fourth type (Fig. 3) is similar to that in 1997 (Fig. 2) (less than seven cases per 100,000 population); the highest incidence is observed for ITBB and it is lower for HFRS (about two cases per 100,000 population). The incidence of TBE is less than 1.5 cases per 100,000 population and is close to zero for leptospirosis and tularemia. This type is typical of the Northwestern (the Arkhangelsk, Leningrad, Murmansk, Novgorod, and Pskov Regions; the Republic of Karelia and St. Petersburg) and the Central (the Belgorod, Vladimir, Lipetsk, and Ryazan Regions) Federal Districts.
The fifth type has a very low incidence of all five diseases (does not exceed one case per 100,000 population, on average). It includes the Nenets Autonomous District and the Komi
Republic (the Northwestern Federal District); the Voronezh, Kursk, Moscow, Oryol, Tambov, and Tula Regions; Moscow (the Central Federal District); the Astrakhan, Volgograd, and Rostov Regions; the Republics of Kalmykia and Crimea (the Southern Federal District); and the Republics of the Northern Caucasus.
Considering the entire studied period (19 years), the first type includes only one region — the Republic of Udmurtia, with a high incidence of HFRS, TBE, and ITBB, and an extremely low incidence of leptospirosis and tularemia (Fig. 4).
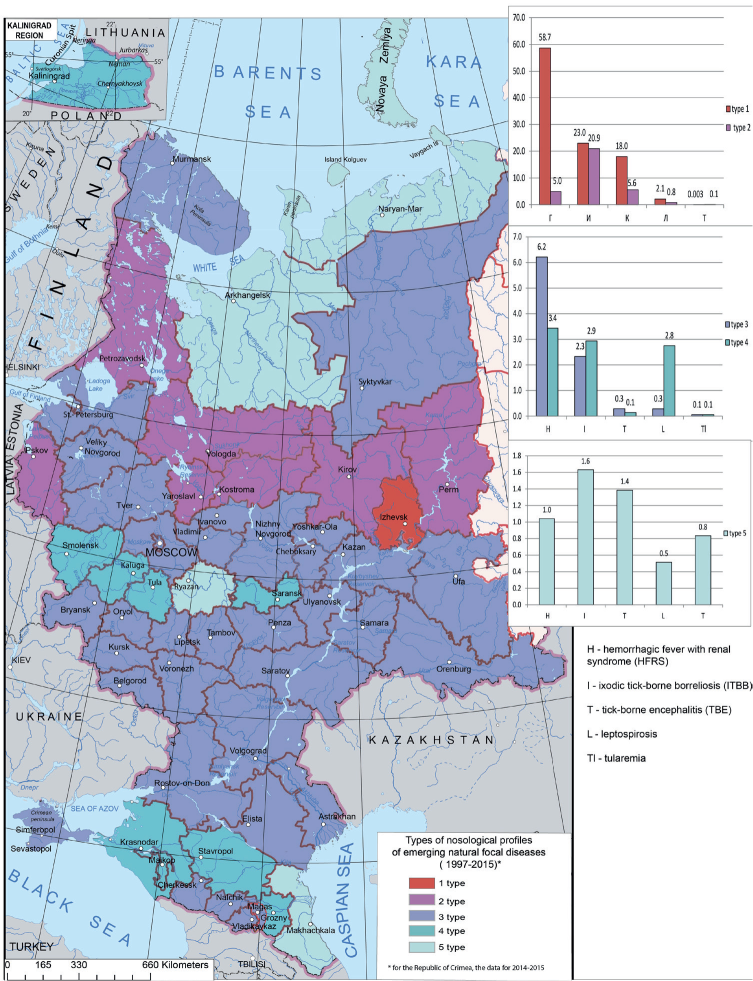
Fig. 4. The types of nosological profiles of emerging and re-emerging natural focal diseases in European Russia over 19 years (1997–2015)
The second type has a lower incidence of diseases in general. The TBE incidence is slightly lower than in the first type (about 21 cases per 100,000 population); the HFRS incidence is about five cases per 100,000 population. The incidence of leptospirosis and tularemia is close to zero. This type is typical of the TUs located in the north of the Volga Federal District (the Kirov Region and Perm Territory), the Northwestern Federal District (the Vologda, Murmansk, and Pskov Regions), and the north of the Central Federal District (the Kostroma and Yaroslavl Regions) (Fig. 4).
The third type is characterized by a low incidence of all five diseases in general (about seven cases per 100,000 population); at that, the incidence of HFRS is higher (six cases per 100,000 population) and it is lower for TBE and ITBB (below one and about two cases per 100,000 population, respectively). The incidence of leptospirosis and tularemia is close to zero. This type includes the majority of European Russia's TUs in various Federal Districts.
The fourth type is also characterized by a generally low incidence of the diseases (about four cases per 100,000 population). The incidence of HFRS, ITBB, and leptospirosis is about three cases per 100,000 population; the incidence of TBE and tularemia is close to zero. The cluster includes the following TUs — the Kaliningrad Region (the Northwestern Federal District), the Kaluga, Smolensk and Tula Regions (the Central Federal District), the Republic of Mordovia (the Volga Federal District), the Krasnodar and Stavropol Territories, the Republic of Adygea and the Chechen Republic (the Southern and North Caucasian Federal Districts).
The fifth type of the nosological profile includes the TUs with a generally low (not exceeding 1.6 cases per 100,000 population) incidence of all five infections, but with a slightly higher incidence of TBE and ITBB. This type includes the Arkhangelsk Region and the Nenets Autonomous District (the Northwestern Federal District), the Ryazan Region (the Central Federal District), and the Republic of Dagestan (the North Caucasian Federal District).
Analysis has thus demonstrated that the nosological profiles of the emerging natural focal infectious diseases in the regions vary by year; the incidence depends on the climatic conditions in each particular year and the extent of deratization and other preventive measures. In general in the studied period, the third type was prevalent — the incidence of all considered infections was low with a somewhat higher incidence of HFRS. The exception is the Republic of Udmurtia (the first type prevailing) where there is a consistent high incidence of HFRS, TBE, and ITBB, as well as seven TUs located farther north and characterized by a high incidence of ITBB. The type with a very low incidence encompasses four TUs located in the north of European Russia (the Arkhangelsk Region and the Nenets Autonomous District), in the central part (the Ryazan Region), and in the south (the Republic of Dagestan) (Fig. 4).
Types of dynamics
The conducted typological classification of the incidence dynamics for all nosological forms considered, allowed isolation of five types of the TUs with specific incidence dynamics.
Hemorrhagic fever with renal syndrome. The types of HFRS dynamics are shown in Fig. 5. The first type is characteristic of two regions — the Republics of Udmurtia and Bashkortostan. The highest incidence in these regions is recorded in 1997 (about 180 cases per 100,000 population). The incidence rises every two to four years and it is rather high in general (20 cases per 100,000 population). In 2015, the incidence is 80 cases per 100,000 population.
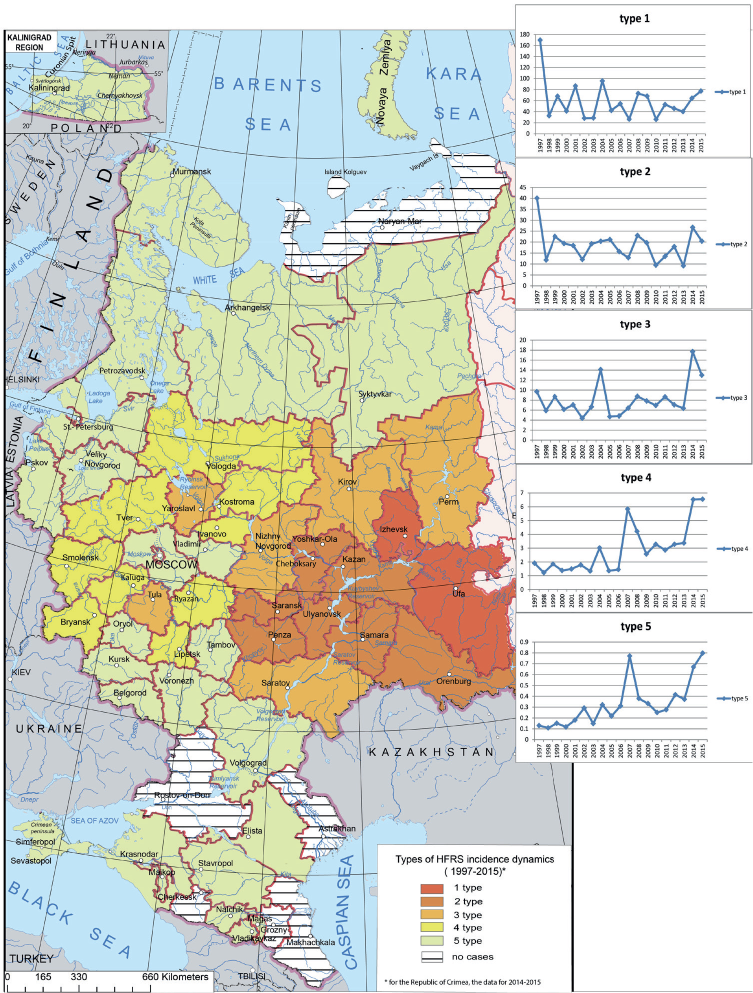
Fig. 5. The types of the HFRS incidence dynamics in European Russia
The second type is characteristic of some TUs of the Volga Federal District (the Orenburg, Penza, Samara, and Ulyanovsk Regions; the Republics of Mari El, Mordovia, Tatarstan, and Chuvashia), where incidence is slightly lower than in the first type — the maximum number of cases recorded in 1997 is about 40 per 100,000 population; the incidence rises every two to six years. The last maximum (25 cases per 100,000 population) is recorded in 2014.
The third type encompasses the rest of the Volga Federal District (the Kirov, Nizhny Novgorod, and Saratov Regions, and the Perm Territory) and some TUs of the Central Federal District (the Yaroslavl and Tula Regions). This type exhibits a relatively low incidence (not exceeding 20 cases per 100,000 population) with two peaks in 2004 and 2014. The incidence rises slightly every two to four years. Recently, there has been a trend towards an increase in the number of cases.
The fourth type, which includes one TU of the Northwestern Federal District (the Vologda Region) and part of the Central Federal District (the Bryansk, Ivanovo, Kaluga, Kostroma, Lipetsk, Ryazan, Smolensk, and Tver Regions), has a low incidence, with, however, a clear growing trend; for this type, a higher incidence is observed in 2004, 2008, and 2014-2015.
The fifth type includes most of the TUs of the Northwestern and Central Federal Districts, as well as all the TUs of the Southern and Northern Caucasus Federal Districts. The incidence is low (in some cases it is zero), but there are two peaks in 2007 and 2015 with a general growing trend. Thus, the regions with a high incidence of HFRS and the peak in 1997 include the TUs of the Volga Federal District (the first and second types). In the regions where the incidence is minimal and the cases are recorded irregularly (the fourth and fifth types), two small outbreaks are observed in 2007 and 2015, and the incidence exhibits a clear growing trend. A relatively low incidence is associated with the third-type TUs; they are characterized by frequent incidence fluctuations, while maintaining a clear upward trend.
Tick-borne encephalitis. European Russia has TBE-free areas; cases are recorded mainly in the Northwestern, south of the Central, and the Volga Federal Districts (Fig. 6). The first type is characterized by a high incidence in 19971999 (up to 45 cases per 100,000 population), followed by a sharp decline, which continues to this day. In 20132015, the incidence did not exceed 10 cases per 100,000 population. Two TUs are in this type, namely, the Republic of Udmurtia and the Perm Territory.
The second type, which includes TUs of the Northwestern (the Arkhangelsk and Vologda Regions, and the Republic of Karelia), the Central (the Kostroma Region), and the Volga (the Kirov Region) Federal Districts, is characterized by a lower incidence — the number of cases does not exceed 12 per 100,000 population. The incidence undulates with a slight growing trend and two peaks in 2003 and 2009.
The third type has a low incidence and includes most of the TUs of the Northwestern (the Kaliningrad, Leningrad, Novgorod, and Pskov Regions, the Republic of Komi, and St. Petersburg) and the Central (the Yaroslavl Region) Federal Districts. The incidence is undulant with rises every three years. A small outbreak is recorded in 2003.
The fourth type encompasses the regions with a low incidence, generally not exceeding 0.5 cases per 100,000 population; the fluctuations are insignificant. This type includes the northern TUs of the Northwestern (the Murmansk Region, the Nenets Autonomous District), the Central (the Tver and Ivanovo Regions) Federal Districts, and the Volga (the Nizhny Novgorod, Orenburg, Samara, and Ulyanovsk Regions, the Republics of Bashkortostan, Mariy- El, and Tatarstan) Federal Districts. Over the 19-year period, there is a slight declining trend (Fig. 6).
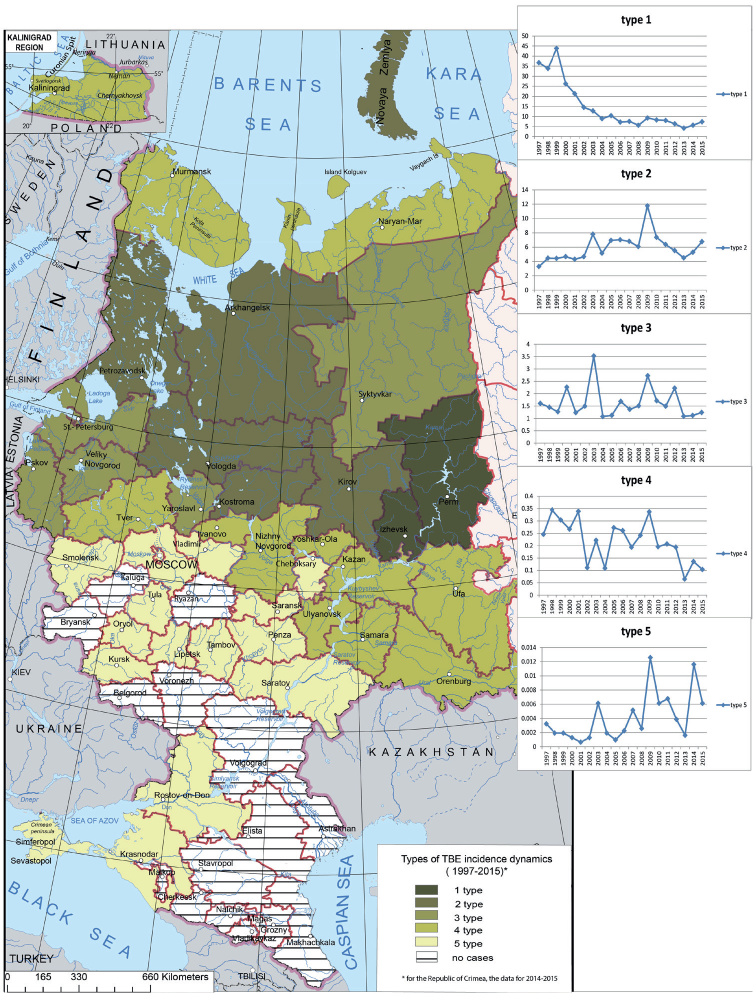
Fig. 6. The types of the TBE incidence dynamics in European Russia
The fifth type, which includes most of the TUs of the Central and some TUs of the Volga and Southern Federal Districts, has an extremely low incidence. TBE is not endemic in most of these regions and it is possible that the statistics includes a certain percentage of imported cases. Over the considered period, dynamics slighly increases and undulates; there are two pronounced peaks — in 2009 and 2014.
Thus, in the TUs associated with the first-type of dynamics the incidence decreases towards the end of the studied period. In other clusters, a slight growing trend is recorded in 1997-2015. The TBE outbreaks are registered in 1999, 2003, and 2009 in all TUs, except for those in the first-type cluster.
Ixodic tick-borne borreliosis. The ITBB cases are recorded in most of the TUs of European Russia (Fig. 7). The first type is characteristic of the Vologda, Kirov, Kostroma, and Yaroslavl Regions and the Republic of Udmurtia. This type is characterized by a high incidence and rises every two to four years. In the past five years, there has been a slight downward trend in incidence with the last major increase in 2009.
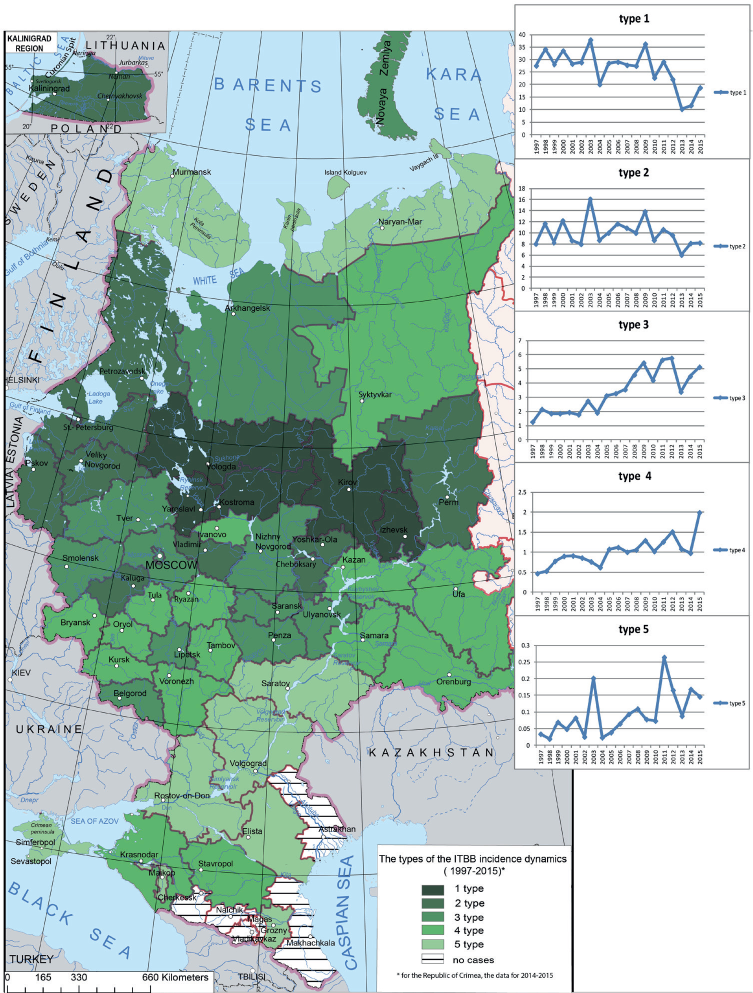
Fig. 7. The types of the ITBB incidence dynamics in European Russia
The second type is characteristic of the Northwestern (the Kaliningrad, Leningrad, Novgorod, and Pskov Regions, the Republic of Karelia, and St. Petersburg), the Central (the Vladimir and Kaluga Regions), and the Volga (the Republics of Mariy-El and Chuvashia and the Perm Territory) Federal Districts. The incidence is generally low but rises every two to four years; the maximum is recorded in 2003. In the past few years, there has been a downward trend.
The third type is characteristic of the Northwestern Federal District (the Arkhangelsk Region), the Central Federal District (the Belgorod, Lipetsk, Moscow, Smolensk, and Tver Regions, and Moscow), and some TUs of the Volga Federal District (the Nizhny Novgorod, Penza, Saransk, and Ulyanovsk Regions). The incidence is also low with a noticeable upward trend over the 19-year period (from one case per 100,000 population in 1997 to five-six cases per 100,000 population in 2012-2015). Small rises and falls in incidence are observed every two to four years and the last minimum is registered in 2013.
The fourth type is characterized by an even lower incidence — it does not exceed three cases per 100,000 population, on average. This type has a growing trend with small ups and downs every two to four years. It includes a fairly large part of European Russia — the Komi Republic in the Northwestern Federal District, the TUs of the Central and Volga Federal Districts, and the Krasnodar and Stavropol Territories.
The fifth type is characterized by an extremely low, close to zero, incidence and includes the Murmansk Region and he Nenets Autonomous District in the north of European Russia. It also includes the Saratov, Volgograd, and Rostov Regions, and the Republics of Adygea, Kalmykia, Crimea, and Chechen in the central and southern parts of European Russia. The incidence generally increases over the studied period with ups and downs every two to five years.
Thus, the areas with the first two types of dynamics have a relatively high incidence with an upward trend; they are located predominantly in the Northwestern (except for its northern part) and in the northern part of the Volga and the Central Federal Districts. The areas with other types have low incidence that increases over the studied period. These regions are located mostly in the north of the Northwestern Federal District, in the Central Federal District, in the south of the Volga Federal District, and in the Southern and North Caucasian Federal Districts.
Tularemia. There have been tularemia outbreaks practically in all areas of European Russia (Fig. 8). The first type includes TUs with a medium incidence (about one case per 100,000 population). However, in 2005 in these TUs, there is a large outbreak with six cases per 100,000 population. This type includes the Ryazan Region and the Republic of Kalmykia
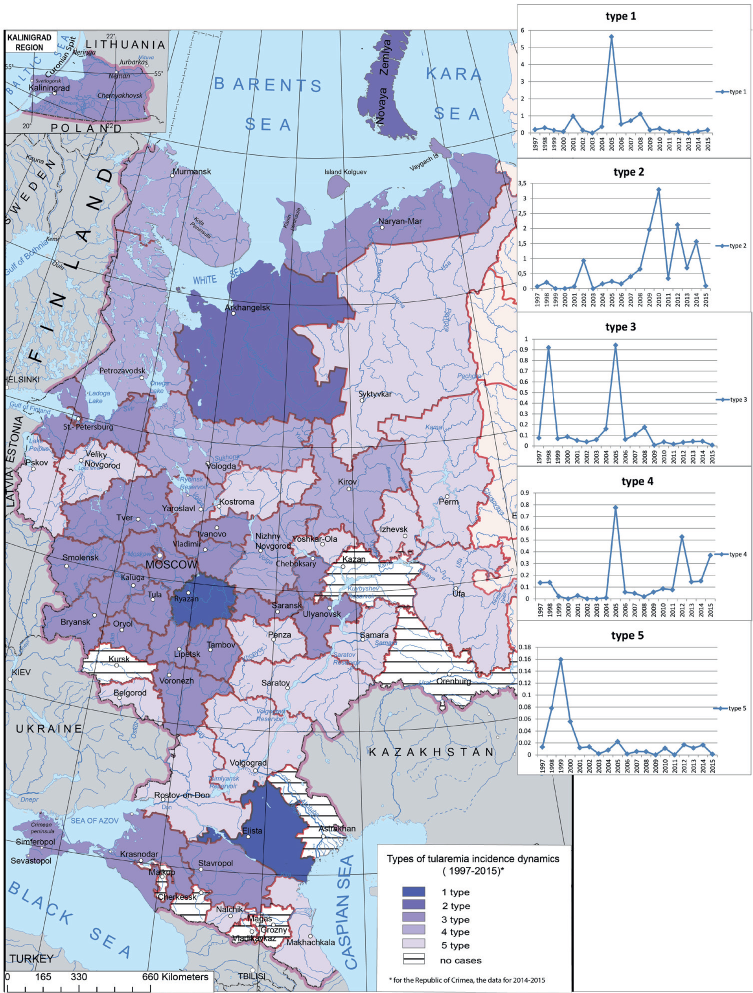
Fig. 8. The types of the tularemia incidence dynamics in European Russia
The second type is characteristic of the Arkhangelsk Region with a generally low incidence (close to zero) increasing after 2008. Small outbreaks are recorded in 2002, 2010, 2012 and 2014, with not more than 3.5 cases per 100,000 population.
The third type encompasses some TUs of the Northwestern (the Kaliningrad and Leningrad Regions, the Nenets Autonomous District, and St. Petersburg), most TUs of the Central Federal District, and the Krasnodar and Stavropol Territories. There, the incidence does not exceed one per 100,000 population. As a rule, it is within zero to 0.2. However, relative increases are recorded in 1998 and 2005, though the number of cases does not exceed one per 100,000 population.
The fourth type is characterized by the increasing incidence. This type includes the Vologda, Murmansk, Nizhny Novgorod, Kirov, Yaaroslavl Regions, and the Republics of Karelia and Crimea. The incidence is relatively low; however, there are two small outbreaks in 2005 and 2012 with the number of case not exceeding one per 100,000 population. The fifth type covers various TUs throughout European Russia and also includes the TUs with no cases in 1997-2015. The incidence is low with a small peak in 1999.
Thus, in 2005, there has been a marked rise in the incidence in the clusters ofTUs with the first, third, and fourth types of dynamics and a small rise in the TUs with the fifth type. Despite the fact that within the entire European Russia, the incidence is generally low, relatively noticeable incidence rises, or "flares," varying in magnitude and frequency, are recorded for all types of dynamics.
Leptospirosis has been recorded practically in all parts of European Russia. However, the incidence is relatively low (Fig. 9). The first type encompasses TUs with the highest incidence — in the Republic of Mordovia and the Krasnodarsky Territory. This type is characterized by three marked peaks in 1997, 2002 and 2004, attributed to the increase in the number of small rodents (the principle carriers of this infection). Over the 19-year period, the incidence is decreasing and in certain years, it is close to zero. Such a trend can be explained by the mainstream use of next-generation vaccines (Ananyana 2010).The incidence of the second type is lower than of the first. This type includes the Volga and Kaliningrad Regions (the Northwestern Federal District), the Kaluga, Smolensk, Yaroslavl, and Tula Regions (the Central Federal District), the Ulyanovsk Region, the Republic of Udmurtia, and the Perm Territory (the Volga Federal District) and the Republic of Adygeya (the Southern Federal District). In 1997-2015, the incidence is decreasing with one large outbreak in 2004.
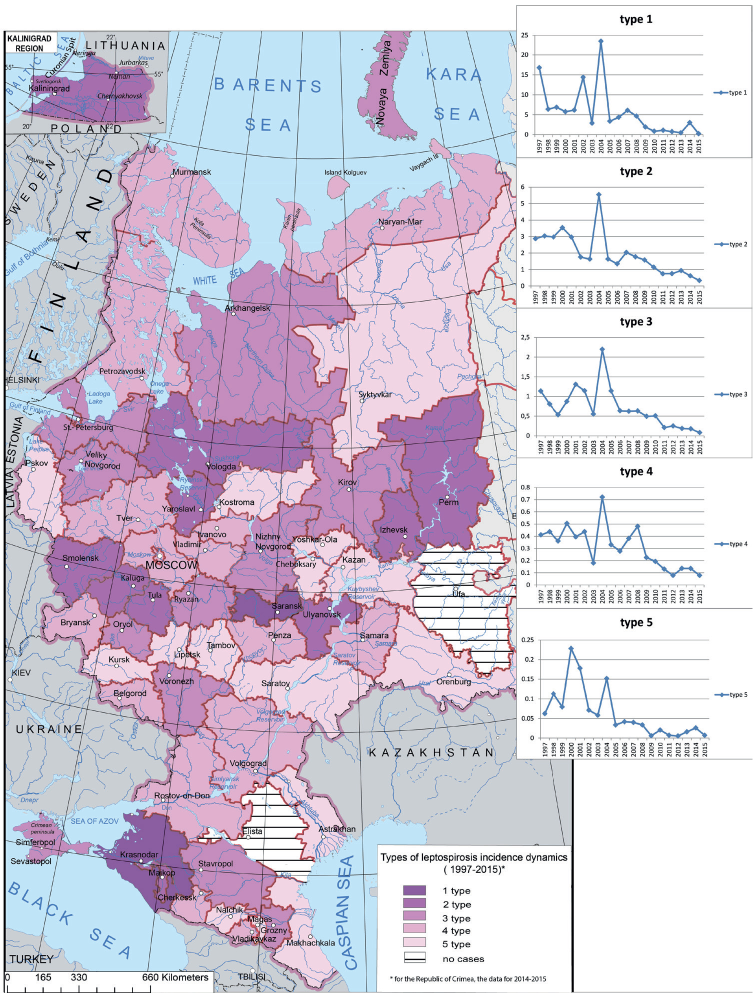
Fig. 9. The types of the leptospirosis incidence dynamics in European Russia
The third type is found is all Federal Districts — the Archhangelsk, Voronezh, Kirov, Leningrad, Nizhny Novgorod, Novgorod, Orlov, and Ryazan Regions, the Republic of Crimea, and the Stavropol Territory. The general incidence in these regions is even lower (does not exceed 2.5 cases per 100,000 population). There are two clear rises in the incidence in 2001 and 2004. In the last years, the incidence is close to zero. Overall in the studied period, there is a clear downward trend.
The fourth and fifth types are registered in the most of European Russia. The fourth type includes the Belgorod, Bryansk, Vladimir, Volgograd, Ivanov, Murmansk, Moscow, Penza, Samara, and Tver Regions, and the Republics of Karachaevo-Cherkessia and North Ossetia. The incidence is lower than in the third type (one case per 100,000 population, on average). There are two small outbreaks in 2004 and 2008. Over the studied period, the incidence is decreasing and in the last years it approached zero, which is associated with mainstream vaccination (Ananyana 2010).
The fifth type that also covers all Federal Districts of European Russia is characterized by even lower incidence. There are two outbreaks in 2000 and 2004 (about 0.2 cases per 100,000 population) over the studied period. Between the outbreaks, the incidence is almost zero. It is possible that certain number of cases in this type of dynamics can be attributed to imported cases.
Despite the general decreasing incidence trend in all five types of dynamics, each type has characteristic outbreaks that differ in magnitude and frequency. In 2004, the leptospirosis incidence went up (an outbreak) in all dynamics clusters.
Thus, the typological classification of the multi-year temporal data series allowed isolating the clusters of TUs with similar dynamics patterns. The incidence of HFRS and ITBB exhibits a clear growing trend over the last years. The TBE incidence is lower than at the end of the XXth century, however, it increases in some TUs. There are outbreaks of leptospirosis and tularemia, but in general, their incidence is low.
CONCLUSION
The use of formal techniques of mathematical- cartographical modeling allowed us to implement the formal classification of the nosological profiles (i.e., sets of diseases) using the multi-year temporal data series for five emerging natural focal diseases of European Russia. This classification of the incidence in 1997-2015 yielded five types of the nosological profiles. These types vary by years, which is associated with the dependence of the incidence on climatic conditions in each specific year and on extent of deratization and preventive measures.
Furthermore, the classification allowed breaking the regions into the groups with similar patterns of dynamics. Five types of dynamics patterns were identified. Each type is characterized by periodic outbreaks varying in magnitude and frequency.
The results obtained can be used to forecast potential epidemiological outbreaks and to develop targeted and appropriate for each region measures. Automated classification algorithms, certain standard programs, and appropriate skills are crucial in modern research and practice.
References
1. Ayvazyan S.A., Yenyukov I.S., Meshalkin L.D. (1985). Applied statistics: A study of dependencies. Finance and Statistics
2. Ayvazyan S.A., Bukhshtaber V.M., Yenyukov I.S., Meshalkin L.D. (1989) Applied statistics: Classification and reduction of dimension. Finance and Statistics.
3. Ananyana Yu. V. (2010). Leptospirosis of people and animals: the spread of trends and the problems of prevention // Epidemiology and Preventive Vaccination, №. 2, pp. 13-16.
4. Feldman E.S. (1977). Medical and geographical study of the territory of Moldova. Kishenev, Shtiintsa.
5. Jones K.E., Patel N.G., Levy M.A., et al. (2008). Global trends in emerging infectious diseases // Nature, Vol. 451, №7181, pp. 990-993.
6. Kapralov E.G., Koshkarev A.V., Tikunov V.S., et al. (2010). Geoinformatics. In 2 books. University Texbook. V.S.Tikunov (Ed.). 3rd ed., Revised and corrected edition. Moscow: Academia.
7. Keller A.A. (1992). Medico-geographical approach to the study of regional health // Medico-geographical aspects of assessing the level of public health and the environment. SPb, pp. 37-45.
8. Kurolap S.A., Klepikov O.V., Vinogradov P.M. (2015). Integrated environmental assessment of the urban environment. Voronezh: Scientific book.
9. Malkhazova S.M. (2001). Medico-geographical analysis of territories: mapping, assessment, forecast. Moscow: Scientific world.
10. Malkhazova S.M., Mironova V.A. (2017). The problem of new and recurring infections: the task of medico-geographical study // Bulletin of Voronezh State University. Series: Geography. Geoecology, №1, pp. 21-31.
11. Malkhazova S.M., Mironova V.A., Pestina P.V., Orlov D.S. (2016). Emerging and re-emerging infections in Russia: the medico-geographical aspect // Moscow University Bulletin. Series 5: Geography, №5, pp. 24-32.
12. Malkhazova S.M., Pestina P.V., Shartova N.V. (2017). Public Health in the Regions of Russia at the Beginning of the XXI Century: MedicoGeographical Assessment // Reports of the Academy of Sciences, V. 475, №.3, pp. 329-332.
13. Malkhazova S. M. Mironova V.A., Shartova N.V., Orlov D.S. (2019). Mapping Russia’s Natural Focal Diseases: History and Contemporary Approaches. Springer International Publishing
14. Morse S.S. (1995). Factors in Emergence of Infectious Diseases // Emerg. Inf. Dis., pp. 7-15
15. Tikunov V.S. (1983). Algorithm for modeling the thematic content of typological maps. – Vestn. Mosc. Univer., Ser. Geogr, №4, pp. 78-84.
16. Tikunov V.S. (1989). Classification and mapping of fuzzy geographic systems. – Vestn. Mosc. Univer. Ser.5. Geogr., №3, pp. 16-23.
17. Tikunov V.S. (1997). Classifications in geography: renaissance or fading?. Smolensk: SSU
18. Trofimov A.M., Zabotin Ya.I. Panasyuk M.B., Rubtsov V.A. (1985). Quantitative methods of regionalization and classification. Kazan, 120 p.
19. Zadeh L.A. (1965). Fuzzy sets. // Information and Control, 1965, V. 8, pp. 338-353.
About the Authors
Svetlana M. MalkhazovaRussian Federation
Moscow
Polina V. Pestina
Russian Federation
Moscow
Vladimir S. Tikunov
Russian Federation
Moscow
Review
For citations:
Malkhazova S.M., Pestina P.V., Tikunov V.S. Emerging and re-emerging natural focal diseases of European Russia (typological classification of nosological profiles and dynamics of incidence). GEOGRAPHY, ENVIRONMENT, SUSTAINABILITY. 2020;13(1):115-127. https://doi.org/10.24057/2071-9388-2019-61


