


Contents
Scroll to:
https://doi.org/10.24057/2071-9388-2019-52
Scroll to:
Bosch J., Iglesias I., Martínez M., de la Torre A. Climatic and topographic tolerance limits of wild boar in Eurasia: implications for their expansion. GEOGRAPHY, ENVIRONMENT, SUSTAINABILITY. 2020;13(1):107-114. https://doi.org/10.24057/2071-9388-2019-52
The environmental tolerance of a species determines to a great extent its area of distribution, and is a result of the evolutionary process and environmental adaptations (Wiens and Graham 2005). The physiological limitations of a species are directly influenced by environmental conditions, mainly temperature, precipitation and humidity. Environmental variables and population factors interact in complex ways to influence species establishment in certain areas, survival and reproduction rates (Wiens and Graham 2005).
A good example of this dynamism is the wild boar (Sus scrofa), a species of great ecological plasticity. During the last century, its demographic growth has been exponential and continuous in Europe and many parts of the Palearctic (Lucchini et al 2005; Bosch et al. 2016; Parchizadeh 2017; Markov et al 2018). Wild boar have colonized new biotopes, natural and human-transformed (Markov et al. 2018). The worldwide increase in wild boar populations has led to numerous conflicts due to agricultural damages, problems in the conservation of natural areas, and threats to animal health. Wild boar are also increasingly present in human environments, invading urban areas and generating conflicts such as traffic accidents, attacks on people and pets, and health problems (Massei et al. 2015). Proper management of this growing wild boar population requires knowing its geographical distribution.
Wild boar can act as a reservoir for many transboundary diseases, such as classical swine fever and African swine fever (ASF), as well as zoonotic diseases such as tuberculosis or brucellosis, all with a high economic impact (Malmsten et al. 2017). Since 2007, ASF has been spreading across nearly the entire Eurasian territory, affecting 10 countries in the European Union (Iglesias et al. 2018; OIE 2018) and generating large losses in the global pig sector. Health authorities have emphasized the need for proper population control of boar in order to manage ASF, yet surveillance efforts remain inadequate (ECA 2016; EFSA 2018).
Models of species distribution can help to improve population and health management of wild animal populations (Ehrlen and Morris 2015; Bosch et al. 2016). To be useful, these models must include accurate information about wild species and related diseases. Biological records about wild boar have begun to be collected in a more uniform way through initiatives such as EUROBOAR, GBIF and Enetwild. Most of these initiatives are based on the distribution of wild boar within the area described by the International Union for the Conservation of Nature (IUCN) (Oliver and Leus 2008). However, wild boar have recently been observed at many sites outside the IUCN-demarcated area (Bosch et al. 2016; Markov et al. 2018), suggesting the urgent need to update our understanding of wild boar distribution. In addition, the ranges and limits of environmental tolerance of this species have never been described on a global level.
Therefore, the objective of the present work was to describe the current limits of wild boar distribution in Eurasia, as well as identify the climatic and topographic tolerance limits and biogeographic scenarios that condition its habitat.
The current wild boar distribution in Eurasia, based on georeferenced occurrence data, was compared with the standard distribution maps from IUCN (Oliver and Leus 2008). Comparison focused on altitudinal distribution of wild boar, based on tolerance intervals for temperature and precipitation usually employed in wildlife distribution models, as well as on concepts in habitat quality and ecoregions (Sales et al. 2017).
The georeferenced occurrence of wild boar described by Bosch et al (2016) was updated using data from the following ecological and health sources from 2018: Global Biodiversity Information Facility (GBIF), World Organization for Animal Health, Veterinary European Transnational Network for Nursing Education and Training, and the Genbank of the US National Center for Biotechnology Information. A total of 37,655 instances of wild boar presence were reported from 1982 to 2018 at a spatial resolution <10 km (~97% from field data), and all were initially considered in the study. To reduce potential spatial autocorrelation, the density of points was reduced by "extracting” data located close together (<10 km) using the statistical software R (R Development Core Team, 2012). Consequently, 34,233 wild boar occurrences from the original 37,655 were ultimately included in the study.
Data on annual precipitation, precipitation during the driest month, and minimum and maximum temperatures during the coldest and warmest months were obtained from WorldClim (1950-2000) at a spatial resolution of 5 arc-minutes (~10 km) (Hijmans et al. 2005). Data on altitude were gathered from a global digital elevation model (LP DAAC 2004) at a spatial resolution of 5 arc-minutes (~10 km). Quality of the available habitat (QAH) for wild boar was obtained from Bosch et al (2016), while data on terrestrial ecoregions were obtained from the digital Koppen- Geiger world map on climate classification (Rubel and Koottek 2006).
To describe the current limits of wild boar distribution in Eurasia, wild boar presence was compared with the IUCN map (Oliver and Leus 2008) using overlays generated with ArcGIS 10.2 ESRI® software. The percentages of wild boar occurrences that fell within the IUCN area or in four buffer zones extending 10 km, 100 km, 500 km and >500 km from the edge of the IUCN area. The buffer zones were generated using the proximity analysis tool in ArcGIS 10.2.
After layer overlay, wild boar presence at increasing altitude was determined. The altitude associated with each wild boar occurrence was extracted, and the results were classified into six groups (minimum, maximum, median, 5th percentile, 25th percentile, and 95th percentile) in order to describe the distribution of altitudes at which wild boar were present.
To describe the climatic limits that wild boar in Eurasia can tolerate and therefore that determine their habitat, wild boar occurrences were compared with the climatic variables selected by layer overlay. The value of each climatic variable associated with wild boar presence was extracted inside the IUCN area and in each of the four buffers, and the results were classified in six groups as previously explained. A similar analysis was performed to describe the biogeography of the wild boar habitat, in terms of QAH and ecoregions.
The comparison showed that 89.1% (n = 31,720) of wild boar occurrences fall within the IUCN area, while 1% (n = 364) lie inside the 10 km buffer. In this buffer, wild boar presence may be associated with metapopulation movements, given an average movement of 10.38 ± 2.84 km for animals at least 17 months old (Keuling et al. 2010). In fact, previous studies have shown that 7590% of wild boars are recaptured within 10 km of where they were first captured (Keuling et al. 2010).
The other 10% of wild boar occurrences fall outside the 10 km buffer: 8.4% in the 100 km buffer, 0.5% in the 500 km buffer, and 1% in the >500 km buffer (Fig. 1). These results indicate that wild boars are expanding in the Eurasian zone outside the traditional area described by the IUCN map, through their own movements as well as anthropogenic reintroductions. Below we look in greater detail at some countries showing evidence of settled wild boar populations outside the IUCN distribution area (Fig. 1).

Fig. 1. Map showing wild boar distribution in Eurasia according to the International Union for Conservation of Nature (IUCN) area and buffers at 10, 100, 500, and >500 km
In Russia, the largest percentage of wild boar occurrences outside the IUCN distribution area is located within the 100 km buffer in the western part of the country, at a latitude of 65° N (Fig. 1). Wild boar is also present at latitudes below 66° N, and permanently inhabited reproduction areas occur between 62° and 63° N; these areas are considered part of the geographical range of the species (Danilov et al. 2003; Markov et al. 2018). The natural expansion of the wild boar from the southwest to the north of Western Siberia may be due to the decrease in snow cover because of climate change, which can increase the availability of food (Bieber & Ruf 2005; Geisser and Reyer 2005; Melis et al. 2006; Spitz 1999; Powell 2004; Apollonio et al. 2010; Markov et al. 2018).
In Spain, wild boar occurrences outside the IUCN distribution area were found within the 100 km buffer. These expansion areas are distributed throughout the center, center-east, and south of the country, and they correspond mainly to valleys and river depressions used for agriculture. In Spain, as in other European countries, the growth of this species has been related to the following: reforestation (Servanty et al. 2011); disappearance of traditional agriculture and reduction of forestry activities; increase in shelter areas (Saenz de Buruaga 1995); and increase in areas dedicated to certain crops, particularly corn, similarly to what has been observed in Poland, Sweden, Germany, and Switzerland (Baettig 1985; Fruzinski 1995; Keuling et al. 2009; SaVd et al. 2011). Another important factor is the absence of predators (Massei and Genov 2004; Fernandez-Llario 2017).
In Sweden, wild boar occurrences outside the IUCN distribution lie mainly in the 100 and 500 km buffers, both corresponding to forests and agricultural areas (Fig. 1). Our results are in line with a study conducted in the southern and central part of Sweden in 2015, which showed an increase in the distribution and abundance of wild boar (Malmsten et al. 2017). This may be due to the high food availability in the wild and to environmental conditions favourable for reproduction.
In Belgium, the IUCN map covers only 2% of the country's surface. Wild boar occurrences are located in the 100 km buffer, and the distribution spreads throughout the country (Fig. 1). This country has recently been affected by ASF in wild boars, which creates risk of dispersion to neighbouring countries with large domestic pig production (OIE 2018). Our results suggest the need to include Belgium in analyses of wild boar distribution in order to improve population management, as well as improve efforts at ASF surveillance and control.
In Ireland, which is not included the IUCN distribution area, wild boar presences are located in the >500 km buffer, with distribution throughout the country, even at the southern border of Northern Ireland (Fig. 1) (NBDC 2018). Despite control programs implemented since 2008, the population of wild boar continues to expand (NBDC 2018).
Three other countries that are not included in the IUCN map but that show wild boar presence in the >500 km buffer in our analysis are the Philippines, Malaysia, and Indonesia, except the islands of Sumatra and Java (Fig. 1). In Southeast Asia, more taxa of wild pig populations exist than in other areas, including Sus cebifrons (Philippines), Sus celebensis (Sulawesi), and Sus barbatus (Indonesia and Malaysia). The most common taxon is the Eurasian boar (Susscrota) (Lucchini et al. 2005).
Traditionally, wild boar distribution has been described between 0 and 2400 m meters above sea level, although evidence of wild boar has been found in subalpine meadows above 2400 m in particular periods of the year (Markov 2018). Our results confirm the altitude range of 0-2400 m, but additionally show that the boar is present at altitudes below 0 and over 2400 m (Fig. 2). The highest altitudes above sea level showing the presence of wild boar are found in China and Southeast Tibet shrublands and meadows (3536 m), followed by altitudes above 2500 m in Iran (2728 m, Zagros mountains forest steppe), Philippines (2593 m, Mindalo montane rain forest), and Switzerland (2506 m, Alps conifers and mixed forest). Wild boar at altitudes below 0 m are found in Israel along the tectonic depression traversed by the Jordan River (-395 m) and in Russia. These results confirm wild boar presence in continental and coastal geographic depressions, as well as in great mountain ranges and high plateaus.
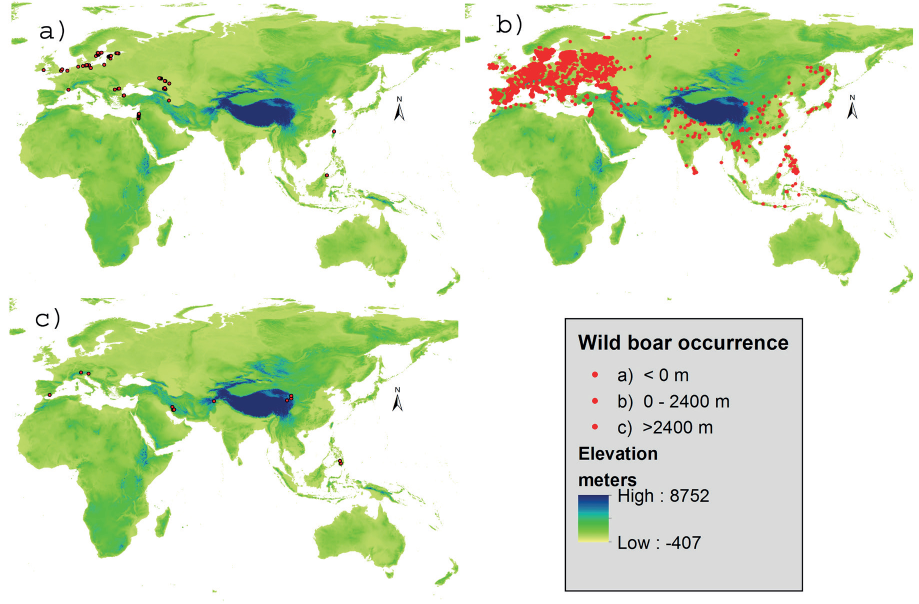
Fig. 2. Distribution of wild boar occurrences in Eurasia at altitudes lower than 0 m (a), between 0-2400 m (b), and higher than 2400 m (c)
Maximum and minimum values for climatic variables in areas containing wild boar did not vary significantly between the IUCN area and the buffers (Table 2). The only exception was the Eurasia zone, mainly the >500 km buffer, where the minimum temperature in the coldest month was lower in the IUCN area (-7 °C) than in the >500 km buffer (19.3 °C), as was the maximum temperature in the warmest month (23.2 °C vs. 33.2 °C). These differences confirm the ability of wild boar to adapt to living outside the traditional IUCN area, including in northern Eurasia, Western Siberia (Markov et al. 2018), Southeast Asia (Lucchini et al. 2005), and desert zones such as Iran (Parchizadeh 2017; Rezaei et al. 2018). Climatic factors can also influence population density over time by affecting the availability of food and shelter as well as reproductive potential (Fig. 3) (Ehrlen and Morris 2015).

Fig. 3. Biological cycle of wild boar associated with food and shelter availability and hunting season
A similar trend was observed for QAH inside and outside the IUCN area (Table 1). Wild boar was present mostly in natural areas (QAH 1.5-2.0) accounting for 70% of the territory inside the IUCN area and 60% of the territory outside the IUCN area, and in agroforestry areas (QAH 1.75) accounting for 17% and 15% of the respective territories. Natural habitats suitable for wild boar (mainly QAH 1.5) have become more available due to warmer summers and milder winters in traditionally colder areas (Fernandez-Llario 2017). This factor acts directly on the landscape connectivity, enhancing the migration of the species to areas such as the coniferous forests of northern Eurasia, and the Taiheiyo montane deciduous and evergreen forests in Japan (Bascompte and Sole 1996). Milder winters with little snow facilitate food access with lower energy expenditure, reducing mortality (Bieber and Ruf 2005; Rossi et al. 2011). Moreover, the increase in forest cover in Europe due to reforestation may have further facilitated the dispersal of wild boar (Servanty et al. 2011). The remaining wild boar occurrences are associated mostly with monocultures (QAH 1). Several factors have favoured the spread of wild boar and wild pigs (Lucchini et al. 2005) to previously unoccupied areas (Rosvold et al. 2008; Veeroja and Mannil 2014; Massei et al. 2015): changes in land use (Servanty et al. 2011); shelter offered by some crops such as corn, sunflower, rice, wheat or rapeseed (Herrero et al. 2006; Keuling et al. 2009); and the decrease in predator populations in some regions (Fernandez-Llario 2017, Jerina et al. 2014; Markov et al. 2019). As a result, wild boar are more abundant in European croplands (e.g. QAH 1 in the 500 km buffer), as well as in Southeast Asia.
Table 1. Wild boar presence by quality of available habitats (QAH) or ecoregion inside and outside the International Union for Conservation of Nature (IUCN) area. Results are expressed as percentages of the total number of occurrences
Wild boar presence vs. IUCN area | Quality of available habitats (QAH) | Total occurrence (n) | ||||||
|---|---|---|---|---|---|---|---|---|
2 | 1.75 | 1.5 | 1 | 0.5 | 0.1 | 0 | ||
IUCN+Buffer | 61% | 17.0% | 7.0% | 10.9% | 0.2% | 1.8% | 2.2% | 34,272 |
IUCN | 61.8% | 16.9% | 6.9% | 10.8% | 0.2% | 1.4% | 2.1% | 31,737 |
10 km | 44.9% | 26.4% | 7.2% | 16.3% | 0.3% | 2.8% | 2.2% | 363 |
100 km | 52.3% | 16.4% | 9.2% | 9.7% | 0% | 9.1% | 3.3% | 1,647 |
500 km | 39.5% | 11.4% | 11.9% | 27.6% | 0% | 2.7% | 7% | 185 |
>500 km | 52.9% | 25.0% | 2.6% | 16.8% | 2.6% | 0% | 0% | 340 |
| Ecoregion (according to Kottek et al, 2006) |
| ||||
Wild boar presence vs. IUCN area | Equatorial | Arid | Warm | Snow | Polar | Total occurrence (n) |
IUCN+Buffer | 1.4 | 3.3 | 57.7 | 37.5 | 0.01 | 34272 |
IUCN | 0.5 | 3 | 56.8 | 39.7 | 0.01 | 31737 |
10 km | 0 | 27.3 | 69.7 | 3.0 | 0 | 363 |
100 km | 0.3 | 6.4 | 83.2 | 10.1 | 0 | 1647 |
500 km | 0 | 0 | 64.9 | 35.1 | 0 | 185 |
>500 km | 93.5 | 0 | 4.1 | 2.4 | 0 | 340 |
The main ecoregions associated with wild boar presence are warm (present in 65% of boar occurrences) and snowy (present in 85%). Colonization of new arid ecoregions (27%) and new equatorial ecoregions (93%) is observed in 10 km and >500 km buffers (Table 1). The latter is especially true in Southeast Asia (>500 km buffer) (Fig. 4).
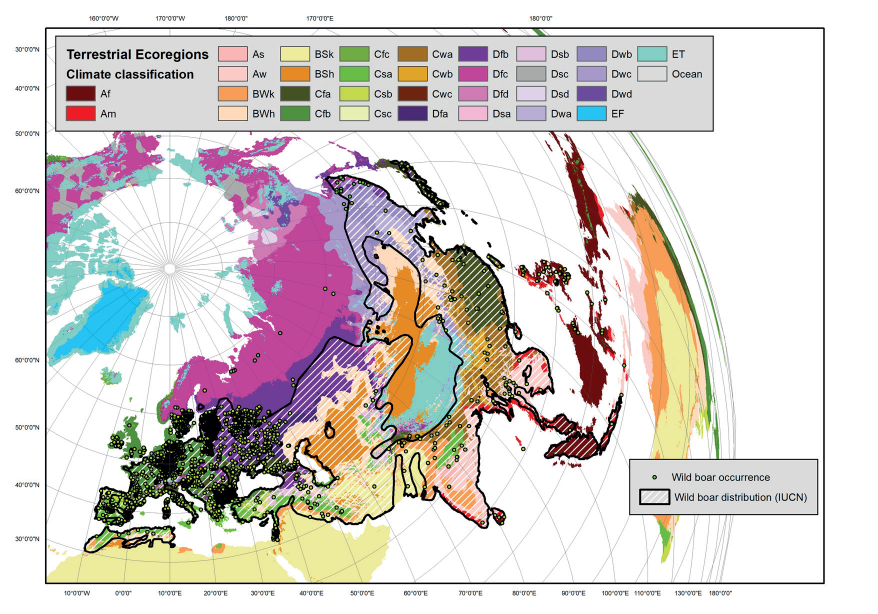
Fig. 4. Map of wild boar occurrences (dots) and wild boar distribution (lined area), by terrestrial ecoregions. Distribution was taken from the International Union for Conservation of Nature [Oliver and Leuss, 2008]. Ecoregions were defined based on the Koppen-Geiger climate classification [Kottek et al, 2006]
Abbreviations: At (equatorial, fully humid), Am (equatorial, monsoonal), As (equatorial, summer dry), Aw (equatorial, winter dry), BWk (arid, desert, cold air), BWh (arid, desert, hot air), BSh (arid, steppe, hot air), Cfa (warm temperate, fully humid, hot summer), Cfb (warm temperate, fully humid, warm summer), Cfc (warm temperate, fully humid, cool summer), Csa (warm temperate, summer dry, hot summer), Csb (warm temperate, summer dry, warm summer), Csc (warm temperate, summer dry, cool summer), Cwa (warm temperate, winter dry, hot summer), Cwb (warm temperate, winter dry, warm summer), Cwc (warm temperate, winter dry, cool summer), Dfa (snow, fully humid, hot summer), Dfb (snow, fully humid, warm summer), Dfc (snow, fully humid, cool summer), Dfd (snow, fully humid, extremely continental), Dsa (snow, steppe, hot summer), Dsb (snow, steppe, warm summer), Dsc (snow, steppe, cool summer), Dsd (snow, steppe, extremely continental), Dwa (snow, desert, hot summer), Dwb (snow, desert, warm summer), Dwc (snow, desert, cool summer), Dwd (snow, desert, extremely continental), EF (polar, polar frost), ET (polar, polar tundra).
Our analysis does have some limitations. Predicting the distribution of wild boar, or of any wild species, reflects sampling bias because of sampling variations across the study area (Ferrier 2002; Varela et al. 2011, 2014). More georeferenced wild boar records are required for latitudinal and longitudinal gradients, which may become available after several years (Varela et al. 2011) through initiatives including GBIF, EUROBOAR, Enetwild, and the Food and Agriculture Organization.
Permanent populations of wild boar exist outside the IUCN distribution area, with nearly 70% of animal occurrences lying within the first 100 km of the distribution limit. Wild boar have also been found in the >500 km buffer. Wild boar presence extends below sea level on continental and coastal geographical depressions and to altitudes higher than 2400 m.a.s.l. on great mountain ranges and highlands; the two types of "extreme" areas show similar environmental characteristics and habitat quality. Our results further suggest that the wild boar has entered new biotopes and ecoregions, such as the equatorial region, where its presence is mainly associated with the large Asian monocultures. The present study may more accurately define wild boar distribution in Eurasia than the conventional IUCN analysis, thereby helping to develop new models of species distribution, examine habitat selection, and identify permanent populations.
Table 2. Environmental variables in areas of wild board presence inside and outside the International Union for Conservation of Nature (IUCN) area (P=percentile)
| Minimum temperature during the coldest month (°C) | ||||||
|---|---|---|---|---|---|---|---|
Wild boar presence vs. IUCN area | min | P5 | P25 | median | P75 | P95 | max |
IUCN+Buffer | -33.9 | -10.2 | -8.9 | -7 | -2.4 | 6.9 | 23.3 |
IUCN | -26.3 | -10 | -9 | -7.2 | -2.7 | 6.5 | 22.7 |
Buffer 10 km | -14 | -5.2 | -3.8 | -2.3 | 0.7 | 3.8 | 10 |
Buffer 100 km | -19.3 | -8.3 | -7.4 | -3.7 | -2.2 | 2.7 | 19.4 |
Buffer 500 km | -18.9 | -14.7 | -13.9 | -6.8 | 4.3 | 2.7 | 3.4 |
Buffer >500 km | -33.9 | 6.9 | 18.2 | 19.3 | 20.6 | 22.7 | 23.3 |
| Maximum temperature during the warmest month (°C) | ||||||
Wild boar presence vs. IUCN area | min | P5 | P25 | median | P75 | P95 | max |
IUCN+Buffer | 9.2 | 20.8 | 21.6 | 23.3 | 27.1 | 31.8 | 45.5 |
IUCN | 9.2 | 20.9 | 21.6 | 23.2 | 26.6 | 31.4 | 45.5 |
Buffer 10 km | 19.8 | 21.6 | 27.8 | 29 | 29.7 | 31 | 42.4 |
Buffer 100 km | 19.5 | 20.5 | 20.9 | 27.8 | 29.2 | 30.8 | 40.9 |
Buffer 500 km | 17.6 | 18.5 | 19.7 | 20.9 | 23.1 | 23.9 | 29.6 |
Buffer >500 km | 17.4 | 19.1 | 31.4 | 32.5 | 33.2 | 33.3 | 34 |
| Annual precipitation (mm) | ||||||
Wild boar presence vs. IUCN area | min | P5 | P25 | median | P75 | P95 | max |
IUCN+Buffer | 53 | 469 | 566 | 624 | 658 | 991 | 5,495 |
IUCN | 57 | 472 | 565 | 626 | 658 | 897 | 5,495 |
Buffer 10 km | 132 | 386 | 498 | 599 | 612 | 688 | 1,596 |
Buffer 100 km | 53 | 409 | 568 | 596 | 631 | 864 | 1,804 |
Buffer 500 km | 352 | 526 | 568 | 605 | 638 | 1069 | 1,227 |
Buffer >500 km | 355 | 1,520 | 2,159 | 2,163 | 2,529.5 | 2,817 | 3,399 |
| Precipitation during the driest month (mm) | ||||||
Wild boar presence vs. IUCN area | min | P5 | P25 | median | P75 | P95 | max |
IUCN+Buffer | 0 | 1 | 25 | 28 | 33 | 48 | 192 |
IUCN | 0 | 0 | 25 | 28 | 32 | 45 | 121 |
Buffer 10 km | 0 | 7 | 15 | 30 | 38 | 40 | 68 |
Buffer 100 km | 0 | 8 | 26 | 28 | 30 | 41 | 76 |
Buffer 500 km | 11 | 24 | 26 | 28 | 35 | 64 | 74 |
Buffer >500 km | 8 | 25 | 48 | 51 | 64.5 | 134 | 192 |
1. Apollonio M., Andersen R. and Putman R. (2010). European Ungulates and Their Management in the 21st Century. New York: Cambridge University Press.
2. Baettig J.L. and Sáez-Royuela C. (1985). L’evolution demographique du sanglier (Sus scrofa) en Espagne. Mammalia, 49, 195-202. (in French).
3. Bascompte J. and Solé R.V. (1996). Habitat fragmentation and extinction thresholds in spatially explicit models. J. Anim. Ecol., 65, 465- 473.
4. Bieber C. and Ruf T. (2005). Population dynamics in wild boar Sus scrofa: ecology, elasticity of growth rate and implications for the management of pulsed resource consumers. J. Appl. Ecol., 42, 1203-1213.
5. Bosch J., Iglesias I., Muñoz M.J. and de la Torre A. (2016). A cartographic tool for managing African swine fever in Eurasia: mapping wild boar distribution based on the habitats. Transbound. Emerg. Dis., 64, 1720-1733.
6. Danilov P., Zimin V. and Ivanter E. (2003). Changes in the fauna and distribution dynamics of terrestrial vertebrates in the European north of Russia. Finnish Environ, 485, pp.175–181.
7. Ehrlén J. and Morris W.F. (2015). Predicting changes in the distribution and abundance of species under environmental change. Ecology letters, 18, 303-314.
8. European Court of Auditors, (2016). Special report no 06/2016: Eradication, control and monitoring programmes to contain animal diseases. Available at: https://www.eca.europa.eu/en/Pages/DocItem.aspx?did=36176 [Accessed 30 April 2019]. European Food Safety Authority (EFSA). (2018).
9. Epidemiological analyses of African swine fever in the European Union (November 2017 until November 2018). EJ EFSA journal. doi: 10.2903/j.efsa.2018.5494.
10. Fernández-Llario P. (2017). Jabalí–Sus scrofa. In: Carrascal L.M., Salvador A. and Luque-Larena J.J., eds., Enciclopedia Virtual de los Vertebrados Españoles. Madrid: Museo Nacional de Ciencias Naturales. Available at: http://www.vertebradosibericos.org/ [Accessed 30 April 2019].
11. Ferrier S. (2002). Mapping spatial pattern in biodiversity for regional conservation planning: Where to from here? Syst. Biol., 51, 331-363.
12. Fruzinski B. (1995). Situation of wild boar populations in Western Poland. J. Mount. Ecol., 3, 186-187.
13. Geisser H. and Reyer H.U. (2005). The influence of food and temperature on population density of wild boar Sus scrofa in the Thurgau (Switzerland). J. Zool., 267, 89-96.
14. Herrero J., García–Serrano A., Couto S., Ortuño V.M. and García-González R. (2006). Diet of wild boar Sus scrofa L. and crop damage in an intensive agroecosystem. Eur. J. Willd Res., 52, 245-250.
15. Hijmans R.J., Cameron S.E., Parra J.L., Jones P.G. and Jarvis A. (2005). Very high resolution interpolated climate surfaces for global land areas. Int. J. Climatol., 25(15), 1965-1978.
16. Iglesias I., Montes F., Martínez-Avilés M., Pérez A., Gogin A., Kolbasov D. and de la Torre A. (2018). Spatio-temporal kriging analysis to identify the role of wild boar in the spread of African swine fever in the Russian Federation. Spatial Statistics. DOI: 10.1016/j.spasta.2018.07.002.
17. Jerina K., Pokorny B. and Stergar M. (2014). First evidence of long–distance dispersal of adult female wild boar (Sus scrofa) with piglets. Eur. J. Willd Res., 60, 367-370.
18. Keuling O., Stier N. and Roth M. (2009). Commuting, shifting or remaining? Different spatial utilisation patterns of wild boar Sus scrofa L. in forest and field crops during summer. Mamm. Biol., 74, pp.145-152.
19. Keuling O., Lauterbach K., Stier N. And Roth M. (2010). Hunter feedback of individually marked wild boar Sus scrofa L.: dispersal and efficiency of hunting in northeastern Germany. Eur. J. Willd Res., 56, 159-167.
20. Lucchini V., Meijaard E., Diong C.H., Groves C.P. and Randi E. (2005). New phylogenetic perspectives among species of South-east Asian wild pig (Sus sp.) based on mtDNA sequences and morphometric data. J. Zool., 266, 25-35.
21. Malmsten A., Jansson G., Lundeheim N. and Dalin A.M. (2017). The reproductive pattern and potential of free ranging female wild boars (Sus scrofa) in Sweden. Acta Vet. Scand., 59, 52.
22. Markov N., Pankova N. and Filippov I. (2018). Wild boar (Sus scrofa L.) in the north of Western Siberia: history of expansion and modern distribution. Mamm. Res., 64, 1-9.
23. Markov N.I., Pankova N. L., Vasina A. L. and Pogodin N. L. (2019). Specific Features of Wild Boar, Sus scrofa, Rooting Activity at the Northern Boundary of Its Range in Western Siberia. Russian Journal of Ecology, 49(6), 584-587.
24. Massei G. and Genov P. 2004. The environmental impact of wild boar. Galemys, 16, 135-145.
25. Massei G., Kindberg J., Licoppe A., Gačić D., Šprem N., Kamler J., Baubet E., Hohmann U., Monaco A., Ozoliņš J., Cellina S., Podgórski T., Fonseca C., Markov N., Pokorny B., Rosell C. and Náhlik A. (2015). Wild boar populations up, numbers of hunters down? A review of trends and implications for Europe. Pest Manag. Sci., 71, 492-500.
26. Melis C., Szafranska P., Jędrzejewska B. and Bartoń K. (2006). Biogeographical variation in the population density of wild boar (Sus scrofa) in western Eurasia. J. Biogeogr., 33, 803-811.
27. National Biodiversity Data Centre, Ireland. (2018). Wild Boar (Sus scrofa), terrestrial distribution map. Available at: https://maps. biodiversityireland.ie/Species/TerrestrialDistributionMapPrintSize/119291. [Accessed 15 September 2018].
28. OIE, World Organisation for Animal Health. (2018). WAHID (World Animal Health Information System). Available at: http://www.oie.int/wahis_2/public/wahid.php/Diseaseinformation/reportarchive. [Accessed 30 April 2019].
29. Oliver W. and Leus K. (2008). Sus scrofa. The IUCN Red List of Threatened Species 2008: e.T41775A10559847. http://dx.doi.org/10.2305/IUCN.UK.2008.RLTS.T41775A10559847. Available at: www.iucnredlist.org. [Accessed 30 April 2019].
30. Parchizadeh J. (2017). Spatiotemporal distribution of large-and medium-sized mammals and humans in the Lar Protected Area, Iran. Willd Res., 44, 400-406.
31. Powell D.M. (2004). Pigs (Suidae). Mammals IV. In: D.G. Kleiman,V. Geist, and M. McDade, eds. Grzimek´s animal life encyclopedia, vol. 15. 2nd ed. Michigan: Gale Research Inc.
32. Rezaei S., Naderi S. and Karami P. (2018). An investigation on attitude of human local communities to wild boar (Sus scrofa, Linnaeus, 1758) in Jasb wildlife refuge, Markazi province, Iran. Available at: https://www.researchgate.net/publication/328424442_An_investigation_on_attitude_of_human_local_communities_to_wild_boar_Sus_scrofa_Linnaeus_1758_in_Jasb_wildlife_refuge_Markazi_province_Iran. [Accessed 30 April 2019]. (in Arabic with English summary).
33. Rossi S., Toigo C., Hars J., Pol F., Hamann J.L., Depner K. and Le Potier M.F. (2011). New insights on the management of wildlife diseases using mult–state recapture models: the case of classical swine fever in wild boar. PLoS ONE, 6, e24257.
34. Rosvold J. and Andersen R. (2008). Wild boar in Norway – is climate a limiting factor? – NTNU Vitenskapsmuseet Zoologisk Rapport, 1, 1-23.
35. Rubel F. and Kottek M. (2010). Observed and projected climate shifts 1901–2100 depicted by world maps of the Köppen-Geiger climate classification. Meteorologische Zeitschrift, 19, 135-141.
36. Sáenz de Buruaga M. (1995). Alimentación del jabalí (Sus scrofa castilianus) en el norte de España. Ecología, 9, 367-386. (in Spanish).
37. Saïd S., Tolon V., Brandt S. and Baubet E. (2011). Sex effect on habitat selection in response to hunting disturbance: the study of wild boar. Eur. J. Willd. Res., 58(1), 107-115.
38. Sales L.P., Ribeiro B.R., Hayward M.W., Paglia A, Passamani M. and Loyola R. (2017). Niche conservatism and the invasive potential of the wild boar. J. Anim. Ecol., 86, 1214-1223.
39. Servanty S., Gaillard J.M., Ronchi F., Focardi S., Baubet E. and Gimenez O. (2011). Influence of harvesting pressure on demographic tactics: implications for wildlife management. J. Appl. Ecol., 48, 835-843.
40. Spitz F. (1999). Sus scrofa (Linnaeus, 1758). In: T. Mitchell-Jones, G. Amori, W. Bogdanowicz, B. Krystufek, P.J.H. Reijnders, F. Spitzenverger, M. Stubbe, J. Thissen, V. Vohralíki, and J. Zima, eds., The Atlas of European Mammals, 2nd. Ed. London: T & AD Poyser.
41. Varela S., Lobo J.M. and Hortal J. (2011). Using species distribution models in paleobiogeography: a matter of data, predictors and concepts. Palaeogeogr. Palaeoclimatol. Palaeoecol., 310, 451-463.
42. Varela S., Anderson R.P., García-Valdés R. and Fernández-González F. (2014). Environmental filters reduce the effects of sampling bias and improve predictions of ecological niche models. Ecography, 37, 1084-1091.
43. Veeroja R. and Männil P. (2014). Population development and reproduction of wild boar (Sus scrofa) in Estonia. Wild. Biol. Pract., 10, 17-21.
44. Wiens J.J. and Graham C.H. (2005). Niche conservatism: integrating evolution, ecology, and conservation biology. Annu. Rev. Ecol. Evol. S., 36, 519-539.
Bosch J., Iglesias I., Martínez M., de la Torre A. Climatic and topographic tolerance limits of wild boar in Eurasia: implications for their expansion. GEOGRAPHY, ENVIRONMENT, SUSTAINABILITY. 2020;13(1):107-114. https://doi.org/10.24057/2071-9388-2019-52

Editor-in-Chief
Kasimov Nikolay S.Lomonosov Moscow State University
Moscow 119991 Russia, Leninskie Gory, Faculty of Geography, 1806a
Phone +7 495 939-15-52
Fax: + 7 495 939-15-52
E-mail: ges-journal@geogr.msu.ru


