


Contents
Scroll to:
https://doi.org/10.24057/2071-9388-2019-51
Scroll to:
Ogneva-Himmelberger Ye.A., Haynes M. Spatial patterns of adverse birth outcomes among black and white women in Massachusetts – the role of population-level and individual-level factors. GEOGRAPHY, ENVIRONMENT, SUSTAINABILITY. 2020;13(1):99-106. https://doi.org/10.24057/2071-9388-2019-51
Adverse birth outcomes (ABO), which include preterm deliveries (gestational age <37 weeks) and low birth weight deliveries (birth weight <=2,500 g) are a complex public health issue in the entire world. According to the World Health Organization, about 15 million babies are born preterm, and this number is on the rise, including in some high-income countries (World Health Organization 2018). In the U.S., the rate of preterm deliveries (PTD) in 2017 was 9.93% (up from 9.57% in 2014). For low birthweight (LBW) deliveries, the rate has also increased since 2014, rising from 8.00% to 8.28% in 2017 (Martin et al. 2018).
While the underlying cause of this increased prevalence of ABO is uncertain, potential hypotheses include a cultural transition to older age of women conceiving, increased use of assisted conception methods, and elevated prevalence of Cesarean sections and induced labor methods (American College of Obstetricians and Gynecologists 2016; Institute of Medicine 2007).
In the United States, the rate of PTD and LBW is higher in non-Hispanic black women than in non-Hispanic white women; rates of PTD and LBW in 2017 in black women were 13.93% and 13.89% while for white women they were 9.05% and 7.00% respectively (Martin et al. 2018). Despite many studies, the underlying causes of this disparity are not well understood (Burris and Hacker 2017; Kent et al. 2013; Lu and Halfon 2003; Manuck 2017).
Health risks associated with an ABO are severe and include an increased likelihood of respiratory problems, brain hemorrhage, heart complications, cerebral palsy, learning disabilities, and delayed motor and social skills (Centers for Disease Control and Prevention 2016; Clark et al. 2009; March of Dimes 2013; Rosenthal and Lobel 2011). Both PTD and LBW are also associated with increased infant mortality. According to the Center for Disease Control, PTD and LBW accounted for about 17% of infant deaths in 2015 (https://www.cdc.gov/reproductivehealth/maternalinfanthealth/pretermbirth.htm).
Previous studies have investigated the role that an individual woman's health status may have on birth outcomes. Their results showed that diabetes, hypertension, substance use, previous ABO, and lower socioeconomic status increase the risk of an ABO (American College of Obstetricians and Gynecologists 2016; Berghella 2007; Goldenberg and Culhane 2007; Honein et al. 2009). It is important to consider the individual mother's health circumstances, though modeling ABO through these variables alone often do not capture the full risk present during pregnancy.
Several studies used various regression techniques to analyze the relationship between ABO rates, mother-level health characteristics and population-level characteristics (income, poverty, education, racial composition, population density, and environmental exposures). The geographical scope and unit of analysis varied from counties for the entire U.S. (Carmichael et al. 2014; DeFranco et al. 2008) to just metropolitan areas (Kramer and Hogue 2018), to zip (postal) codes and regional units within a particular state or province (Insaf and Talbot 2016; Kent et al. 2013; (Meng, Thompson et al. 2013). Researchers found that among mother-level characteristics, previous PTD, chronic hypertension, low pre-pregnancy weight, diabetes, maternal smoking during pregnancy, and elevated maternal age at delivery were associated with the likelihood of an ABO. Among population- level characteristics, percent population in poverty, percent with low education level, racial composition, and racial segregation were found to be significantly correlated with PTD and LBW (DeFranco et al. 2008; Insaf and Talbot 2016; Kent et al. 2013; Kramer and Hogue 2008).
The mechanisms, or pathways, through which population-level factors are transferred to individual risk factors, are complex and not fully understood. Research suggests that psycho-social stressors, associated with low socio-economic status (stressful work and living environment, reduced levels of social and financial support, deprivation, low access to health care facilities, and exposure to physical hazards, etc.), have impact on individual feelings and lead to depression and to unhealthy behaviors, such as smoking, drinking, substance abuse, delayed prenatal care and poor diet. These stressors also cause changes in neuroendocrine and immunological processes, increasing the risk of adverse birth outcomes (Meng, Thompson et al. 2013).
Although previous studies have investigated potential correlations between both socioeconomic and health related variables and birth outcomes, none evaluated correlations using more than a decade of individual birth data for an entire state at a detailed spatial scale (census tract). Census tract is the smallest geographical unit for which detailed socio-economic information is available from the Census Bureau.
To address these gaps in previous research, this study aims to: (1) to analyze geographic variability of ABO among black and white women in the state of Massachusetts, and (2) to examine the relationship between individual, area-level socio-demographic, and health-related factors and ABO rates at census tract level. Massachusetts ranges from densely populated metropolitan areas (Boston) and their suburbs to sparsely populated rural areas in the west and presents a wide variety of environmental and sociodemographic conditions. The state is divided into 14 counties, consisting of 39 cities and 312 towns. In Massachusetts, the distinction between a city and a town is based on the form of government chosen by the residents (https://www.sec.state.ma.us/cis/cislevelsofgov/ciscitytown.htm).
We obtained individual birth data for 2000-2014 from the Massachusetts Department of Public Health and selected only singleton live births to non-Hispanic white and non-Hispanic black mothers for the analysis. Birth data were geocoded by the Department of Public Health to the census block level (the smallest enumeration unit in the U.S. Census). Six percent of births lacked census block information and were excluded from the analysis. Our final dataset included 725,582 births to white mothers, and 92,295 births to black mothers.
In order to facilitate the analysis of associations with socio-economic and demographic data, individual birth data was aggregated to census tracts. Census tract boundaries were obtained from the Office of Geographic Information, Commonwealth of Massachusetts (www.mass.gov/mgis/massgis.htm). There are 1472 census tracts with an average population of 4500 people in each census tract. The tracts that did not have any singleton live births to non-Hispanic white or non-Hispanic black mothers during the entire 15 years of study were excluded from the analysis, leaving 1467 census tracts for the analysis of births to white mothers, and 1449 tracts for the analysis of births to black mothers.
Each birth was assigned to a category based on birth weight and gestational age as follows: low birth weight (weight <= 2500 g) or normal birth weight (weight > 2500 g), and a full-term birth (gestational age >= 37 weeks) or preterm birth (gestational age < 37 weeks). A birth that was either preterm or low birth weight was considered an ABO. Total number of births and the number of ABOs for each census tract were calculated for the entire period (all 15 years combined).
Each birth record also contained mother-level data, such as mother's age, smoking during pregnancy, presence of gestational diabetes, gestational hypertension, chronic hypertension, and previous preterm delivery. Using this data, we calculated for each census tract the percentage of mothers who had these health conditions and percent of teenage (younger than 20 years) and older (older than 35 years) mothers, separately for non-Hispanic black and non-Hispanic white mothers. This data is summarized in Table 1.
Table 1. Mean and standard deviation (SD) values for population-level and individual-level variables
Variable | Description | Mean (SD) for White mothers | Mean (SD) for Black mothers |
|---|---|---|---|
Socioeconomic and demographic census variables | |||
High Education | Percent of individuals who possess an education level of a Bachelor's degree or higher | 37.25 (20.43) | |
Household Income | The median household income (US dollars) | 67909.50 (29364.16) | |
Low Education | Percent of individuals who possess an education level less than a high school diploma (or equivalent) | 14.17 (13.02) | |
Poverty | Percent of individuals living below poverty | 11.77 (11.77) | |
Per Capita Income | The average per capita income (US dollars) | 33616.47 (14764.74) | |
Unemployment | Percent of individuals who are unemployed | 7.73 (4.92) | |
Median Earnings | The median earnings for full time female employees | 45764.20 (12775.34) | |
Population Density | Population density (per square mile) | 7269.29 (10649.15) | |
Racial Composition* | Percent of individuals belonging to the corresponding racial group (either white or black) | 80.48 (20.85) | 6.50 (12.48) |
Individual-level health variables | |||
Diabetes* | Percent of mothers with gestational diabetes | 4.00 (1.64) | 3.47 (2.91) |
Pregnancy-Related Hypertension* | Percent of mothers with pregnancy-related hypertension | 3.90 (1.6) | 2.67 (2.53) |
Chronic Hypertension* | Percent of mothers with chronic hypertension | 1.36 (0.67) | 1.92 (1.85) |
Previous Preterm Infant* | Percent of mothers who delivered a previous infant who was preterm (<37 weeks gestational age) | 0.96 (0.76) | 0.79 (1.30) |
Cigarette Use* | Percent of mothers who smoked cigarettes at any point during the pregnancy | 8.67 (6.39) | 4.42 (5.04) |
Older Mom* | Percent of mothers who delivered a baby at an age greater than or equal to 35 years | 20.28 (5.55) | 11.30 (6.85) |
Teen Mom* | Percent of mothers who delivered a baby at an age less than 20 years | 4.10 (2.06) | 5.25 (4.81) |
*These variables were calculated for the specific racial group
To explore geographic variation of ABO outcomes in more detail, we obtained boundaries of urban, suburban, towns, and rural locales from the National Center for Education Statistics (https://nces.ed.gov/programs/edge/Geographic/LocaleBoundaries) and overlaid them with census tract boundaries. Urban locales corresponds to principal cities with population over 100 thousand people; suburban locales have population between 50 and 100 thousand people and are located within the urbanized area adjacent to principal cities; towns are locales with population between 2.5 and 50 thousand people, located outside an urbanized area; and rural locales are all remaining territories. For the purposes of this research, we included towns into rural category because in Massachusetts both are similar in population density and types of land uses. Thus, we designated each census tracts as either primarily urban, suburban, or rural.
Population-level socioeconomic and demographic factors relevant to this study - education level, income, race, population density - were obtained from the 2006-2010 American Community Survey and the 2010 Census at a census tract level (https://factfinder.census.gov/faces/nav/jsf/pages/index.xhtml). Table 1 provides detailed information about each variable. These variables were selected based on the findings of previous studies of ABO (Carmichael et al. 2014; DeFranco et al. 2008; Insaf and Talbot 2016; Kent et al. 2013; Kramer and Hogue 2008).
Raw ABO rates for each census tract were calculated for each census tract (dividing the number of ABO births by the total number of births), separately for both races. This approach produced potentially unreliable rates in areas with a small number of births. For example, if there were only two births in a census tract, and one of them was low birth weight, then the resulting ABO rate was 50%. This is often referred to as a "small numbers problem” or variance instability. One common approach to addressing this problem is to calculate adjusted, smoothed rates using Bayesian statistics. Using this approach, an estimate is obtained by combining the raw rates with "prior” information, such as the overall mean for the entire study area, i.e. an entire state (Anselin et al. 2006a). This smoothing method adjusts rates toward the overall mean, reduces variance instability, and produces robust and reliable rate estimates even for small samples (Kang et al. 2016; Mollalo et al. 2017). Adjusted ABO rates using Empirical Bayes smoother algorithm were calculated in the GeoDa software (Anselin et al. 2006b) for each census tract and these adjusted ABO rates were used in our analyses (Figure 1).
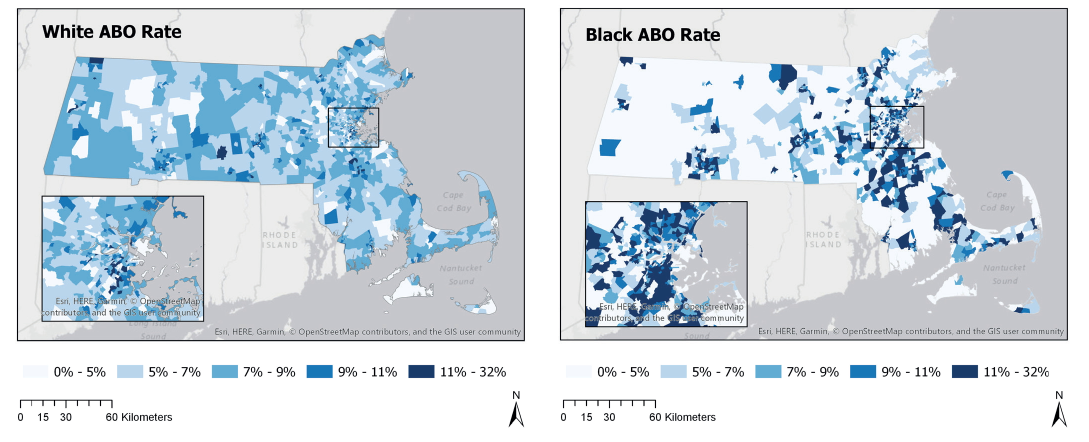
Fig. 1. ABO rates for white and black mothers
To contextualize ABO rates further, we used spatial selection tools in GIS and calculated ABO rates separately for urban, suburban and rural environments. A similar study found that urban areas in the state of Alabama had higher ABO rates (Kent et al. 2013), and we wanted to see if the same is true in our state.
To characterize ABO rates' spatial pattern, a Global Moran's Index for both races was calculated. This index classifies the spatial pattern of a measured value (i.e. ABO rate) as random, clustered or dispersed, based on the index value and corresponding Z score. If the pattern is clustered or dispersed, it indicates that the observed pattern is not due to a random chance and that an underlying spatial process leads to a particular spatial pattern (Mitchell, 2005).
To determine the strength and the nature of the relationship between ABO rates and population-level and individual- level factors, we used regressions techniques. We applied multivariate ordinary least squares (OLS) regressions with the average rate of ABO for all 15 years as the dependent variable. Three separate regressions were run for each race: regressions with only individual-level variables (health-related data from birth certificates), with only population-level variables (Census data), and with all variables together. First run of each regression identified statistically significant variables (at 95% confidence level), and then only these variables were included in the final run of each regression. Independent variables included in the final OLS models are shown in Figure 2.
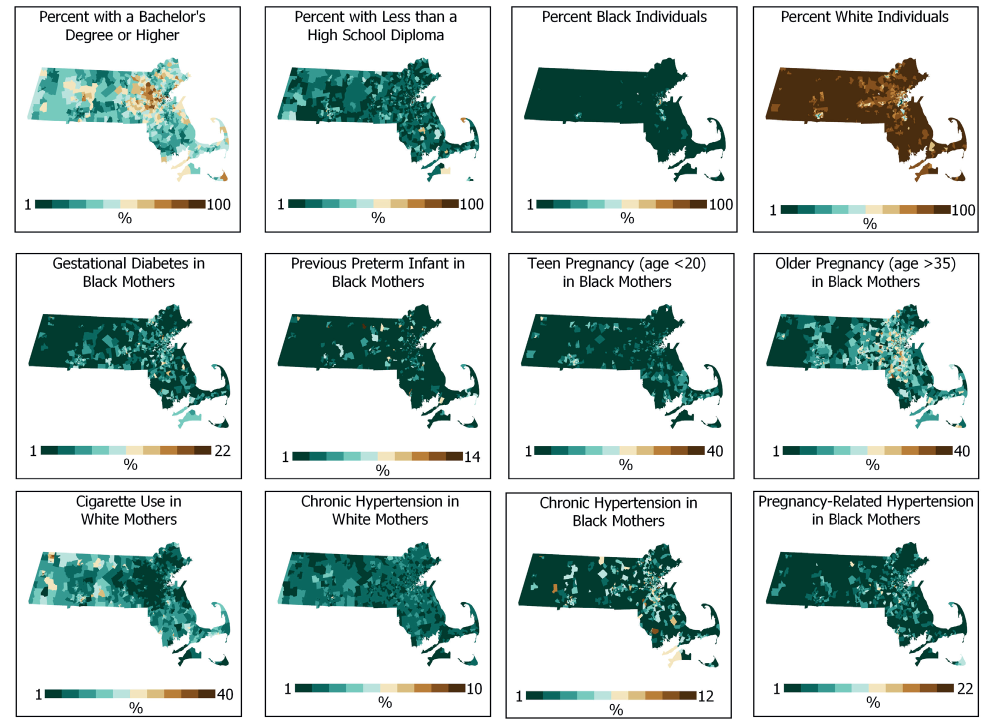
Fig. 2. Individual-level and population-level variables included in final regressions
After each regression run, a Moran's I was calculated to test for spatial autocorrelation of the residuals. Z-scores were significant in all six regressions, indicating that residuals were not randomly distributed and suggesting a model misspecification. To address this problem, the two best-fit OLS regressions were selected (one for black and one for white births) and the same variables were used as the input into a spatial regression model. We followed Anselin's (2005) process for selecting the appropriate spatial regression model. This process compares multiple test statistics calculated in GeoDa software and indicates what model - spatial lag or spatial error - would be the best choice. Both models include an additional variable that explicitly captures spatial relationships in the data. Spatial lag model includes spatially lagged dependent variable as an additional independent variable in the analysis, and the spatial error model includes a spatial autoregressive error term (Anselin 2005).
Similar to previous studies, we found that there was a racial disparity in ABO rates between white and black women; statewide raw 15-year average ABO rate for white mothers was 7%, and for black mothers - 12%. When analyzed at a census tract level, maximum ABO rates are also very different between the two races, with the maximum rate for white women (18%) being much lower than for black women (32%). When stratified by urban-suburban-rural locations, the tract-level ABO rates for both white and black mothers showed the highest values in areas designated as urban and the lowest values in rural environments (Table 2).
Table 2. Mean ABO rate (standard deviation) per census tract for black and white mothers in urban, suburban and rural locations
| urban | suburban | rural |
|---|---|---|---|
Black mothers | 10.08 (5.64) | 7.36 (5.44) | 3.65 (4.30) |
White mothers | 7.98 (2.65) | 7.45 (1.75) | 6.92 (1.47) |
Results of global Moran's I analysis indicate statistically significant clustering of ABO rates for both races (white Moran's I z-score = 4.86; black Moran's I z-score = 17.33). Maps of ABO rates confirm this finding; rates do not appear to be randomly distributed and there are several clusters of high values for both races located in different parts of the state (Figure 1).
Regression models based on individual-level variables explained 39 % of the variability in ABO rates for black women and considerably lower amount (23%) for white women (Table 3). Models that only contained population-level variables, explained similar percentages of the variance for black (21%) and white women (24%). Mixed models, containing both individual-level and population-level variables, explained 40% and 29% respectively, for black and white women.
Table 3. Ordinary least squares regression results: Adjusted R2, Akaike Information Criterion, and standardized coefficients
| Individual-level model | Population-level model | Mixed model | |||
|---|---|---|---|---|---|---|
Blacks | Whites | Blacks | Whites | Blacks | Whites | |
Adjusted R2 | 0.393 | 0.236 | 0.214 | 0.238 | 0.401 | 0.293 |
AICc | -4906.16 | -7711.88 | -4515.37 | -7720.41 | -4913.91 | -7833.96 |
Population-level variables | ||||||
Percent with a Bachelor's Degree or Higher | n/a | n/a | -0.075 | -0.301 | n/a | -0.099 |
Median Household Income | n/a | n/a | -0.108 | -0.176 | n/a | -0.152 |
Percent Race | n/a | n/a | 0.241 | -0.173 | 0.120 | -0.230 |
Percent with Less than High School Diploma | n/a | n/a | n/a | -0.054* | n/a | -0.080 |
Percent Below Poverty | n/a | n/a | 0.143 | 0.108* | n/a | n/a |
Per Capita Income | n/a | n/a | n/a | 0.116 | n/a | n/a |
Median Earnings, Fulltime Female Employees | n/a | n/a | n/a | n/a | n/a | 0.107 |
Population Density | n/a | n/a | 0.062* | n/a | n/a | n/a |
Individual-level variables | ||||||
Diabetes | 0.113 | n/a | n/a | n/a | 0.115 | n/a |
Pregnancy-Related Hypertension | 0.152 | n/a | n/a | n/a | 0.120 | n/a |
Chronic Hypertension | 0.182 | 0.138 | n/a | n/a | 0.150 | 0.080 |
Previous Preterm Infant | 0.091 | -0.044* | n/a | n/a | 0.110 | n/a |
Cigarette Use | 0.064 | 0.361 | n/a | n/a | n/a | 0.338 |
Older Mom | 0.155 | n/a | n/a | n/a | 0.137 | n/a |
Teen Mom | 0.235 | 0.143 | n/a | n/a | 0.232 | n/a |
All coefficients are significant at 95% confidence level; those marked with * are significant at 90% confidence level. Variables with an "n/a" were not included in the corresponding models.
Of the seven variables related to mothers' health and age, all were statistically significant at 95% confidence level in individual-level models for black mothers, and three - for white mothers. Percent teenage mothers has the largest effect on the ABO rates in black mothers (standardized coefficient 0.235), followed by the percent with chronic hypertension (standardized coefficient 0.182). For white mothers, the percent of mothers smoking and percent teenage mothers are the two strongest predictors (standardized coefficients are 0.361 and 0.143 respectively).
Of the nine population-level variables, education and income-related variables were statistically significant for both races at 95% confidence level, as well as percent corresponding race in the census tract. Unemployment was never a significant variable in any models.
When individual-level and population-level variables were combined in the mixed model, some of the variables remained statistically significant while others did not. For example, percent race and percent with chronic hypertension remained significant for both white and black mothers. For black mothers, all individual-level variables, except for one (percent smoking) remained significant. On the other hand, only two individual-level variables remained significant for white mothers in this mixed model. For population-level variables, an opposite pattern is present in the mixed model; while four variables remained significant for the white mothers'model (two education variables, median household income and percent white), only one variable (percent black) remained significant for black mothers' model.
The signs of the regressions coefficients were mostly in agreement with what we expected (e.g., higher percent college-educated and higher median household income were associated with lower ABO rates for both black and white mothers). Per capita income was statistically significant for white mothers, but its coefficient was the opposite of what was expected (i.e., higher per capita income was associated with higher ABO rate). Percent race was a significant variable in all models, but had different signs - positive sign for black mothers, and negative sign for white mothers.
We selected two models with the highest R2 (the mixed models) and used GeoDa software to calculate diagnostic statistics for spatial dependence. These tests showed that residuals were spatially autocorrelated in both models (z score for Moran's I for black model was 2.46; for white model - 2.48). Following model selection decision rule outlined by Anselin (2005), a spatial lag model was developed for black mothers, and spatial error model - for white mothers. To create spatial term in the equations, we experimented with different weights configurations and selected the weights that produced the best fitting regressions. We applied queen first order contiguity weights to black model, and queen second order contiguity weights - to the white model. In first order queen contiguity, census tracts that share common edges and corners are considered neighbors.
In both spatial regression models, all input variables remained statistically significant, and their coefficient signs were the same as in the OLS models. Spatial terms in both regressions (spatial lag term in the black model and spatial autoregressive error term in white model) had statistically significant coefficients with positive signs, representing spatial influence of the neighboring census tracts on ABO rates (Table 4).
Spatial regression models produced a psedo-R2 which is not directly comparable to the R2 from OLS models (Anselin 2005), so we used Log-Likelihood and AIC as measures of fit to compare these models to OLS models. In both spatial regressions, AIC value decreased and the Log-Likelihood value increased, suggesting an improvement of fit for the spatial models (Table 4).
Table 4. OLS and spatial regressions: Measures of fit and spatial term coefficients
Measure of fit | OLS model - Black | Spatial lag model - Black | OLS model - White | Spatial error model - White |
|---|---|---|---|---|
Log likelihood | 2466.02 | 2481.97 | 3926.04 | 3942.23 |
Akaike Info criterion | -4916.04 | -4945.93 | -7836.08 | -7826.24 |
Spatial term coefficient and its z-value | - | 0.1900 (5.64) | - | 0.3614 (6.06) |
After running spatial models, spatial autocorrelation was no longer present in the residuals (residuals Moran's I z-score was -0.1566 for black model; for white model 1.6653). This means that including the spatially lagged dependent variable term in the black model and spatially autoregressive error term in the white model has successfully eliminated all spatial autocorrelation.
In this study, we found that the ABO rates in Massachusetts varied considerably across census tracts and their distributions were very distinct for white and black mothers. Urban locations had higher ABO rates than suburban and rural locations. ABO rates with similar values were clustered in both races, but stronger clustering was observed in black mothers, as evidenced by their much higher z-score for Moran's I (17.33 vs. 4.86).
Most previous studies conducted the analysis at the scale of counties, metropolitan statistical areas or zip codes. Our study used census tract as the unit of analysis, because census tracts are small enough to allow for modeling of local variation in ABO rates. This spatial scale also facilitates the linking of the individual-level factors with census data and provides enough spatial detail to design a meaningful intervention or develop policy at regional or city/town level (Insaf and Talbot 2016).
When taken together, the selected socio-economic, demographic and health-related factors explained close to 30% of variability in ABO rates in white, and 40% in black mothers. When analyzed separately, individual-level and population- level factors explained the same amount of variability in ABO rates for white mothers (24%). For black mothers, individual- level factors explained almost twice the amount of ABO variability explained by the population-level factors (39% vs. 21%).
Among individual-level factors, smoking was the strongest predictor for white mothers and percent teenage mothers for black mothers (both in individual-level model, and in mixed model). To illustrate how these important findings can be useful to the health care providers and policy makers, the top 10% of tracts with the highest smoking rates for white mothers were selected, and 34 towns and cities that contain these census tracts were identified. The same process was repeated, and 31 towns and cities with the highest percent of teenage mothers for black mothers were identified. Twenty towns and cities were included in both lists, meaning that these locations have the highest smoking rates among white mothers during pregnancy and the highest rates of teen births to black mothers (Table 5). Health care providers and policy-makers in these towns and cities, armed with the findings from this study, could design targeted public outreach programs aimed at reducing smoking, especially among women, and delaying pregnancy among teenage women.
Table 5. Cities and towns containing the top 10% of census tracts with highest rates of cigarette smoking among white expectant mothers and highest rates of teen pregnancy among black women
NAME | COUNTY | TYPE | POPULATION 2010 |
|---|---|---|---|
Attleboro | BRISTOL | City | 43593 |
Brockton | PLYMOUTH | City | 93810 |
Boston | SUFFOLK | City | 617594 |
Barnstable | BARNSTABLE | Town | 45193 |
Chicopee | HAMPDEN | City | 55298 |
Fall River | BRISTOL | City | 88857 |
Fitchburg | WORCESTER | City | 40318 |
Gardner | WORCESTER | City | 20228 |
Greenfield | FRANKLIN | Town | 17456 |
Haverhill | ESSEX | City | 60879 |
Lowell | MIDDLESEX | City | 106519 |
Lynn | ESSEX | City | 90329 |
Lawrence | ESSEX | City | 76377 |
Montague | FRANKLIN | Town | 8437 |
New Bedford | BRISTOL | City | 95072 |
North Adams | BERKSHIRE | City | 13708 |
Orange | FRANKLIN | Town | 7839 |
Pittsfield | BERKSHIRE | City | 44737 |
Southbridge | WORCESTER | Town | 16719 |
Springfield | HAMPDEN | City | 153060 |
Our study had several limitations related to data sources and methodology. While birth data from the state department of Public Health is very detailed, we could not verify its quality and reliability. This data did not have information about father's health. The definition of some variables changed in the middle of our study period, rendering them unusable in the analysis (e.g., marital status and mother's education). We included population level variables measuring education level, but using mother's education level data would have been more relevant. Another limitation of the study is its inability to include other factors, which could have influenced ABO rates, such as other health conditions of the mother, psychosocial factors and potential environmental exposures. While many studies focus on either PTD or LBW, we combined them together in our analysis, recognizing that each may have a different, albeit overlapping, set of individual and population level factors. We combined them in order to increase the number of ABO outcomes in each census tract, thus alleviating the "small number problem” and increasing stability of our Empirical Bayes rates estimates.
These limitations notwithstanding, our study makes important contributions to the growing body of literature. It is the first to analyze ABO at the census tract level for an entire state, using 15 years of individual birth records. Additionally, this study is unique as it examines correlations of mother's health factors and socioeconomic factors separately as well as through a mixed model, which considers potential influences of both sets of characteristics.
The findings from our study provide Massachusetts health care providers and health-care policy makers with information regarding ABO rates and the contributing factors at a local level, giving them the ability to isolate specific areas with the highest need for targeted interventions. Examples of community-oriented public health interventions include improving access to healthy food and to primary prenatal care in low socio-economic areas, improving quality of health care accessible to expectant mothers, and increased social support in local communities (Lorch and Enlow 2016).
These interventions would help alleviate the impacts of some psycho-social stressors and reduce the risk of adverse birth outcomes. In support of these interventions, the analysis of annual ABO rates thought time at census-tract level would also be very useful.
1. American College of Obstetricians and Gynecologists (2016). Preterm (Premature) Labor and Birth. Available at: https://www.acog.org/ Patients/FAQs/Preterm-Premature-Labor-and-Birth. [Accessed 25 Apr.2019].
2. Anselin L. (2005). Exploring Spatial Data with GeoDaTM: A Workbook. Spatial Analysis Laboratory, Department of Geography, University of Illinois, Urbana-Champaign, Urbana, IL 61801.
3. Anselin L., Ibnu S., & Youngihn K. (2006). GeoDa: An Introduction to Spatial Data Analysis. Geographical Analysis, 38(1), 5-22.
4. Anselin L., Lozano N., Koschinsky J. (2006). Rate Transformations and Smoothing. Retrieved from Spatial Analysis Laboratory, Department of Geography, University of Illinois Urbana-Champaign. Available at: https://s3.amazonaws.com/geoda/software/docs/geodaworkbook.pdf [Accessed 25Apr.2019].
5. Berghella V. (2007). Prevention of recurrent fetal growth restriction. Obstetrics and Gynecology, 110(4), 904-912. DOI:10.1097/01. AOG.0000267203.55718.aa.
6. Burris H., & Hacker M. (2017). Birth outcome racial disparities: A result of intersecting social and environmental factors. Seminnars in Perinatology, 41(6), 360-366. DOI:10.1053/j.semperi.2017.07.002.
7. Carmichael S., Cullen M., Mayo J., Gould J., Loftus P., Stevenson D., Shaw G. (2014). Population-level correlates of preterm delivery among black and white women in the U.S. PLoS One, 9(4), e94153. DOI:10.1371/journal.pone.0094153.
8. Clark S., Miller D., Belfort M., Dildy G., Frye D., Meyers J. (2009). Neonatal and maternal outcomes associated with elective term delivery. American Journal of Obstetrics and Gynecology, 200(2), 156, 151-154. DOI:10.1016/j.ajog.2008.08.068
9. DeFranco E., Lian M., Muglia L., Schootman M. (2008). Area-level poverty and preterm birth risk: a population-based multilevel analysis. BMC Public Health, 8, p. 316. DOI:10.1186/1471-2458-8-316.
10. March of Dimes. (2013). Long-term health effects of premature birth. Available at: https://www.marchofdimes.org/complications/longterm-health-effects-of-premature-birth.aspx [Accessed 25 Apr.2019].
11. Goldenberg R., Culhane J. (2007). Low birth weight in the United States. The American Journal of Clinical Nutrition, 85(2), pp. 584s-590s. DOI:10.1093/ajcn/85.2.584S.
12. Honein M., Kirby R., Meyer R., Xing J., Skerrette N., Yuskiv N., Sever L. (2009). The association between major birth defects and preterm birth. Maternal and Child Health Journal, 13(2), 164-175. DOI:10.1007/s10995-008-0348-y.
13. Insaf T., Talbot T. (2016). Identifying areas at risk of low birth weight using spatial epidemiology: A small area surveillance study. Preventive Medicine, 88, 108-114. DOI:10.1016/j.ypmed.2016.03.019.
14. Institute of Medicine. (2007). Preterm Birth: Causes, Consequences, and Prevention. Washington, D.C.: The National Academies Press.
15. Kang S., Cramb S., White N., Ball S., Mengersen K. (2016). Making the most of spatial information in health: a tutorial in Bayesian disease mapping for areal data. Geospatial Health, 11(2), 428. DOI:10.4081/gh.2016.428.
16. Kent S., McClure L., Zaitchik B., & Gohlke J. (2013). Area-level risk factors for adverse birth outcomes: trends in urban and rural settings. BMC Pregnancy Childbirth, 13, 129. DOI:10.1186/1471-2393-13-129.
17. Kramer M., Hogue C. (2008). Place matters: variation in the black/white very preterm birth rate across U.S. metropolitan areas, 2002-2004. Public Health Reports, 123(5), 576-585. DOI:10.1177/003335490812300507.
18. Lorch S.A., Enlow E. (2016). The role of social determinants in explaining racial/ethnic disparities in perinatal outcomes. Pediatric Research 79(1): 141-147.
19. Lu M., Halfon N. (2003). Racial and ethnic disparities in birth outcomes: a life-course perspective. Maternal and Child Health Journal, 7(1), 13-30.
20. Manuck T. (2017). Racial and ethnic differences in preterm birth: A complex, multifactorial problem. Seminars in Perinatology, 41(8), 511-518. DOI:10.1053/j.semperi.2017.08.010.
21. Martin J., Hamilton B., Osterman M., Driscoll A., Drake P. (2018). Births: Final data for 2017. Centers for Disease Control and Prevention. National Center for Health Statistics. National Vital Statistics System. Available at: https://www.cdc.gov/nchs/data/nvsr/nvsr67/nvsr67_08- 508.pdf [Accessed Apr. 25, 2019].
22. Meng G., Thompson M.E., Hall G.B. (2013). Pathways of neighbourhood-level socio-economic determinants of adverse birth outcomes. International Journal of Health Geographics 12, 32-32.
23. Mollalo A., Blackburn J., Morris L., & Glass G. (2017). A 24-year exploratory spatial data analysis of Lyme disease incidence rate in Connecticut, USA. Geospatial Health, 12(2), 588. DOI:10.4081/gh.2017.588.
24. Centers for Disease Control and Prevention (2016). Reproductive and Birth Outcomes. Available at: https://ephtracking.cdc.gov/showRbLBWGrowthRetardationEnv.action. [Accesed 25 Apr., 2019].
25. Rosenthal L., Lobel M. (2011). Explaining racial disparities in adverse birth outcomes: unique sources of stress for Black American women. Social Science & Medicine, 72(6), 977-983. DOI:10.1016/j.socscimed.2011.01.013.
26. World Health Organization. (2018). Preterm birth. Key facts. Available at: https://www.who.int/news-room/fact-sheets/detail/pretermbirth [Accessed Jan. 6, 2020].
Ogneva-Himmelberger Ye.A., Haynes M. Spatial patterns of adverse birth outcomes among black and white women in Massachusetts – the role of population-level and individual-level factors. GEOGRAPHY, ENVIRONMENT, SUSTAINABILITY. 2020;13(1):99-106. https://doi.org/10.24057/2071-9388-2019-51

Editor-in-Chief
Kasimov Nikolay S.Lomonosov Moscow State University
Moscow 119991 Russia, Leninskie Gory, Faculty of Geography, 1806a
Phone +7 495 939-15-52
E-mail: ges-journal@geogr.msu.ru


