


Contents
Scroll to:
https://doi.org/10.24057/2071-9388-2019-68
Scroll to:
Manakov A.G., Kliimask J. Russian-Estonian border in the context of post-soviet ethnic transformations. GEOGRAPHY, ENVIRONMENT, SUSTAINABILITY. 2020;13(1):16-20. https://doi.org/10.24057/2071-9388-2019-68
The demise of the Soviet Union gave an impetus to massive ethnic transformations in the post-Soviet area. Demographic processes, especially migration, started to have a considerable impact on the pace of ethnic transformation (Khrushchev 2010). The formation of new state borders in the post-Soviet area resulted in changes in the ethnic structure of the population in border territories. The growth of the dominant ethnic groups has already become a general trend in border territories, though it has not been equally strong in all parts of the Russian-Estonian border area. The objective of this research is to determine the regional peculiarities of the ethnic and demographic processes taking place in the Russian and Estonian borderlands during the post-Soviet period.
There is an extensive body of research literature on the post-Soviet transformation of the ethnic structure of the population of Russia as a whole and of that in individual regions (Manakov 2016; Orlov 2013; Safronov 2014, 2015; Streletskiy 2011, 2017, 2018 etc.). Many research works explore ethnic and demographic processes in Estonia during the post-Soviet period (Sushchy 2018; Tammaru and Kulu 2003; Zhitin and Ivanova 2017 etc.) and study ethnic and social problems related to them (Berg 2001; Hallik 2011; Wtodarska-Frykowska 2016 etc.).
The analysis of ethnic statistics has its own specificity since the data on the national composition of the population in the Soviet Union and in post-Soviet Russia was obtained only during censuses. The last Soviet population census was in 1989. In post-Soviet Russia, there have been only two population censuses - in 2002 and in 2010. In Estonia, the population censuses have been conducted in 2000 and in 2011. Due to the fact that the national composition of the population in Estonia is calculated every year, researchers can simultaneously analyse the dynamics of the ethnic structure of population in the border administrative units and towns in Russia and Estonia during the period 19892010. Additionally, we have included ethnic statistics on Estonia for 2011 and 2016 in the research.
To sum up, we analysed the results of the USSR census in 1989 and in the Russian Federation in 2002 and 2010, which are available on Demoscope Weekly1, as well as the ethnic statistics from Estonia for 1989, 2002, 2010, 2011 and 2016, published on Population statistics of Eastern Europe & former USSR2.
Post-Soviet ethnic and demographic transformations in Russia can be divided into two types, which contributed to the growth of monoethnicity in the border territories and at the same time to its decline.
The general pace of demographic processes in border areas is defined by the polarization of population in Russia - its concentration in largest cities. That means there has been a massive migration outflow of Russian population from border areas mainly to St. Petersburg and Moscow as well as their agglomerations.
The growth of monoethnicity of border territories in Russia was caused by:
The only process that influenced the reduction of monoethnicity of Russian borderlands was an inflow of non-ethnic population from the former Soviet republics, especially from Moldova, the Transcaucasus and Central Asia. The inflow could not compensate the outflow and assimilation of the Ukrainian and Belarusian population. It resulted in the growth of the Russian population in Russian border areas in the post-Soviet period.
Post-Soviet ethnic and demographic transformations in Estonia mainly dealt with the growth of the Estonian share of the population and decreasing number of Russians and other nationalities. But in border counties of Estonia there was an exact opposite process, which we talk about below. Generally, there was an intensive outflow of population from Estonia in the 1990s - mainly Russian speaking (Russians, Ukrainians and Belarusians). At the beginning of the 21st century that outflow, including the Russian population, decreased considerably. At the same time since 2004, after the accession of Estonia to the EU, there has been a strong migration outflow of mainly Estonians from the country to EU states. Eventually the growth of the Estonian share in the country slowed down, and in the second decade of the 21st century we can see a decrease of that share in certain years.
Generally speaking, in the second decade of the 21st century, the migration outflow from Estonia was decreasing, unlike that from Latvia and Lithuania. It was a natural consequence of a more favourable economic situation in Estonia compared to the other Baltic states. However, there was a considerable decrease ofmigratory outflow ofRussians that led to a relative balance of Russians and Estonians in the ethnic structure of the population in Estonia.
Both in Russia and in Estonia the polarization of population increased in the post-Soviet period, as people moved to Tallinn and surrounding Harju county. Estonian counties bordering on Russia suffered the most. Ida-Viru county despite its natural resources and industrial traditions, became the most problematic area in Estonia in terms of low average salary and poor employment conditions. That pushed out the young generation (mostly non-Estonians) and made an inflow from other parts of Estonia highly unlikely, resulting in changes of the national structure of the population.
According to the results of the census of 1989, the population of the whole Russian-Estonian borderlands, now covering Pskov and five administrative areas of Russia, as well as five counties of Estonia, was 918.5 thousand inhabitants, including 506.8 thousand people (55.2%) in Estonia, and 411.7 thousand people (44.8%) in Russia. By 2010, the total of the population of the whole Russian-Estonian border region decreased to 788.3 thousand people, i.e. by 14.2%. The fastest rate of population decrease was registered in the border counties of Estonia - by 16.3% - whereas in the Russian border area the population decrease was 11.5%. As a result, in 2010 the population of the Estonian borderlands was 424 thousand (53.8%) and in the Russian one - 364.3 thousand people (46.2%).
The most intensive decrease in the population number was in Estonian Ida-Viru county in the period 1989-2010 (by 23.7%). It was caused by industrial decline in a number of sectors, which were established in the Soviet period. Consequently, there was a massive outflow of population. Jogeva, Polva and Voru counties were characterized by an average rate of population loss. In Tartu county the population decreased only by 7.3%, because the city of Tartu is the second largest and important population centre in Estonia.
In the Russian part of the borderlands, the most considerable decrease in population during the same period was registered in peripheral districts located far from St. Petersburg and Pskov: Gdov (by 36.7%) and Slantsy (by 29.2%). The population of Kingisepp district decreased by 15%. The minimal loss of population was observed in Pskov city and neighbouring Pskov and Pechory districts (about 5%).
In the Soviet period, Estonia experienced a considerable inflow of Russian-speaking population (mainly Russians, Ukrainians and Belarusians), who moved to the capital of the republic and to the territory of modern Ida-Viru county, where many industries were developing rapidly, for instance, energy production, mining, manufacturing, shale oil excavation, the production of construction materials, chemicals, consumer goods, etc. Ida-Viru county became the most Russian-speaking county of Estonia. In 1989, Russians accounted for almost 70% of its population. The high share of Russians was registered in all large cities of the region: in Narva the share of Russians was 86%, in Sillamae - 86.5%, in Kohtla-Jarve - 64.7%, and in Kivioli - 51.7%. Moreover, almost all the non-Estonian population in these cities was Russian-speaking.
In addition to Ida-Viru county, an increased share of Russians was observed in Tartu (Fig. 1), which is part of the Soviet ethnic legacy. But in Tartu county, as well as in neighbouring Jogeva county there are two Russianspeaking towns (Kallaste and Mustvee) and a number of smaller settlements located on the coast of Lake Peipsi, which were founded by Russian Old Believers at the end of the 17th century. But due to the small population (less than 2,000 inhabitants), these towns and settlements of Old Believers have not had a large impact on the ethnic population structure in the Estonian counties along the western coast of Lake Peipsi. The lowest share of Russians was registered in Polva and Voru counties.
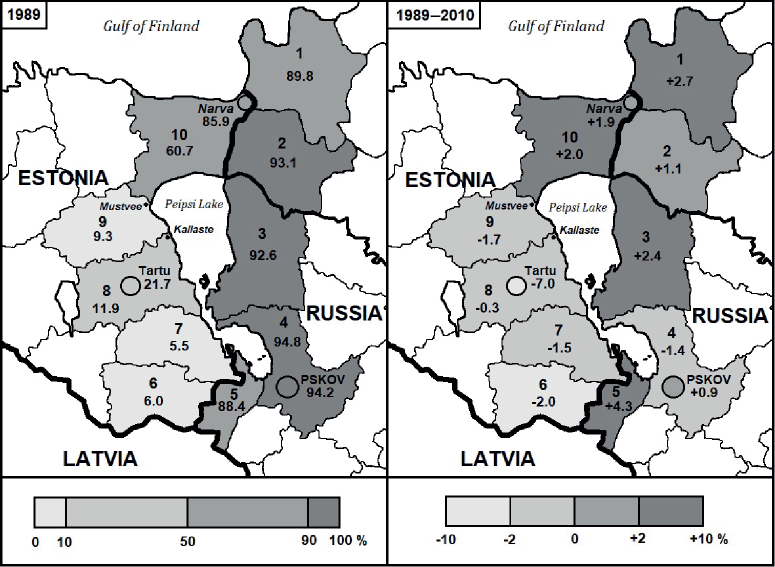
Fig. 1. The share of Russian population in border administrative units (modern borders) of Russia and Estonia based on the results of the census in 1989 and dynamics of the share from 1989 to 2010, in %
Districts of Leningrad region of the Russian Federation: 1 - Kingisepp, 2 - Slantsy; districts of Pskov region of the Russian Federation: 3 - Gdov, 4 - Pskov, 5 - Pechory; counties of Estonia: 6 - Voru, 7 - Polva, 8 - Tartu, 9 - Jogeva, 10 - Ida-Viru.
In 1989-2010, the most considerable decrease in the share of the Russian population occurred in the city of Tartu. In those Estonian counties where the share of Russians was initially low (Jogeva, Polva и Voru), the decrease in the number of Russians was lower. In this context, it was unexpected to see a growth of the share of Russian population in Ida-Viru county, which occurred despite an intensive outflow of the population from that county. A similar demographic process was typical of all Russian-speaking towns of the region: Narva, Kohtla-Jarve, Sillamae and Kivioli, in spite of the loss of a quarter to a half of their population. The main cause of this process was a decrease in the share of Ukrainians and Belarusians in Ida-Viru county due to their assimilation to the Russian population (Sushchy 2018). As a result, the Russian population experienced less considerable losses compared to other ethnic groups, excluding Estonians. It is worth noting that the largest outflow of population from Ida-Viru county was observed in the 1990s. Then it slowed down in the first decade of the 21st century and then increased again after 2010. In 2010-2016, the share of Russians in the county increased by 1.6%, reaching 73%. During the same period there was a decrease in the share of Estonians to 19.1% (-0.5%) in Ida-Viru county, which occurred for the first time in the post-Soviet period.
At the end of the Soviet period in most border areas of Russia the share of Russians exceeded 90% of the population. The Pechory district in Pskov region and the Kingisepp district in Leningrad region were the only exceptions. The border areas cannot be called completely monoethnic due to the important share of two ethnic groups: Ukrainians (2.5% of the population of the Russian borderlands) and Belarusians (1.7%). In the post-Soviet period there was a notable decrease in the shares of these ethnic groups (by 0.8 and 0.6% respectively). So even the rather massive inflow of non-Russian population from the former Soviet republics of the Transcaucasus and Central Asia did not lead to a decrease in the ethnic Russian population share.
The inflow of non-Russian migrants in the post-Soviet period resulted in the lower share of Russians in Pskov district, but in the city of Pskov and other border districts the share of Russians increased. On average, the proportion of the Russian population increased by 1.4%, with the Pechory district standing apart mainly due to an outflow of the local Baltic-Finnic population, which is discussed below.
In 1989, the share of Estonians in the territory of modern border counties of Estonia was more than half of the population (54.5%), notably less than in the republic as a whole (61.5%). At the end of the Soviet period among border counties of Estonia, only Polva county and Voru county could be called monoethnic since the share of Estonians exceeded 90% (Fig. 2). Jogeva county was also close to being a monoethnic one, but in Tartu county the share of Estonians was only 76.1%. In the territory of these two counties, the share of Estonians was particularly low in the towns of Mustvee (43,3%) and Kallaste (19.7%). But the lowest share of Estonians at the end of the Soviet period was in modern Ida-Viru county - 18.5%, reaching its lowest share in the Russian-speaking towns of the region - Narva (4.0%) and Sillamae (3.2%).
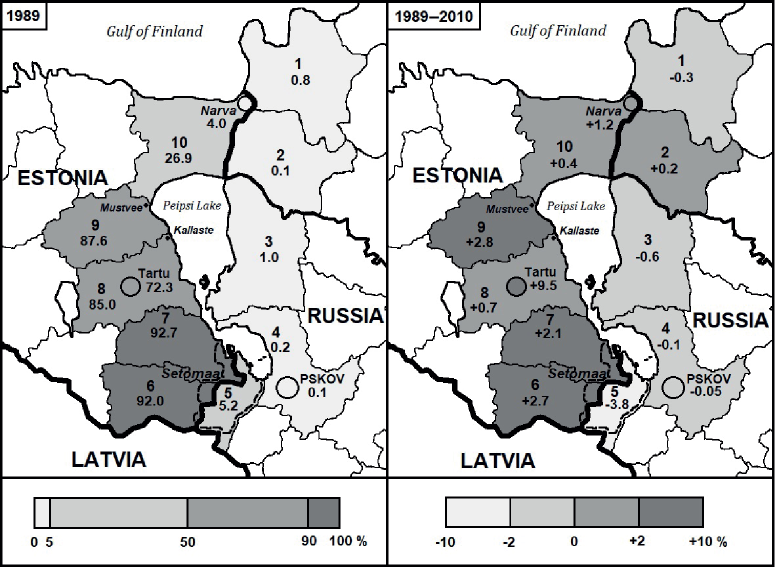
Fig. 2. Population structure of the border administrative units (modern borders) of The Baltic-Finnic nations in Russia and Estonians in Estonia based on the results of the census of 1989 and the dynamics of their share in 1989-2010, in %
Districts of Leningrad region of the Russian Federation: 1 - Kingisepp, 2 - Slantsy; districts of Pskov region of the Russian Federation: 3 - Gdov, 4 - Pskov, 5 - Pechory; counties of Estonia: 6 - Voru, 7 - Polva, 8 - Tartu, 9 - Jogeva, 10 - Ida-Viru.
During 1989-2010, the growth in the share of Estonians in the border counties (+5.8%) was lower than in Estonia as a whole (+7.3%). The largest growth in the number of Estonians was registered in Tartu, mainly due to the outflow of Russians. Jogeva county, Voru county and Polva county demonstrated a considerable increase in the proportion of Estonians. Since in Kallaste and Mustvee, towns with a notable population loss, the migration outflow was mostly composed of the local Estonian population, the share of Estonians became much smaller. A minimal growth in the Estonian population occurred in Ida-Viru county (+1.1%). The same process was also typical for the following towns of the region: Narva, Kivioli (+0.6%), Sillamae (+1.6%), and in Kohtla-Jarve, where the share of Estonians even decreased (-4.8%). Generally speaking, the growth in the number of Estonians in Ida-Viru county was caused by a decrease in the share of other minor ethnic groups and a notable migration outflow of Estonians from the region. Consequently, the demographic ratio of Russians and Estonians in Ida-Viru county changed slightly in the post-Soviet period.
In 1989 in the Russian border area, the share of the Baltic-Finnic nations increased only in Kingisepp of Leningrad region (mostly Ingrians), Gdov district of Pskov region (Estonians) and in Pechory district (Estonians and Setus). In Kingisepp district, there were about 700 Ingrians at the end of the Soviet period. In the post-Soviet period, the process of their assimilation and migratory outflow to Estonia and Finland increased and by 2010, their numbers almost halved. In Gdov district of Pskov region, the number of Estonians during the same period decreased 4-fold - from 200 to 50 people. In other border areas of Russia, the Baltic-Finnic population also assimilatedand migratory outflow. The only exception was in Slantsy district with a slight inflow of Finno-Ugrian population.
The dashed line indicates the historical territory of Setumaa.
We should also mention that Pechory area in Pskov region is the homeland of the Baltic-Finnic people called Setus (or Setos). This nation started to form in the 13th century due to the establishment of a political border between the Pskov lands with the Livonian Order to the west of the modern Russian-Estonian border. This part of the Baltic-Finnic population accepted Orthodox Christianity in the 16th century. As a result, Setus developed a different material and spiritual culture compared to Estonians, who first accepted Catholicism and later Lutheranism. In 1920, the whole territory of Setus became a part of the Republic ofEstonia, in which Petseri county (or Setumaa) was formed. In 1944, the territory of Setumaa was divided between the Estonian and Russian Soviet Federative Socialist Republics (Manakov and Mikhaylova 2015). In Estonia some territories of Setumaa became part of Polva county and Voru county, and in Russia - part of Pechory district.
According to the census of 1989, there were 1,140 Estonians in the Pechory district of Pskov region, of which about 950 of them are Setus. After the formation of the border between Russia and Estonia a migration outflow of Setus to Estonia began and continued until 2005. Our research shows that in 1999 there were about 500 Setus in Pechory district. In 2005, there were about 250 people (Manakov and Potapova 2013). Further on the migration outflow of Setus to Estonia almost stopped and the current number of Setus in Pechory district is a bit more than 200 people (Suvorkov 2017). In 2010, by the Decree of the Government of the Russian Federation Setus were included in the List of small-numbered peoples of Russia.
In Estonia, the number of Setus can be examined using the results of the census of 2011, when the population speaking different dialects of the Estonian language was counted. In Estonia, the census registered 12.5 thousand people speaking the Setu subdialect of the Voru dialect of the Estonian language. But within the Estonian part of Setumaa there are only about 1.8 thousand representatives of the Setu subdialect. In Polva county in Setrmaa there are two rural municipalities (Mikitamae and Varska) with 1,240 Setus (4.5% of the county population). In Voru county in Setumaa there is Meremae rural municipality and a part of Misso rural municipality, where there are 550 representatives of the Setu subdialect living (1.6% of the county population). These rural municipalities were included in the single municipality of Setumaa making part of Voru county. Therefore, the total number of Setus in the Russian and Estonian part of Setumaa can be estimated at 2,000 people.
The results of our research confirmed the general trend of the transformation of the ethnic structure of the population in the border areas of Russia and Estonia in the post-Soviet period. This trend manifested in the increase of the share of the dominant ethnic group (Estonians in Estonia and Russians in the border areas of Russia). However, in the post-Soviet period also the processes that could not be considered as part of the described common trend of ethnic transformation of Russia's and Estonia's population were observed. In Estonia, the growth of the share of ethnic Estonians in the population of border districts (+5.8%) was lower than the average in the country. The most Russian-speaking county of Estonia, Ida-Viru experienced a catastrophic decrease of population (almost by one quarter) as a result of a significant downscaling of the mining and manufacturing industry. However, the intensity of the migration outflow of Russians and a certain part of Ukrainians and Belarusians calling themselves 'Russians', was twice as small as the loss in the county population as a whole. It resulted in a small growth in the Russian population, especially in the towns of Ida- Viru county. A similar phenomenon was observed in two Russian-speaking towns located in the western coast of Peipsi (Chudskoe) lake: Kallaste (Tartu county) and Mustvee (Jogeva county). There was also a significant decrease in the population, but the local Estonian population was more involved in the migration outflow, which led to a decline in the share of Estonians in them. In the overwhelming majority of the regions of Russian Federation bordering Estonia the share of Russians increased while the share of Baltic-Finnish ethnic groups diminished. The most visible these processes were in Pechora district of Pskov region.
The establishment of the state border between Russia and Estonia had a negative impact upon the demography of Setus. The territory of their residence is now divided between a Russian part (Pechory district of Pskov region) and an Estonian part (Voru county). In the post-Soviet period, there was a considerable outflow of Setus to Estonia from Russia, which resulted in the fourfold decrease in their number.
1. Berg E. (2001). Ethnic Mobilisation in Flux: Revisiting Peripherality and Minority Discontent in Estonia. Space & Polity, 5(1), 5-26.
2. Hallik K.S. (2011). Russians in Estonia. In: Russians: ethno-sociological research. Moscow: Nauka, 90-119 (in Russian with English summary).
3. Khrushchev S.A. (2010). The ethnic aspects of demographic processes in the Baltic region states. Baltic Region, 4, 81-91.
4. Manakov A.G. and Potapova K.N. (2013). An ethnic-social portrait of the Setus of Pechorskii District, Pskov Region (through Case Studies of 1999-2011). Etnograficeskoe Obozrenie, 2, 177-187 (in Russian with English summary).
5. Manakov A.G. and Mikhaylova A.A. (2015). Changes in the territorial and administrative division of Northwest Russia over the Soviet period. International Journal of Economics and Financial Issues, 5, 37-40.
6. Manakov A.G. (2016). Dynamics of the national composition of the population of the North-West of Russia in 1939-2010. Pskov Journal of Regional Studies, 3, 74-96 (in Russian with English summary).
7. Orlov A.Yu. (2013). Historical and geographical aspects of the transformation of the ethnic structure of the population of the Russian Federation. Regional Studies, 2, 120-124 (in Russian with English summary).
8. Safronov S.G. (2014). Transformations in ethnic population composition in Russia in 1989-2010. Regional Research of Russia, 4(2), 38-46.
9. Safronov S.G. (2015). Russian population ethnic structure: trends and transformations. Baltic Region, 3, 106-120.
10. Streletsky V.N. (2011). Shifts in the ethnic settlement in Russia at the end of the 20 – beginning of the 21 centuries and their cultural and geographical aspects. South Russian Forum: economics, sociology, political science, social and economic geography, 1(2), 51-72 (in Russian)
11. Streletsky V.N. (2017). Ethnic, confessional and cultural patterns of regionalism in the post-Soviet Russia. Hungarian Geographical Bulletin, 66(3), 219-233.
12. Streletskiy V. (2018). Ethnic settlement shifts in Russia in 1989-2017: Main trends and cultural-geographical consequences. Practical Geography and 21 Century Challenges International Geographical Union Thematic Conference dedicated to the Centennial of the Institute of Geography of the Russian Academy of Sciences, 532.
13. Suvorkov P.E. (2017). Ethno-social portrait of the Setus of the Pechory district of the Pskov region (based on the materials of the expedition 2016). Pskov Journal of Regional Studies. 2017, 3, 55-79 (in Russian with English summary).
14. Sushchy S.Ya. (2018). Russians in the Baltic States – geodemographic trends of the post-Soviet period and prospects for the first half of the 21st century. Narodonaseleniye, 21(3), 21-36 (in Russian with English summary).
15. Tammaru T. and Kulu H. (2003). The Ethnic Minorities of Estonia: Changing Size, Location, and Composition. Eurasian Geography and Economics, 44(2), 105-120.
16. Włodarska-Frykowska A. (2016). Ethnic Russian Minority in Estonia. International Studies Interdisciplinary Political and Cultural Journal, 18(2), 153-164.
17. Zhitin D.V. and Ivanova A.A. (2017). Demographic development of the Baltic countries. Moscow: Russian Book Publishers Association (in Russian with English summary).
Pskov;
Kaliningrad
Manakov A.G., Kliimask J. Russian-Estonian border in the context of post-soviet ethnic transformations. GEOGRAPHY, ENVIRONMENT, SUSTAINABILITY. 2020;13(1):16-20. https://doi.org/10.24057/2071-9388-2019-68

Editor-in-Chief
Kasimov Nikolay S.Lomonosov Moscow State University
Moscow 119991 Russia, Leninskie Gory, Faculty of Geography, 1806a
Phone +7 495 939-15-52
E-mail: ges-journal@geogr.msu.ru


