


Contents
Scroll to:
https://doi.org/10.24057/2071-9388-2019-66
Scroll to:
Roos G., Voloshenko K.Y., Drok T.E., Zverev Yu.M. European countries’ typology by the intensity of transboundary cooperation and its impact on the economic complexity level. GEOGRAPHY, ENVIRONMENT, SUSTAINABILITY. 2020;13(1):6-15. https://doi.org/10.24057/2071-9388-2019-66
The European countries have created an open market providing free movement of goods, services, capital and ensuring the absence of confrontation between neighbouring countries. The Euroregions practice has proven to be effective in the field of economic development and production of joint solutions to emerging economic problems. Transboundary cooperation in the EU was aimed at supporting remote and peripheral border areas. National prosperity is directly related to economic complexity level, which is determined by the diversity and complexity of the country's export portfolio, which depend on the level of its technological development.
Thus, future national prosperity is a function of current and future economic complexity: the higher the level of economic complexity, the higher the potential for the creation of prosperity in a nation. In order for high economic complexity to develop into high national prosperity, the following conditions must be met (Hausmann et al., 2011; Roos 2017):
The development and production of advanced products take place in the context of interdependence, which requires cooperation between the various participants. In this regard, the question arises as to the extent to which the economic complexity influences not only internal but also external interactions of the participants, which is most clearly manifested at the level of transboundary cooperation. However, in recent years, some European countries have demonstrated a slight decrease in the intensity of transboundary interactions and fluctuations in economic complexity indicators. Therefore, there is a need for an empirical test of the hypothesis about the possible impact of transboundary interactions (taking into account the countries' typology by its intensity) on economic complexity. The paper does not consider Eastern Europe as defined by German Standing Committee on Geographical Names (StAGN).
The study aims to assess the impact of the Proposed Transboundary Intensity Index (TII), i.e. the neighbouring countries' share in the foreign trade, on the Economic Complexity Index (ECI) drawing on the example of European countries. The authors of the work are trying to answer the following questions:
Following the logic of the study, the article considers the basic concepts of the economic complexity theory and transboundary cooperation, it provides the European
Countries' Typology based on clustering using Gaussian mixture distributions by the transboundary cooperation intensity criterion, it features the analysis of longterm relationship between economic complexity and transboundary cooperation intensity using the panel data models.
The economic complexity theory was formulated and developed by Hausmann & Hidalgo (Hidalgo et al. 2009; Hidalgo et al. 2007; Hausmann et al. 2013; Hidalgo et al. 2016; Hidalgo 2018; Hidalgo et al. 2018). Economic complexity is a measure of the knowledge in a society that gets translated into the products it makes (Hidalgo et al. 2016). According to the Center for International Development at Harvard University (Hausmann et al. 2011), «the economic complexity of a country is calculated based on the diversity of exports a country produces and their ubiquity, or the number of the countries able to produce them (and those countries' complexity). Countries that are able to sustain a diverse range of productive know-how, including sophisticated, unique know-how, are found to be able to produce a wide diversity of goods, including complex products that few other countries can make».
The economic complexity is now being studied in the context of various social and economic issues, including to what extent it explains and influences the economic growth and prosperity of the countries (Hidalgo et al., 2007; Hausmann et al. 2011; Zhu et al. 2017; Stojkoski et al. 2017), income inequality (Felipe 2012; Fortunato et al. 2014; Hartmann et al. 2017), labour market (Roos 2017), structural shifts (Roos et al. 2014). There has been a link identified between it and productivity (Sweet & Eterovic 2019), foreign direct investment (FDI) (Javorcik et al. 2017), it has been discovered that more populated cities export proportionately more skill-intensive and complex goods than less populated citiesz-Lanchas, Llano, (Minondo et al. 2018). Recent years saw also works connecting it to environmental issues (see, for example, Neagu et al. 2019). The authors examine the longterm relationship between economic complexity, energy consumption structure, and greenhouse gas emission. Recent economic complexity studies concentrate on the principle of relatedness in the economic diversification, the dominance of technological innovation and optimization of knowledge diffusion (Boschma 2017; Hidalgo 2018; Hidalgo et al. 2018; Alshamsi, Pinheiro et al. 2018; Utkovski et al. 2018; Hartmann et al. 2019; Roos 2019). At the same time, it is necessary to recognize the technical issues in measuring the economic complexity level. Some of them are associated with the use of the product space method (Radosevic 2017). Evaluation of the modern practice of application and development of the economic complexity today reveals a disadvantage of limited attention to its economic and geographical context. In particular, economic complexity does not consider the transboundary cooperation impact. In broad terms, it refers to the neighbouring countries' interaction (primarily economic one) at different territorial levels. Given the close cooperation between the countries, the processes of regionalization and globalization, this factor can be crucial for economic complexity level. The study uses the concept of «transboundary intensity», meaning the country's active support for transboundary cooperation, including trade relations, which can directly or indirectly affect the level of economic complexity.
There are three basic types of transboundary interactions identified in the literature (Practical Guide to Cross-border Cooperation, 2000: 40; Scott 2017):
The first type is primarily the interaction oflocal authorities on both sides of the border, the second - the interaction mainly between regions of different countries, and the third - transboundary interaction at the country level. The latter, that is the economic interaction at the level of neighbouring countries, seems to primarily influence the economic complexity and, in turn, is influenced by it. However, for the purposes of this work this level of interaction should be considered not as interregional, but as transnational since it is a question of the interaction of neighbouring nation-states across state borders. In this sense, the authors share the position of V.S. Korneevets (Korneevets 2010: 19), who suggested to give the spatial combinations formed in the course of cooperation between states the name of transnational regions. However, transnational interactions between neighbouring states are transboundary ones and are largely determined by cross-border interactions at lower hierarchical levels (in-country regions and local authorities' levels).
The need to take into account the influence the transboundary factor has on the economic complexity level, in our opinion, mainly arises from the specific nature of the formation and development of cross-border ties (Korneevets 2010). Firstly, it is the ongoing increase in the interactions between border areas of different countries and their contact function (connected with the transit potential and the combination of various competitive factors characteristic of regions of different countries, and their specific resources) that inevitably contributes to the development of transboundary relations. This suggests that the countries with a higher intensity of transboundary cooperation have higher diversification of exports. Secondly, the border regions of neighbouring countries can often act as competitors, since similar resources and development conditions determine the production of uniform goods and services to be sold on the external market. This, on the contrary, can adversely affect the level of economic complexity. Accordingly, for certain types of countries, there may be no interdependence between transboundary cooperation and economic complexity. Thirdly, it is the current geopolitical turbulence (Druzhinin et al. 2017) and the change in the global geopolitical situation, observed over the past 20 years. It is reflected in the change in the intensity of transboundary relations and, in turn, in different periods it can have different effects on the economic complexity.
The research identifies and examines the effect of transboundary cooperation on the economic complexity on the example of European countries in 1997-2017. The considered countries are those having maritime and land borders. The study does not cover the microstates (Andorra, theVatican, Liechtenstein, Monaco, San Marino) and the island states (Great Britain, Ireland, Iceland, Malta). The preliminary sample included 32 countries: Austria, Albania, Andorra, Belgium, Bosnia and Herzegovina, Bulgaria, Czech Republic, Croatia, Denmark, Estonia, Finland, France, Germany, Greece, Hungary, Italy, Latvia, Lithuania, Luxembourg, Montenegro, the Netherlands, Norway, Poland, Portugal, Romania , Serbia, Slovakia, Slovenia, Spain, Sweden, Switzerland, TFYR of Macedonia (Republic of North Macedonia since February 12, 2019).
Searching for the possible metrics for transboundary cooperation intensity, the authors identified the following criteria: 1) the number of border crossings; 2) the number of checkpoints per kilometre of the border; 3) the share of international trade with neighbouring countries in the total international trade turnover; 4) the country's participation in the free trade zone (customs union) with neighbouring countries; 5) visa or visa-free regime with neighbouring countries; 6) the number and age of Euroregions on the common border. However, due to the lack of available statistical data or their recording by the above indicators, as well as the data for their calculation, there was only one criterion chosen, that is the neighbouring countries' share in the foreign trade. This indicator is widely known as the coefficient of cross-border specialization of foreign trade. Empirical and theoretical justifications for its use in the analysis of transboundary (cross-border) links are given in numerous papers (see, for example, Mezhevich & Zhuk 2013). Recognizing the scientific problem of determining the intensity of transboundary relations (Korneevets 2010), this paper makes an assumption of foreign trade specialization sufficiency for the characteristics of the interaction between neighbouring countries. The coefficient of cross-border specialization of foreign trade was calculated for each country as the ratio of foreign trade with adjacent territories to the country's total foreign trade turnover. In this study it is referred to as the Transboundary Intensity Index (TII). As a source of information, the authors used the UN Comtrade Database.
The dynamics of the economic complexity of selected countries was analysed using the - Economic Complexity Index (ECI). It is calculated annually by the Center for International Development at Harvard University. ECI is a rank of countries based on how diversified and complex their export portfolio is. The raw trade data on goods are derived from countries' reporting to the United Nations Statistical Division (COMTRADE). A description of the ECI calculation methodology is available in the works of Hausmann & Hidalgo (Hidalgo et al. 2007; Hidalgo & Hausmann 2009; Hausmann et al. 2011). The annual data are available at two official Internet resources: The Atlas of Economic Complexity and The Observatory of Economic Complexity.
Based on the results of the collection and analysis of available statistical data, 2 countries were excluded from the sample. The first one is Montenegro, since there is no ECI data for it on the above mentioned resources, and the paper does not include the index calculation. Second is Luxembourg , as the ECI is calculated for Luxembourg and Belgium together. The final sample consisted of 29 countries.
Identification and evaluation of the relationship between transboundary intensity and economic complexity were carried out in the following sequence. All calculations were performed using StatSoft Statistica v10.0, analysis of panel data - EViews v9.0.
Step 1. At the initial stage, the TII and ECI values for each country for were analysed for each year in the interval 1997-2017. It has been established that the relationship between the variables is weak (R2 on average varied within 0.2−0.3). Further analysis included the study of the variable dynamics for each country in the studied time period. The results obtained varied in significance and closeness of the relationships between variables. This led to the conclusion that there is a need for separate assessment for particular typological groups.
Step 2. The experimental clustering of countries was carried out according to different criteria: R2 values, correlation coefficient, TII and ECI values (separately andjointly). Calculations were carried out both with and without standardization of variable values. The best results on the statistics of typological groups were obtained by TII. The countries were later classified into clusters using the EM-algorithm basing on Gaussian mixture distributions. There were 3 clusters of countries (subpanels) identified, including 2 subpanels with a positive linear relationship: i) countries with low ECI and TII; ii) countries with medium ECI and TII and 1 subpanel with a negative linear relationship (or its absence); iii) countries with a high ECI. The transition from the first to the third group (cluster) involves the increase in the value of ECI and TII.
Step 3. Panel data analysis was carried out. There are several reasons for using panel data analysis in the study. Firstly, the results of the regression analysis conducted at the previous stage produced unsatisfactory results. Secondly, the study established a dataset with temporal and spatial dimensions. Thirdly, panel data analysis allows controlling heterogeneity and serial correlation (see, for example, Wooldridge 2007). Moreover, it is known that due to their specific structure panel data allow building flexible and informative models. They also provide the opportunity to take into account and analyse individual differences between economic units, which cannot be done within standard regression models (Baltagi 2005). As a result, the empirical analysis and the obtained panel models for typological groups made it possible to investigate the longterm correlation between the changes in economic complexity and changes in transboundary intensity.
We will provide a brief description of panel data analysis.
An array of variable values for the countries in 1997-2017 was used to form a balanced panel. The data exist for all countries for all periods of time. The panel data analysis was carried out in a known sequence (see, for example, Wooldridge 2007) and included the following main stages:
Wu (1999), Choi (2001), and Hadri (2000), as well as all three modifications (with constant, trend, constant and trend). Hadri Z-stat was analysed using Newey-West estimator taking into account possible heteroscedasticity. The cointegration between panel variables was tested using the Pedroni test (Pedroni 2004).
Analysis of changes in the transboundary intensity and economic complexity in European countries in 1997-2017
In recent years, a decrease in the intensity of transboundary interaction processes has been observed in almost all analysed groups of European countries. This manifested itself in the dynamics of cross-border specialization of international trade turnover. For ease of assessment of the transboundary intensity changes, all countries in the sample were divided into two groups: i) countries with a high - TII (more than 30%); (ii) Countries with a low TII - (less than 30%).
All the countries with the exception of Latvia and Croatia demonstrated a decrease in TII in 1997-2017. While the two countries show an increase in TII by 16.5 and 6.7% respectively. It should be noted that in the same period European countries showed similar ECI dynamics (Fig. 1 a and b).

Fig. 1. European countries' ECI in 1997-2017
Source: The Atlas of Economic Complexity, The Observatory of Economic Complexity
Given that the ECI is measured by the ubiquity and diversity of manufactured and exported products, we can put forward the following explanation: the rapid growth of economic complexity in the studied interval 1997-2017 was observed in those countries that initially had much smaller values for the indicators of both economic complexity, well-being and the pace of economic development (traditionally measured in terms of GDP per capita). These are for example Croatia, Czechia, Estonia, Greece, Hungary, Latvia, Lithuania, Netherlands, Poland, Romania and Slovakia. Therefore, the development of these countries in 1997-2017, associated with changes in their production structure and production capabilities due to the expansion of their knowledge and capability base, led to the development of more technologically sophisticated products, which accordingly affected the growth of ECI. At the same time, the so-called effect of a low (or zero) base was not typical for countries with a higher level of development and ECI. Given that the number of countries producing complex products grew, and the emergence of new technologically complex types of products occurs at a slightly lower rate, countries with initially high ECI in 1997 somewhat reduced their positions and their index values went down. These are the representative examples of the following European countries with the largest total (cumulative) ECI decrease: Italy (-0,434), Austria (-0,341), Denmark (-0,333), Sweden (-0,315), Finland (-0,276), Germany (-0,275), France (-0,269), Belgium (-0,265). For example, Fig. 2 shows a comparison of the Product Space within the framework of Economic Complexity for Estonia and Italy in 1997 and 2016. These countries demonstrated (respectively) the largest increases and decreases in ECI among the European countries. It is indicative that during the study period, Estonia showed the increase in ICT from 5.19 to 13.04%, and in electrical line telephonic and telegraphic apparatus from 2.84 to 7.65%, and the increase in the production structure complexity (Fig. 2.1). At the same time, export structure in Italy has remained relatively stable, with the shares being redistributed among ICT, Transport, Travel and Tourism within 2-3% (Fig. 2.2), the ratio between complex products types has changed but not fundamentally. Thus, it can be assumed that the main reason for the reduction in ECI in the group of more developed countries was the decrease in the prevalence of complex products accompanied by insufficient pace of economic diversification.
Fig. 2.1. Estonia

Fig. 2.2. Italy

Fig. 2. Comparing the Product Space within the framework of Economic Complexity
Note: X-axis -distance, Y-axis - complexity
Source: The Atlas of Economic Complexity. www.atlas.cid.harvard.edu
The analysis of the ECI and TII dynamics reveals that not all countries in the sample have a direct correlation between them, the growth of cross-border trade is not always accompanied by the increase in economic complexity and vice versa. This is particularly true in relation to such countries as Czech Republic, Estonia, Lithuania, Netherlands, Poland,
Norway, Slovakia, where in 1997—2017 the level of economic complexity increased while the transboundary intensity went down. Bulgaria, Finland, Portugal and Sweden showed an opposite trend - the transboundary intensity was increasing while the economic complexity was decreasing (Fig. 3).

Fig. 3. Comparison of cumulative changes in ECI and TII of European countries in 1997—2017 (1997 - 100%)
Source: calculated and compiled by the authors
The direct and inverse correlation between the economic complexity and transboundary cooperation can be fixed at the level of different typological groups of countries by the degree of intensity of the latter. In order to assess the dependence of the variables, the countries were classified by the transboundary intensity level, this was followed by a panel data analysis at the level of selected groups of countries (subpanels).
Countries' typology by transboundary intensity
To classify the European countries by the level of transboundary intensity, a regression analysis of the data on the initial base for the entire population and each country was carried out separately for the 1997-2017.
According to the results of the preliminary regression analysis for the studied countries, an ambiguous situation has developed. Some countries are characterised by a strong linear relationship, while in the others the relationship between transboundary intensity and economic complexity is either absent or non-linear. For the entire sample, the Pearson correlation coefficient (r) was 0.4386, and the coefficient of determination (R2) was respectively 0.1924 (p = 0.000). Kolmogorov-Smirnova and Shapiro-Wilka test reject the hypothesis about the normal distribution for the entire sample of countries (for TII: pw-s<0.01 pw=0.00; for ECI: pw-s<0.1 pw=0.00). It was revealed that the linear moderate and strong ECI and TII connections are not found in all the countries. There are considerable differences at the level of correlation significance (p - values). It should be noted that the estimated values of R2 and Pearson's coefficients have the disadvantages of low resistance to outliers in the original sample, and also impose limitations on linearity and monotony of data changes. In this regard, non-parametric statistics were evaluated using the Spearman coefficient. For the entire sample of countries, the values turned out to be slightly lower than the Pearson coefficient: 0.4136 (p = 0.000). Due to unsatisfactory results, further analysis by country is not given.
In this regard, in the next step, using a Gaussian mixture of distributions (GMM), countries were clustered in order to identify subpanels for the subsequent panel data analysis. In recent years, finite Gaussian mixtures in real processes and phenomena modelling has been used in growing number of fields of science and practice: in pattern and speech recognition, biology, medicine, geography, physics and chemistry, neuroinformatics, sociology and economics, etc. (see for example, Kozhevnikova et al. 2012; Seethalakshmi et al. 2014; Compiani et al. 2016). GMM-based sample objects grouping has a number of advantages comparing to other known approaches, for example, k-medians clustering, such as smoothness (infinite differentiability), identifiability, completeness, resolution (Aprausheva et al. 2015).
The obtained country grouping is validated by Gaussian mixture distribution itself. Even with a strong mutual penetration or intersection of classes (types, groups), the algorithm shows a adequate result on the maximum likelihood of the original sample (Aprausheva et al. 2015). In the process of clustering, normally distributed groups within the total sample are analysed (Reynolds 2009).
GMM and data research is performed in this work using the sci-kit-learn package of the Python programming language. The EM-algorithm for sequential addition of components was used to determine the optimal clustering for the subsequent distribution of countries between the optimal number of groups according to the level of transboundary activity. Estimation of the distribution made it possible to establish that the initial sample of countries is best described when divided into three clusters.
The first cluster (type): Albania, Bosnia Herzegovina, Bulgaria, Croatia, Netherlands, Norway, Portugal, Serbia, Slovenia, Switzerland, TFYR of Macedonia. The second cluster (type) group: Austria, Belgium, Denmark, France, Hungary, Italy, Latvia, Lithuania, Romania, Spain. The third cluster (type): Czech Republic, Estonia, Finland, Germany, Greece, Poland, Slovakia, Sweden.
For the first group (subpanel), the smallest values of the variables are characteristic; for the second and third, the level of transboundary intensity is almost the same, Fig.4).
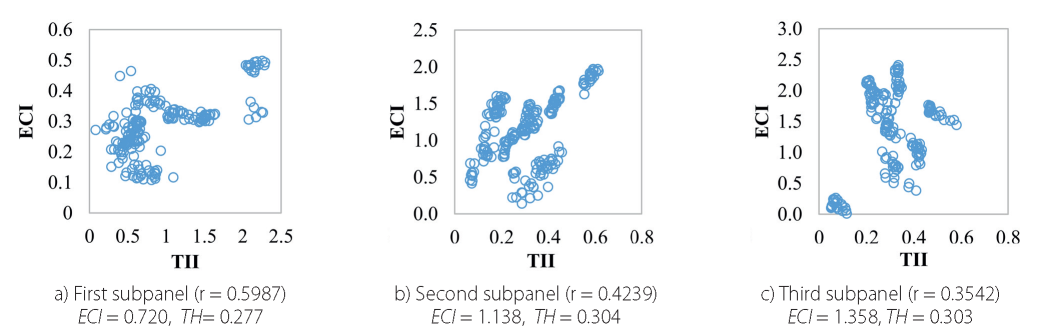
Fig. 4. Scatter plots, European countries groups, 1997-2017
Source: author's calculations
At the same time, the third cluster (subpanel) includes the countries with the negative correlation between economic complexity and transboundary intensity identified using Spearman-Pearson coefficient (7 out of 10 countries have negative ECI and TII correlation).
It has been noted that the closeness of the connection between the transboundary intensity and economic complexity decreases with the growth of the latter. The greater is the level of economic complexity, the less the country's transboundary activities affect its change. To test this assumption and assess the direction of the transboundary intensity effect on the economic complexity (direct or inverse correlation), panel data were analysed and econometric models were constructed in accordance with the algorithm described in Section 3.
Panel data analysis: the impact of transboundary intensity on economic complexity by country type
It is known that, in contrast to simple regression models, the panel data analysis makes it possible to take into account individual differences between objects (Verbeek 2003), or between countries in this case. In addition, it allows to reduce the dependence between explanatory variables, and, consequently, standard estimation errors, and to prevent the aggregation displacement, which occurs during the analysis of time series and spatial data (Ratnikova 2006).
The brief results obtained in accordance with the above mentioned approach can be found below.
The initial data testing leads to the following conclusion: there is a problem of spatial correlation and heteroscedasticity, however, the series is stationary in terms of first difference and there is joint integration indicating the possibility of estimating the long-term correlation between the variables. In long-term variables can be regressed in the same model without taking the difference.
To create FMOLS and DMOLS models, their various modifications were used for the trend specification (constant (level), trend), for the panel method (pooled, pooled (weighted), grouped), lag method (for example, fixed or Schwarz). The next step was the selection of models with the best R2 values, the regression coefficient of at least 5% significance, positive results of stationary residuals testing and Jarque-Bera statistics for normal distribution (for df =2and significance level 5%, not more than 5.991) (Green 2005). As a result, the quality and reliability of DMOLS were higher compared to the FMOLS and OLS models, and these models were used for further analysis.
The first sub-panel of countries is characterized by a direct dependence of economic complexity on transboundary intensity. According to the model specification and equation, a 1% ECI change occurs when transboundary intensity increases by only 0.45%.
For the second subpanel countries, economic complexity changes when transboundary intensity grows by 1.21%. Given that the average ECI value in the second subpanel countries is higher, it can be concluded that with increasing economic complexity, the influence of the transboundary factor becomes weaker.
For the third group, given that it includes countries with a negative correlation between economic complexity and transboundary cooperation, there was a model describing a particular correlation constructed. In the third sub-panel, the growth of economic complexity is associated with a 2.43% decrease in transboundary intensity. For the same reason, the conclusions cannot be extended to all the countries surveyed, and there is a need for a more in-depth analysis. For example, it is necessary to study whether the negative correlation of variables is a consequence of the characteristics of transboundary processes in countries, their economic structure or the product space, or whether the correlation with the transboundary factor becomes negative when a certain level of economic complexity and level of economic development is reached. Of course, finding answers to these questions requires consideration of a much larger number of factors in the model, as well as an increase in the spatial (geographical) dimension of the sample of the countries.
At the same time, it should be recognized that the assessment and analysis of changes in the transboundary intensity and economic complexity of European countries made it possible to establish not only the existence of the connection between them. The calculations confirm the speculative conclusions of the changing role of transboundary relations as not only the complexity of the economy increases, but also the economy in general grows. For example, for emerging economies, the reduction of trade barriers leads to the intensification of transboundary interactions with neighbouring countries (Foster et al. 2011). This becomes a powerful driver and an important source of diversification and economic growth for a country. However, the subsequent growth of production capacities in a country in the context of the globalization inevitably leads to its active integration and inclusion into global production chains. The geography of international relations has significantly changed. The priority has shifted to the integration into the global economy rather than further strengthening and supporting transboundary interactions. For example, the above features of transboundary development can be traced quite well in such European countries as the Czech Republic, Estonia, Lithuania, Poland, etc. Corresponding dependencies can be also observed in the countries' economic complexity levels. In the early stages of the increase of economic complexity, transboundary links are indeed important, both in terms of export capacity increase and active scientific and technological exchange, for the growth of the countries' own production capabilities. This is confirmed by the calculations at the level of European countries of the first type (cluster). They are characterized by high elasticity of changes in economic complexity with increasing transboundary intensity (e.g., Bosnia and Herzegovina, Bulgaria, Croatia, Slovenia, Switzerland, North Macedonia). The gradual increase in the economic complexity reduces the economy's dependence on transboundary interactions, since other factors, in particular, those contributing to the expansion of the knowledge and capability base, have a greater influence on the growth of economic complexity. These processes are characteristic of the second type of European countries, as the impact the transboundary intensity on economic complexity decreases, i.e. a greater increase in transboundary interactions is required to increase economic complexity. The indicators of economic complexity for developed countries and exporters of complex products (machinery, equipment and tools, metals and materials, chemistry and pharmaceuticals) are no longer dependent on the intensity of transboundary interactions. For the countries of the third group including Germany, Sweden, Finland, Estonia, Poland, the Czech Republic, and Greece, the correlation between economic complexity and transboundary interactions intensity becomes inverse. Thus, transboundary interactions, initially being a factor for the growth of economic complexity, are being replaced by the global economic processes.
The concept of economic complexity uses the idea of interconnections in the global market, presenting international trade data as a two-way network in which countries are connected by exported products, with the diversification of exported products being a major factor. The analysis base is empirical observations showing that the most competitive countries have diversified exports, while developing countries export only a few products, as a rule, already exported by many other countries. According to economic complexity theory, the level of export diversification reflects the level of the country's industrial development.
This study focuses on the economic and geographical aspect of economic complexity, which is expressed in its dependence on transboundary intensity. The prerequisite for this hypothesis is a number of empirical and theoretical studies (A more united and stronger central Europe... 2018; Hornstrom et al. 2015; Land-based spatial planning... 2015; Socio-economic challenges. 2018; Wassenberg et al. 2015; etc.) confirming the importance of transboundary cooperation development. At the same time, the technological cooperation between countries can have the key role in economic complexity.
To study the relationship between transboundary cooperation and economic complexity, the authors apply the concept of transboundary intensity. It is assumed that the more actively the neighbouring countries are involved in various types of mutual international trade operations, the higher the transboundary intensity is. The search for a transboundary intensity metric included the consideration of various criteria. However, taking into account the data availability for all the countries in the sample for the period of 1997-2017, the authors have selected the coefficient of cross-border specialization of foreign trade as the main indicator, referred to in this paper as a Transboundary Intensity Index (TII). The Economic Complexity Index (ECI) was used to measure economic complexity. The data sources used were the UN Comtrade Database and The Atlas of Economic Complexity.
The study used various approaches to distinguish between the types of countries. The TII basis provided the best statistical results for the typological group. The countries were classified into clusters using Gaussian mixture distributions. The method was chosen due to such advantages as smoothness (infinite differentiability), identifiability, completeness, resolution. In addition, the method is the best one for the identification of clusters for the purposes of stabilization of the maximum likelihood of the initial sample. The method was implemented and the study of the data was carried out using the sci- kit-learn, a machine learning package in the Python programming language. There were 3 clusters identified using the criterion of transboundary intensity. The results of a preliminary assessment of the types of countries (subpanels) showed the following dependence: the higher the economic complexity, the less its change is influenced by the country's transboundary intensity, and the correlation between variables becomes inverse. This hypothesis was tested by the analysis of panel data and the construction of models.
In general, the construction and evaluation of panel models verify the authors' hypothesis about the dependence (and its change) between the transboundary intensity and economic complexity. This is confirmed by the differences in the results obtained at the level of identified country types. For example, the increase in the initially low transboundary intensity is associated with significant growth in the economic complexity level. This is typical for the first type of countries. As the transboundary intensity increases, its impact on economic complexity weakens. This situation is typical for the second type of countries. While a further increase in economic complexity has an inverse connection with transboundary intensity. These are the results for the third type of countries.
The results of the study suggest that as the economy becomes more complex, its dependence on transboundary interaction decreases, since other factors, in particular, those contributing to expanding their knowledge and capability base, have a greater influence on the growth of economic complexity. Thus, the countries with low and high transboundary intensity are characterized by different connections with and effects on economic complexity. In the first case, the strengthening of transboundary relations is a driver for the growth of economic complexity. On the contrary, for the second type, the orientation to crossborder markets will significantly hamper the potential for growth of the number of complex products in the export basket. In terms of their role and importance, international relations and globalization processes begin to prevail over transboundary ties and regionalization processes, despite the fact that in earlier studies special importance was attached to the contractual functions of the territories (Korneevets 2010).
However, it should be noted that the study and the above approach has certain limitations. These are the insufficient number of indicators used to assess the transboundary intensity and the need to verify the findings using a larger number of geographic areas of various types of countries. In addition, the cluster analysis and identification of typological groups should be expanded to include other indicators characterizing the level of socio-economic development of countries (GDP, investment, employment, income, etc.). All these issues are certainly of methodological and practical interest. However, the main objective of this study was to identify the fact and characteristics of the connections and the interdependence of transboundary intensity and economic complexity.
The results of the study are significant for understanding the relationship between transboundary links and economic complexity. However, they make an even greater contribution to the development of new approaches and to the study of factors and conditions, the potential and constraints of the development of territories that differ in transboundary relations closeness.
Notes
1. A more united and stronger central Europe needs transnational cooperation (2018). Input paper of the Interreg CENTRAL EUROPE Programme. [online]. Available at: www.interreg-central.eu/Content.Node/discover/Input-Paper.pdf [Accessed 11 May 2019].
2. Alshamsi A., Pinheiro F.L. & Hidalgo C.A. (2018). Optimal diversification strategies in the networks of related products and of related research areas. Nature Communications, 9 (1). DOI: 10.1038/s41467-018-03740-9.
3. Aprausheva N.N. & Sorokin S.V. (2015). (Notes on gauss mixtures), VC RAN (in Russian.). DOI: 10.13140/RG.2.2.33609.34404.
4. Baltagi B.H. (2005). Econometric Analysis of Panel Data. John Wiley & Sons. Boschma R. (2017). Relatedness as driver of regional diversification: A research agenda. Regional Studies, 51 (3), 351–364. DOI: 10.1080/00343404.2016.1254767.
5. Brillet J.L. (2011). Structural Econometric Modelling: Methodology and Tools with Applications under EViews 2016. [online]. Available at: www.eviews.com/StructModel/structmodel.pdf [Accessed 14 Apr. 2019].
6. Compiani G. & Kitamura Y. (2016). Using mixtures in econometric models: a brief review and some new results. The Econometrics Journal, 19, 95–127. DOI: 10.1111/ectj.12068.
7. Díaz-Lanchas J., Llano C., Minondo A. & Requena F. (2018). Cities export specialization. Applied Economics Letters, Taylor & Francis Journals, 25 (1), 38–42. DOI: 10.1080/13504851.2017.1290784.
8. Dogan, E. & Aslan A. (2017). Exploring the relationship among CO2 emissions, real GDP, energy consumption and tourism in the EU and candidate countries: Evidence from panel models robust to heterogeneity and cross-sectional dependence. Renewable and Sustainable Energy Reviews, 77, 239–245. DOI: 10.1016/j.rser.2017.03.111.
9. Druzhinin A.G., Gorochnya V.V., Gontar N.V., et al. (2017). Transboundary Clusters in the Coastal Cones of the European Part of Russia: Inventory, Typology, Factors, and Prospects, Baltic Region, 9 (4), 29–44. DOI: 10.5922/2074-9848-2017-4-2.
10. Felipe J. (2012). Tracking the Middle-Income Trap: What is It, Who is in It, and Why? Part 2, No 307, ADB Economics Working Paper Series, Asian Development Bank. Fortunato P. & Razo C. (2014). Export sophistication, growth and the middle-income trap. In Salazar-Xirinachs J. M., Nübler I. and KozulWright R. (eds.), Transforming Economies: Making Industrial Policy Work for Growth, Jobs and Development, International Labour Office, Geneva: ILO.
11. Foster N., Hunya G., Pindyuk O., Richter S. (2011). Revival of the Visegrad Countries’ Mutual Trade after their EU Accession: a Search for Explanation. Wiener Institut für Internationale Wirtschaftsvergleiche (wiiw). Research Reports 372. [online]. Available at: www.wiiw.ac.at/ revival-of-the-visegrad-countries-mutual-trade-after-their-eu-accession-a-search-for-explanation-dlp-2449.pdf [Accessed 11 May 2019].
12. Green W.H. (2005). Econometric Analysis. Pearson Education International. Hartmann D., Bezerra M., Lodolo B. & Pinheiro F.L. (2019). International trade, development traps, and the core-periphery structure of income inequality. [online]. Available at: SSRN: www.ssrn.com/abstract=3312097 or DOI: 10.2139/ssrn.3312097.
13. Hartmann D., Guevara M.R., Jara-Figueroa C., Aristara´N, M. & Hidalgo C.A. (2017). Linking Economic Complexity, Institutions, and Income Inequality. World Development, 93, 75–93. DOI: 10.1016/j.worlddev.2016.12.020.
14. Hausmann R., Hidalgo C.A., Bustos S., Coscia M., Simoes A. & Yildirim M.A. (2011). The Atlas of Economic Complexity: Mapping Paths to Prosperity. MIT Press. Hidalgo C.A. (2018). From useless to keystone. Nature Physics, 14, 9–10. DOI: 10.1038/nphys4337.
15. Hidalgo C.A. et al. (2018). The Principle of Relatedness. In: Morales A., Gershenson C., Braha D., Minai A., Bar-Yam Y. (eds) Unifying Themes in Complex Systems IX. ICCS 2018. Springer Proceedings in Complexity. Springer, Cham. DOI: 10.1007/978-3-319-96661-8_46.
16. Hidalgo C.A. & Hartmann D. (2016). Economic complexity, institutions, and income inequality, OECD Insights. [online]. Available at: www. oecd-ilibrary.org/economics/debate-the-issues-complexity-and-policy-making_9789264271531-e [Accessed 31 Mar. 2019].
17. Hidalgo C.A. & Hausmann R. (2009). The building blocks of economic complexity. PNAS, 106 (26), 10570–10575. DOI: 10.1073/pnas.0900943106.
18. Hidalgo C.A., Klinger B., Barabási A.-L. & Hausmann R. (2007). The Product Space Conditions the Development of Nations. Science, 317 (5837), 482–487. DOI: 10.1126/science.1144581.
19. Hörnström L., Diş A.T., Berlina A. (2015). Added value of cross-border co-operation. Cross-border co-operation: still an undeveloped potential? Nordregio News, 1, 3–7. Javorcik B., Lo Turco A. & Maggioni D. (2017). New and improved: Does FDI boost production complexity in host countries? Economic Journal, 128 (614), 2507–2537. DOI: 10.1111/ecoj.12530.
20. Korneevets V.S. (2010). (International regionalization in the Baltic Sea), Saint Petersburg (in Russian.). Kozhevnikova I., Shveikina V. & Domínguez E. (2012). Modelling Caspian Sea fluctuations. J. Flood Risk Manage, 5, 3–13. DOI: 10.1111/j.1753- 318X.2011.01116.x.
21. Land-based spatial planning and the added value of cross-border cooperation (2015). Background paper. Baltic SCOPE. 42 p. [online]. Available at: www.balticscope.eu/content/uploads/2016/11/Land-based-spatial-planning-and-the-added-value-of-cross-bordercooperation.Final_.Nov09.pdf [Accessed 11 May 2019].
22. Mezhevich N.M., Zhuk N.P. (2013). Cross-border specialization of interregional interaction: applying new assessment methods. Baltic Region, 1 (15), 38-52. DOI: 10.5922/2074-9848-2013-1-3.
23. Neagu O. & Teodoru M.C. (2019). The Relationship between Economic Complexity, Energy Consumption Structure and Greenhouse Gas Emission: Heterogeneous Panel Evidence from the EU Countries. Sustainability, 11 (2), 497. DOI: 10.3390/su11020497.
24. Neagu O. & Teodoru, M.C., (2019). The Relationship between Economic Complexity, Energy Consumption Structure and Greenhouse Gas Emission: Heterogeneous Panel Evidence from the EU Countries. Sustainability, MDPI, Open Access Journal, 11 (2), 1–29. DOI: 10.3390/su11020497.
25. Pedroni P. (2000). Fully Modified OLS for heterogeneous cointegrated panels. In: Baltagi B.H., Nonstationary panels, panel cointegration and dynamic panels, Amsterdam: Elsevier, 93–130.
26. Pedroni P. (2004). Panel cointegration: asymptotic and finite sample properties of pooled time series with an application to the PPP hypothesis. Economic Theory, 20 (3), 597–625. DOI: 10.1017/S0266466604203073.
27. Perkmann, M. (2003). The rise of the Euroregion. A bird’s eye perspective on European cross-border co-operation. Lancaster University. Department of Sociology. 19 p. [online]. Available at: www.pdfs.semanticscholar.org/f420/d587e6e9801a95e450634970f33005ec1479.pdf [Accessed 11 May 2019].
28. Practical Guide to Cross-border Cooperation. Third Edition (2000). Association of European Border Regions (AEBR). European Commission. [online]. Available at: www.aebr.eu/files/publications/lace_guide.en.pdf [Accessed 11 May 2019].
29. Radosevic S. (2017). Assessing EU Smart Specialization Policy in a Comparative Perspective. In Advances in the Theory and Practice of Smart Specialization, Academic Press, 1–36. DOI: 10.1016/B978-0-12-804137-6.00001-2.
30. Ratnikova T.A. (2006). The introduction to the econometric analysis of panel data (in Russian), The Economic magazine of Higher school of economics, 3, 492–519.
31. Reynolds, D. (2009). Gaussian Mixture Models. In: Li S.Z., Jain A. (eds) Encyclopedia of Biometrics. Springer, Boston, MA. Roos G. (2017). Technology-Driven Productivity Improvements and the Future of Work: Emerging Research and Opportunities. Hershey, PA: IGI Global, 1-255. DOI: 10.4018/978-1-5225-2179-2.
32. Roos G. & Kennedy N. (2014). Global Perspectives on Achieving Success in High and Low Cost Operating Environments. IGI Global, Hershey, PA, USA. DOI: 10.4018/978-1-4666-5828-8.
33. Roos G., Cheshire A., Nayar S., Clarke S. M. & Zhang W. (Eds.) (2019). Harnessing Marine Macroalgae for Industrial Purposes in an Australian Context: Emerging Research and Opportunities. Hershey, PA: IGI Global. Scott J.W. (2000). Euroregions, Governance and Transborder Co-operation within the EU. Borders, regions and people. European research in regional science, 10, 104–115.
34. Scott J.W. (2017). Cross-Border, Transnational, and Interregional Cooperation. Richardson D. (Ed.) The International Encyclopedia of Geography. DOI: 10.1002/9781118786352.wbieg0616.
35. Seethalakshmi R., Saavithri V. & Vijayabanu C. (2014). Gaussian Scale Mixture Model for Estimating Volatility as a Function of Economic Factor, World Applied Sciences Journal, 32 (6), 1035–1038. DOI: 10.5829/idosi.wasj.2014.32.06.783.
36. Socio-economic challenges, potentials and impacts of transnational cooperation in central Europe (2018). Final Report. The Vienna Institute for International Economic Studies (wiiw) and Interreg CENTRAL EUROPE. 266 p. [online]. Available at: www.interreg-central.eu/Content.Node/events/Final-Report-181018-full.pdf [Accessed 11 May 2019].
37. Stojkoski V. & Kocarev L. (2017). The Relationship Between Growth and Economic Complexity: Evidence from Southeastern and Central Europe. MPRA Paper, University Library of Munich, Germany. Sweet C. & Eterovic D. (2019). Do patent rights matter? 40 years of innovation, complexity and productivity. World Development, 115 (C), 78–93. DOI: 10.1016/j.worlddev.2018.10.009.
38. Utkovski Z., Pradier M.F., Stojkoski V., Perez-Cruz F. & Kocarev L. (2018). Economic complexity unfolded: Interpretable model for the productive structure of economies. PloS one, 13 (8), e0200822. DOI:10.1371/journal.pone.0200822.
39. Verbeek M. (2003). A Guide to Modern Econometrics. John Wiley & Sons. Wassenberg B., Reitel B., Peyrony J., Rubió J. (2015). Territorial Cooperation in Europe - A Historical Perspective. Luxembourg: Publications Office of the European Union.
40. Wooldridge J.M. (2007). Econometric Analysis of Cross Section and Panel Data. MIT Press. 1.
41. Zhu S. & Li R. (2017). Economic complexity, human capital and economic growth: empirical research based on cross-country panel data. Applied Economics, 49 (38), 3815–3828. DOI: 10.1080/00036846.2016.1270413.
Roos G., Voloshenko K.Y., Drok T.E., Zverev Yu.M. European countries’ typology by the intensity of transboundary cooperation and its impact on the economic complexity level. GEOGRAPHY, ENVIRONMENT, SUSTAINABILITY. 2020;13(1):6-15. https://doi.org/10.24057/2071-9388-2019-66

Editor-in-Chief
Kasimov Nikolay S.Lomonosov Moscow State University
Moscow 119991 Russia, Leninskie Gory, Faculty of Geography, 1806a
Phone +7 495 939-15-52
E-mail: ges-journal@geogr.msu.ru


